Indian Mound-Bumpus Mills, Tennessee
Submit your own pictures of this place and show them to the world
- OSM Map
- Google Map
- MSN Map
| Males: 3,259 | |
| Females: 3,177 |
| Median resident age: | 36.4 years |
| Tennessee median age: | 35.9 years |
Zip code: 37058
| Indian Mound-Bumpus Mills: | $62,126 |
| TN: | $65,254 |
Estimated per capita income in 2022: $28,273 (it was $15,957 in 2000)
Indian Mound-Bumpus Mills CCD income, earnings, and wages data
Estimated median house or condo value in 2022: $207,384 (it was $76,400 in 2000)
| Indian Mound-Bumpus Mills: | $207,384 |
| TN: | $284,800 |
Indian Mound-Bumpus Mills, TN residents, houses, and apartments details
Detailed information about poverty and poor residents in Indian Mound-Bumpus Mills, TN
Compare current foreclosures near your location:
| Photo | Address | Area | Beds / Baths | Price | Details |
|---|---|---|---|---|---|

|
#1
N Rhodes St
Pretty Prairie, KS 67570
|
1,725 sq. feet
|
2 baths 4 beds |
show details | |

|
#2
S Goddard Rd
Goddard, KS 67052
|
1,054 sq. feet
|
2 baths 2 beds |
show details | |

|
#3
W 21st St N
Cheney, KS 67025
|
3,190 sq. feet
|
3 baths 5 beds |
show details | |

|
#4
E Winterset St
Goddard, KS 67052
|
816 sq. feet
|
1 baths 2 beds |
show details | |

|
#5
NE Waterloo Ave
Murdock, KS 67111
|
1,220 sq. feet
|
1 baths 3 beds |
show details | |

|
#6
W 39th St S
Goddard, KS 67052
|
4,221 sq. feet
|
3 baths 3 beds |
show details | |

|
#7
E Arlington Rd
Haven, KS 67543
|
960 sq. feet
|
1 baths 2 beds |
show details | |

|
#8
S 391st St W
Cheney, KS 67025
|
2,558 sq. feet
|
3 baths 3 beds |
show details | |

|
#9
SE Viney Ave
Murdock, KS 67111
|
- sq. feet
|
- baths - beds |
show details | |

|
#10
N 189th Cir W
Colwich, KS 67030
|
- sq. feet
|
- baths - beds |
show details |
| Photo | Address | Area | Beds / Baths | Price | Details |
|---|---|---|---|---|---|

|
#11
N Main St
Goddard, KS 67052
|
- sq. feet
|
- baths - beds |
show details | |

|
#12
Martens Ct
Goddard, KS 67052
|
- sq. feet
|
- baths - beds |
show details | |

|
#13
E 4th Ave Apt 1
Cheney, KS 67025
|
- sq. feet
|
- baths - beds |
show details | |

|
#14
W Maple St Lot D
Goddard, KS 67052
|
- sq. feet
|
- baths - beds |
show details | |

|
#15
W Main St
Mount Hope, KS 67108
|
- sq. feet
|
- baths - beds |
show details | |

|
#16
S 339th St W
Cheney, KS 67025
|
- sq. feet
|
- baths - beds |
show details | |

|
#17
E Casey Dr
Goddard, KS 67052
|
- sq. feet
|
- baths - beds |
show details | |

|
Check over 1 million property listings on Foreclosure.com!
|
browse all offers | |||

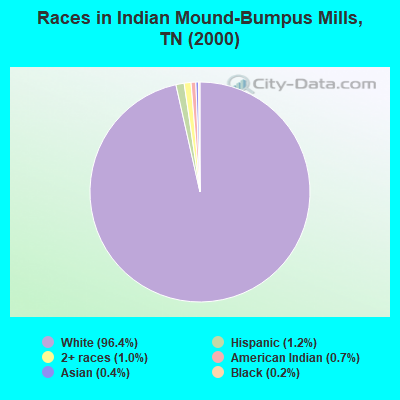
- 5,92596.4%White alone
- 721.2%Hispanic
- 611.0%Two or more races
- 430.7%American Indian alone
- 220.4%Asian alone
- 150.2%Black alone
- 60.10%Other race alone
- 10.02%Native Hawaiian and Other
Pacific Islander alone
 Recent articles from our blog. Our writers, many of them Ph.D. graduates or candidates, create easy-to-read articles on a wide variety of topics.

Current Local Time: CST time zone
Land area: 170.7 square miles.
Population density: 38 people per square mile (very low).
| Indian Mound-Bumpus Mills CCD: | 0.6% ($428) |
| Tennessee: | 0.8% ($715) |
Nearest city with pop. 50,000+: Clarksville, TN  (23.3 miles , pop. 103,455).
Nearest city with pop. 200,000+: Metropolitan Government, TN (61.9 miles , pop. 569,891).
Nearest city with pop. 1,000,000+: Chicago, IL (367.5 miles , pop. 2,896,016).
Nearest cities:
), Latitude: 36.53 N, Longitude: 87.78 W
Area code commonly used in this area: 931
| Here: | 3.2% |
| Tennessee: | 3.0% |
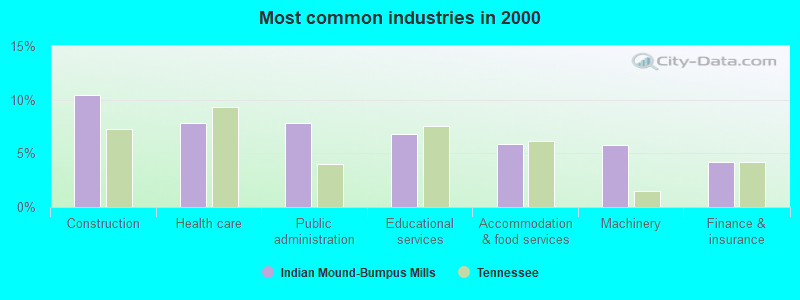
- Construction (10.4%)
- Health care (7.8%)
- Public administration (7.8%)
- Educational services (6.8%)
- Accommodation & food services (5.8%)
- Machinery (5.7%)
- Finance & insurance (4.2%)
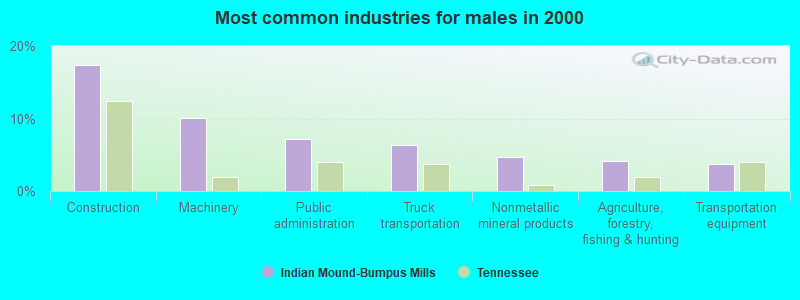
- Construction (17.4%)
- Machinery (10.1%)
- Public administration (7.2%)
- Truck transportation (6.4%)
- Nonmetallic mineral products (4.7%)
- Agriculture, forestry, fishing & hunting (4.1%)
- Transportation equipment (3.7%)
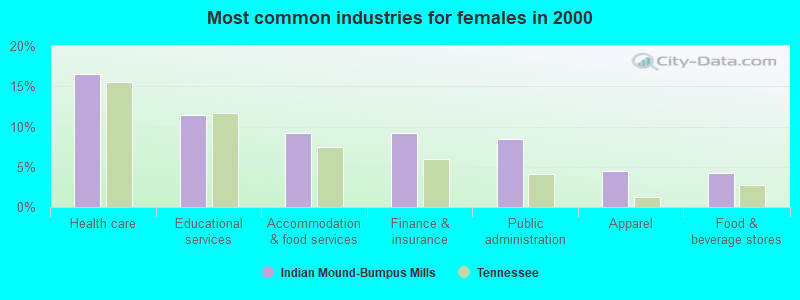
- Health care (16.6%)
- Educational services (11.4%)
- Accommodation & food services (9.2%)
- Finance & insurance (9.1%)
- Public administration (8.4%)
- Apparel (4.5%)
- Food & beverage stores (4.3%)
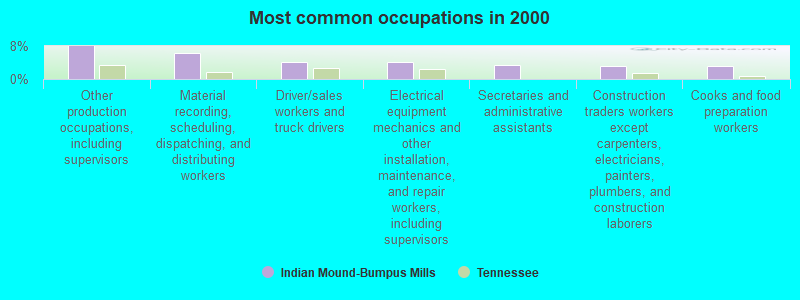
- Other production occupations, including supervisors (8.0%)
- Material recording, scheduling, dispatching, and distributing workers (6.4%)
- Driver/sales workers and truck drivers (4.0%)
- Electrical equipment mechanics and other installation, maintenance, and repair workers, including supervisors (4.0%)
- Secretaries and administrative assistants (3.4%)
- Construction traders workers except carpenters, electricians, painters, plumbers, and construction laborers (3.2%)
- Cooks and food preparation workers (3.2%)
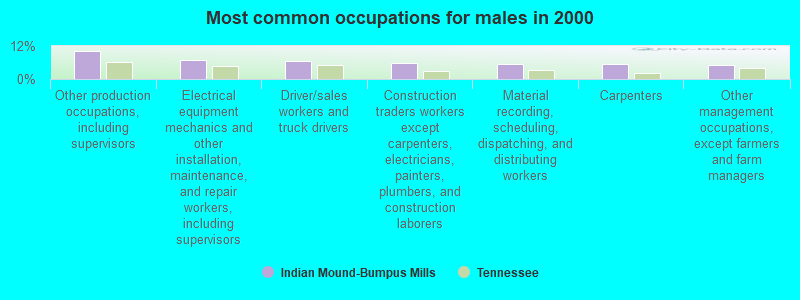
- Other production occupations, including supervisors (10.1%)
- Electrical equipment mechanics and other installation, maintenance, and repair workers, including supervisors (6.8%)
- Driver/sales workers and truck drivers (6.6%)
- Construction traders workers except carpenters, electricians, painters, plumbers, and construction laborers (5.9%)
- Material recording, scheduling, dispatching, and distributing workers (5.5%)
- Carpenters (5.5%)
- Other management occupations, except farmers and farm managers (4.9%)
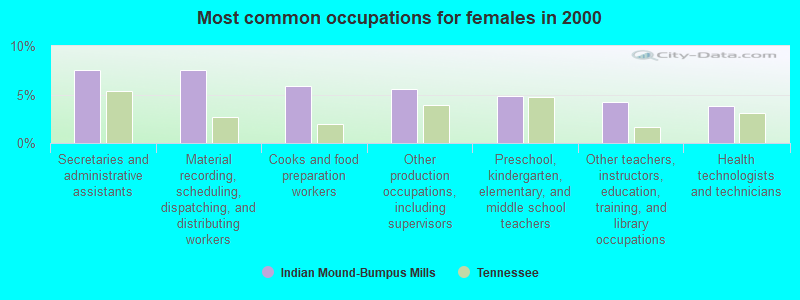
- Secretaries and administrative assistants (7.5%)
- Material recording, scheduling, dispatching, and distributing workers (7.5%)
- Cooks and food preparation workers (5.8%)
- Other production occupations, including supervisors (5.6%)
- Preschool, kindergarten, elementary, and middle school teachers (4.9%)
- Other teachers, instructors, education, training, and library occupations (4.3%)
- Health technologists and technicians (3.8%)
Average climate in Indian Mound-Bumpus Mills, Tennessee
Based on data reported by over 4,000 weather stations


(lower is better)
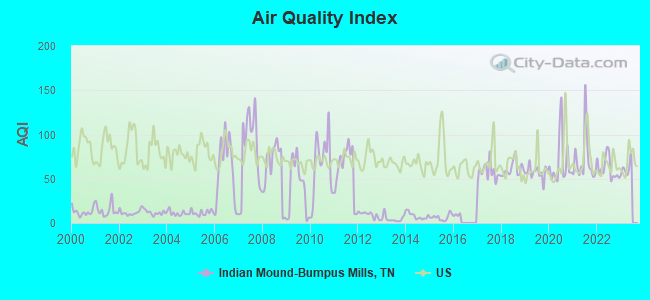
Air Quality Index (AQI) level in 2022 was 61.6. This is about average.
| City: | 61.6 |
| U.S.: | 72.6 |
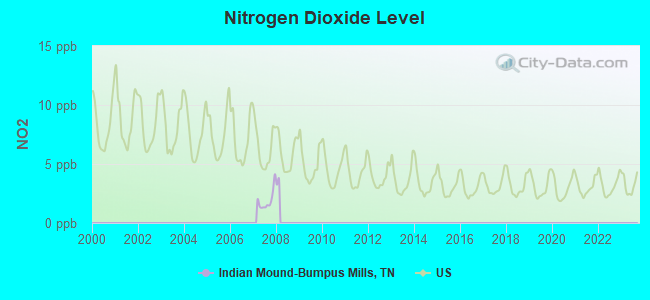
Nitrogen Dioxide (NO2) [ppb] level in 2007 was 1.91. This is significantly better than average. Closest monitor was 11.3 miles away from the city center.
| City: | 1.91 |
| U.S.: | 5.11 |
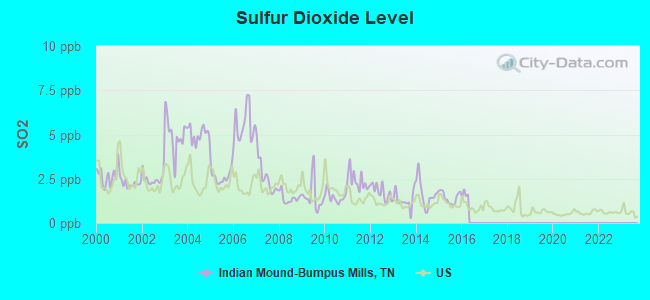
Sulfur Dioxide (SO2) [ppb] level in 2015 was 1.45. This is about average. Closest monitor was 2.7 miles away from the city center.
| City: | 1.45 |
| U.S.: | 1.51 |
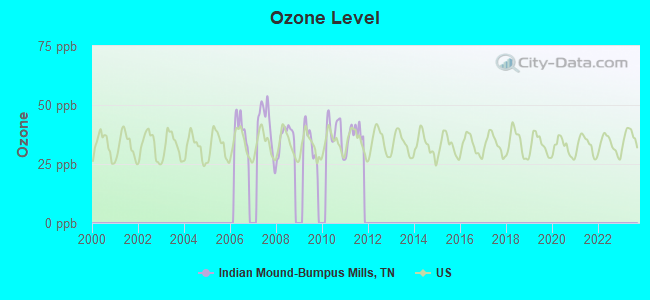
Ozone [ppb] level in 2011 was 37.2. This is about average. Closest monitor was 18.2 miles away from the city center.
| City: | 37.2 |
| U.S.: | 33.3 |
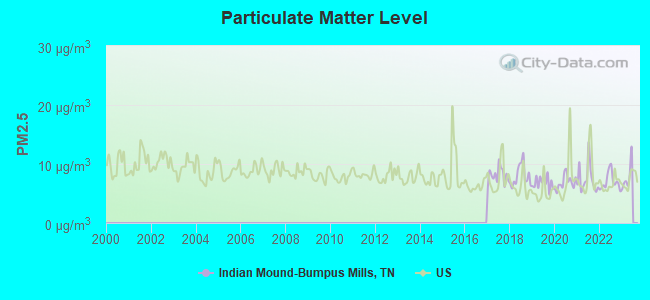
Particulate Matter (PM2.5) [µg/m3] level in 2022 was 7.02. This is about average. Closest monitor was 22.5 miles away from the city center.
| City: | 7.02 |
| U.S.: | 8.11 |
Tornado activity:
Indian Mound-Bumpus Mills-area historical tornado activity is slightly above Tennessee state average. It is 62% greater than the overall U.S. average.
On 4/3/1968, a category F4 (max. wind speeds 207-260 mph) tornado 30.0 miles away from the Indian Mound-Bumpus Mills place center killed 2 people and injured 30 people and caused between $500,000 and $5,000,000 in damages.
On 3/4/1964, a category F4 tornado 33.9 miles away from the place center killed 3 people and injured 24 people and caused between $50,000 and $500,000 in damages.
Earthquake activity:
Indian Mound-Bumpus Mills-area historical earthquake activity is significantly above Tennessee state average. It is 261% greater than the overall U.S. average.On 4/18/2008 at 09:36:59, a magnitude 5.4 (5.1 MB, 4.8 MS, 5.4 MW, 5.2 MW, Class: Moderate, Intensity: VI - VII) earthquake occurred 133.2 miles away from the city center
On 4/18/2008 at 09:36:59, a magnitude 5.2 (5.2 MW, Depth: 8.9 mi) earthquake occurred 133.2 miles away from the city center
On 6/18/2002 at 17:37:15, a magnitude 5.0 (4.3 MB, 4.6 MW, 5.0 LG) earthquake occurred 100.9 miles away from the city center
On 9/26/1990 at 13:18:51, a magnitude 5.0 (4.7 MB, 4.8 LG, 5.0 LG, Depth: 7.7 mi) earthquake occurred 106.9 miles away from the city center
On 5/4/1991 at 01:18:54, a magnitude 5.0 (4.4 MB, 4.6 LG, 5.0 LG, Depth: 3.1 mi) earthquake occurred 113.8 miles away from Indian Mound-Bumpus Mills center
On 6/10/1987 at 23:48:54, a magnitude 5.1 (4.9 MB, 4.4 MS, 4.6 MS, 5.1 LG) earthquake occurred 158.7 miles away from Indian Mound-Bumpus Mills center
Magnitude types: regional Lg-wave magnitude (LG), body-wave magnitude (MB), surface-wave magnitude (MS), moment magnitude (MW)
Natural disasters:
The number of natural disasters in Stewart County (14) is near the US average (15).Major Disasters (Presidential) Declared: 11
Emergencies Declared: 2
Causes of natural disasters: Floods: 10, Storms: 9, Tornadoes: 6, Winds: 3, Winter Storms: 2, Flash Flood: 1, Hurricane: 1, Ice Storm: 1, Other: 1 (Note: some incidents may be assigned to more than one category).
Hospitals and medical centers near Indian Mound-Bumpus Mills:
- MANOR HOUSE OF DOVER (Nursing Home, about 5 miles away; DOVER, TN)
- PATIENTS' CHOICE MEDICAL CENTER OF ERIN Critical Access Hospitals (about 16 miles away; ERIN, TN)
- (CLOSED) TRINITY HOSPITAL (Hospital, about 16 miles away; ERIN, TN)
- SIGNATURE HEALTHCARE OF ERIN (Nursing Home, about 16 miles away; ERIN, TN)
Colleges/universities with over 2000 students nearest to Indian Mound-Bumpus Mills:
- Austin Peay State University (about 24 miles; Clarksville, TN; Full-time enrollment: 8,621)
- Hopkinsville Community College (about 30 miles; Hopkinsville, KY; FT enrollment: 2,269)
- Murray State University (about 31 miles; Murray, KY; FT enrollment: 8,930)
- Bethel University (about 50 miles; McKenzie, TN; FT enrollment: 5,878)
- Nashville State Community College (about 58 miles; Nashville, TN; FT enrollment: 6,436)
- Tennessee State University (about 59 miles; Nashville, TN; FT enrollment: 7,341)
- Madisonville Community College (about 60 miles; Madisonville, KY; FT enrollment: 2,082)
Points of interest:
Notable locations in Indian Mound-Bumpus Mills: Moore Landing (A), Bear Springs Landing (B), Jackson Landing (C), Shingles Landing (D), Stewart County Volunteer Fire Service Station 10 Indian Mound (E), Stewart County Volunteer Fire Service Station 11 Loon Bay (F), Stewart County Volunteer Fire Service Station 2 Red Top (G), Stewart County Volunteer Fire Service Station 3 New Haven (H), Stewart County Volunteer Fire Service Station 5 Hopewell (I), Stewart County Volunteer Fire Service Station 7 Bumpus Mills (J), Stewart County Volunteer Fire Service Station 1 Big Rock (K). Display/hide their locations on the map
Churches in Indian Mound-Bumpus Mills include: Hopewell Church (A), Bethel Church (B), Lees Chapel (C), Church of the Nazarene (D), Cross Creek Church (E), Taylors Chapel (F), Wyatts Church (G), Pleasant Hill Church (H), Rose Valley Church (I). Display/hide their locations on the map
Cemeteries: Taylor Cemetery (1), Jackson Cemetery (2), Joiner Cemetery (3), Wallace Cemetery (4), Keatts Cemetery (5), Smith Cemetery (6), Haus Cemetery (7). Display/hide their locations on the map
Reservoirs: Pool Four (A), Lake Kyle (B), Pool Fourteen (C). Display/hide their locations on the map
Streams, rivers, and creeks: Lewis Branch (A), Lee Creek (B), Bellwood Branch (C), Hopewell Branch (D), Honey Fork Creek (E), Hayes Fork Creek (F), Wall Creek (G), Taylor Branch (H), Dicks Fork Creek (I). Display/hide their locations on the map
Parks in Indian Mound-Bumpus Mills include: Blue Creek Recreation Area (1), Commissary Hollow Access Point (2), Dryers Creek Recreational Area (3), Saline Creek Access Point (4), Bumpus Mills Recreation Area (5), Tobaccoport Public Use Area (6), Barkley Wildlife Management Area (7), River Bend Recreation Area (8), Saline Creek Public Use Area (9). Display/hide their locations on the map
| This place: | 2.6 people |
| Tennessee: | 2.5 people |
| This place: | 61.2% |
| Whole state: | 69.8% |
| This place: | 3.5% |
| Whole state: | 4.2% |
Likely homosexual households (counted as self-reported same-sex unmarried-partner households)
- Lesbian couples: 0.3% of all households
- Gay men: 0.2% of all households
| This place: | 10.7% |
| Whole state: | 13.5% |
| This place: | 3.3% |
| Whole state: | 5.8% |
For population 15 years and over in Indian Mound-Bumpus Mills:
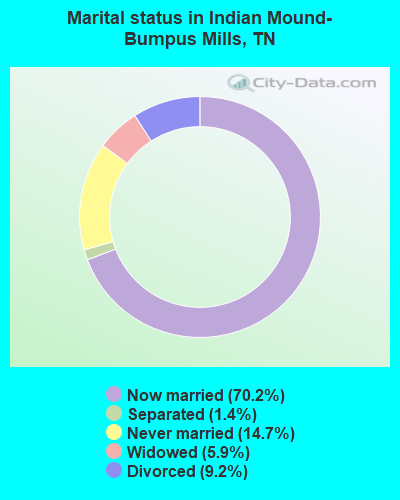
- Never married: 14.7%
- Now married: 70.2%
- Separated: 1.4%
- Widowed: 5.9%
- Divorced: 9.2%
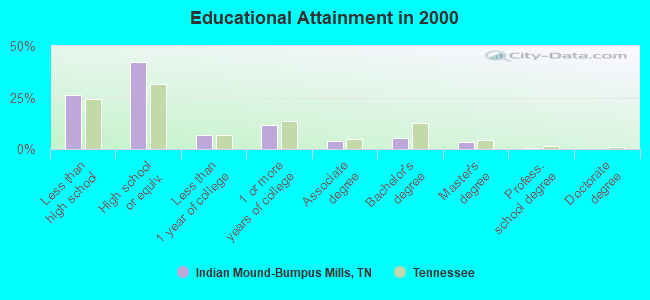
For population 25 years and over in Indian Mound-Bumpus Mills:
- High school or higher: 73.7%
- Bachelor's degree or higher: 9.0%
- Graduate or professional degree: 3.7%
- Unemployed: 8.2%
- Mean travel time to work (commute): 38.4 minutes
| Here: | 12.0 |
| Tennessee average: | 13.3 |
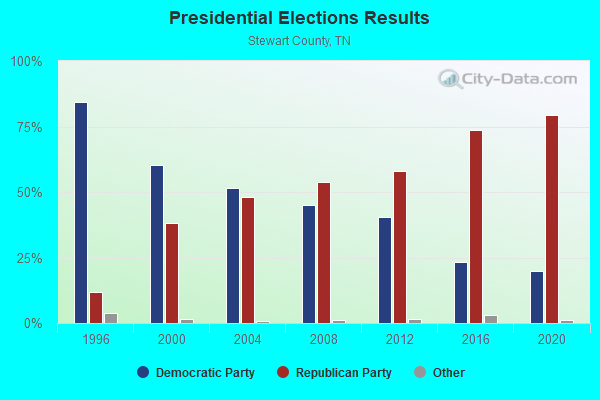
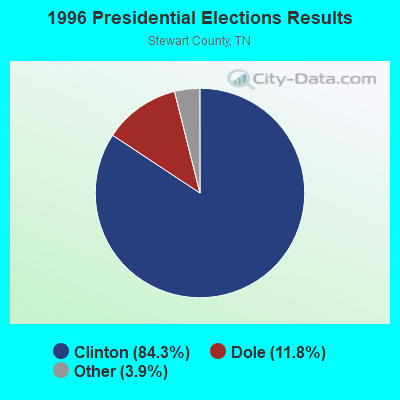
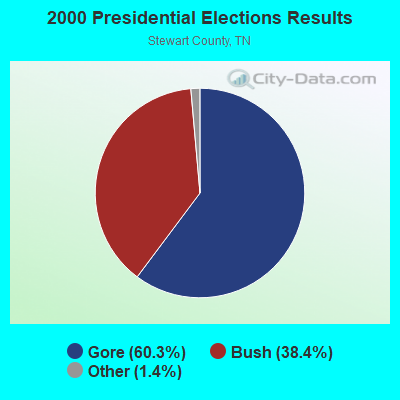
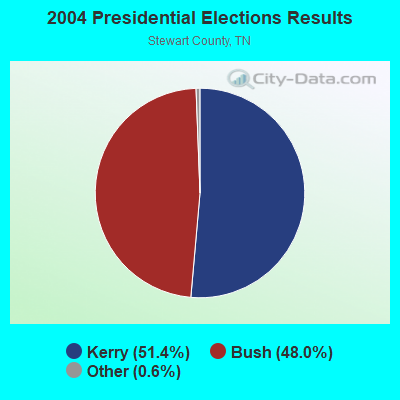
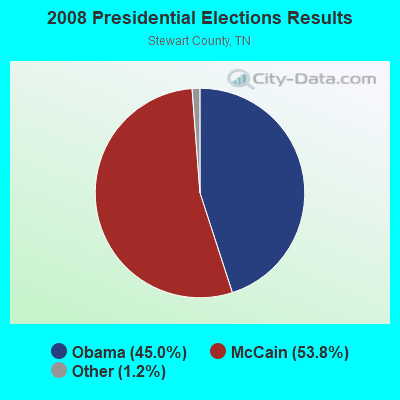
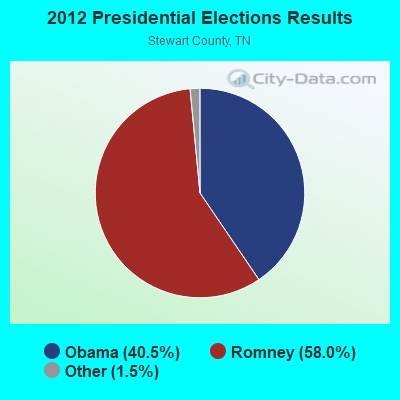
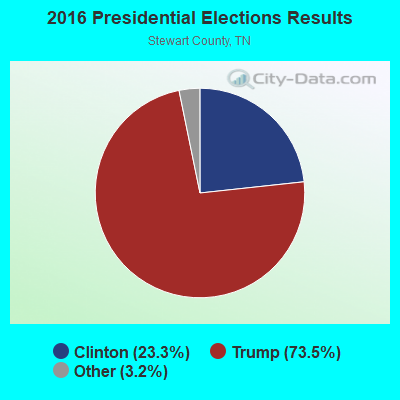
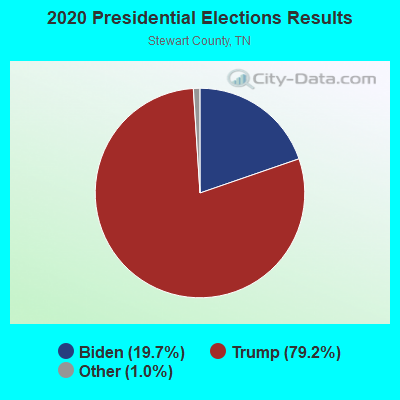
Graphs represent county-level data. Detailed 2008 Election Results
Religion statistics for Indian Mound-Bumpus Mills, TN (based on Stewart County data)
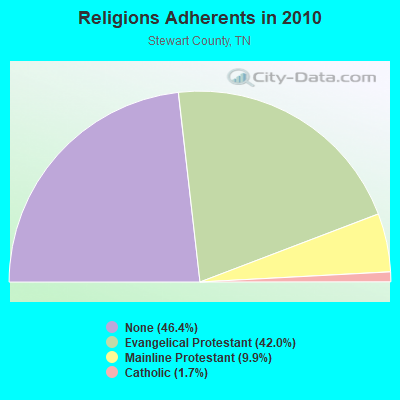
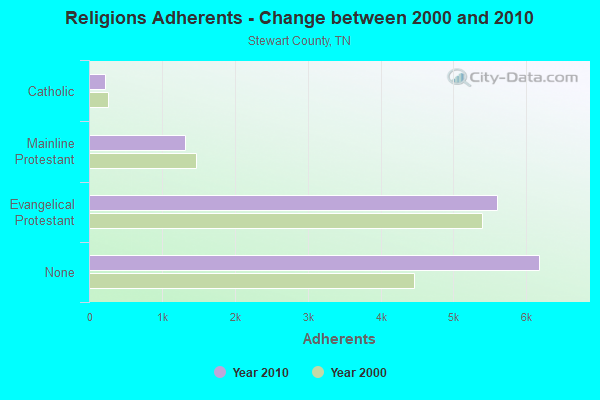
| Religion | Adherents | Congregations |
|---|---|---|
| Evangelical Protestant | 5,602 | 42 |
| Mainline Protestant | 1,321 | 14 |
| Catholic | 220 | 1 |
| Other | - | 1 |
| None | 6,181 | - |
Food Environment Statistics:
| Here: | 0.77 / 10,000 pop. |
| Tennessee: | 1.99 / 10,000 pop. |
| This county: | 0.77 / 10,000 pop. |
| Tennessee: | 0.65 / 10,000 pop. |
| Stewart County: | 5.37 / 10,000 pop. |
| State: | 5.16 / 10,000 pop. |
| Stewart County: | 6.14 / 10,000 pop. |
| State: | 6.56 / 10,000 pop. |
| This county: | 11.7% |
| State: | 11.4% |
| This county: | 31.3% |
| State: | 30.2% |
| Here: | 10.4% |
| Tennessee: | 13.5% |
Strongest AM radio stations in Indian Mound-Bumpus Mills:
- WSM (650 AM; 50 kW; NASHVILLE, TN; Owner: GAYLORD ENTERTAINMENT COMPANY)
- WKDA (1200 AM; 50 kW; NASHVILLE, TN; Owner: RADIO NASHVILLE, INC.)
- WNQM (1300 AM; 50 kW; NASHVILLE, TN; Owner: WNQM. INC.)
- WAMB (1160 AM; 50 kW; DONELSON, TN; Owner: GREAT SOUTHERN BROADCASTING COMPANY, INC.)
- WLAC (1510 AM; 50 kW; NASHVILLE, TN; Owner: CAPSTAR TX LIMITED PARTNERSHIP)
- WMUF (1000 AM; daytime; 5 kW; PARIS, TN; Owner: BENTON-WEATHERFORD B/CTING OF TN,INC)
- WCTZ (1550 AM; 2 kW; CLARKSVILLE, TN; Owner: WINSTON COMMUNICATIONS, INC.)
- WDKN (1260 AM; 5 kW; DICKSON, TN; Owner: EDMISSON & EUBANK COMMUNICATIONS, INC.)
- WCRV (640 AM; 50 kW; COLLIERVILLE, TN; Owner: BOTT BROADCASTING COMPANY/TENNESSEE)
- WPLN (1430 AM; 15 kW; MADISON, TN)
- WJQI (540 AM; 1 kW; CLARKSVILLE, TN; Owner: SAGA COMMUNICATIONS OF TUCKESSEE, LLC)
- WCBL (1290 AM; 5 kW; BENTON, KY; Owner: JIM W. FREELAND)
- WWAM (820 AM; daytime; 50 kW; JASPER, TN; Owner: SHELTON BROADCASTING SYSTEM)
Strongest FM radio stations in Indian Mound-Bumpus Mills:
- WCVQ (107.9 FM; FORT CAMPBELL, KY; Owner: SAGA COMMUNICATIONS OF TUCKESSEE, LLC)
- WVVR (100.3 FM; HOPKINSVILLE, KY; Owner: SAGA COMMUNICATIONS OF TUCKESSEE, LLC)
- WTPR-FM (101.5 FM; MCKINNON, TN; Owner: WENK BROADCAST GROUP)
- WKDZ-FM (106.5 FM; CADIZ, KY; Owner: HAM BROADCASTING COMPANY, INC.)
- WQZQ-FM (102.5 FM; DICKSON, TN; Owner: MONTGOMERY BROADCASTING COMPANY)
- WFGE (103.7 FM; MURRAY, KY; Owner: FOREVER COMMUNICATIONS INC)
- WKMS-FM (91.3 FM; MURRAY, KY; Owner: MURRAY STATE UNIVERSITY)
- WVRY (105.1 FM; WAVERLY, TN; Owner: REACH SATELLITE NETWORK, INC.)
- WZZP (97.5 FM; HOPKINSVILLE, KY; Owner: SAGA COMMUNICATIONS OF TUCKESSEE, LLC)
TV broadcast stations around Indian Mound-Bumpus Mills:
- WCKV-LP (Channel 49; CLARKSVILLE, ETC., TN; Owner: TN MEDIA GROUP, INC.)
- WQTV-LP (Channel 24; MURRAY, KY; Owner: RAYCOM AMERICA, INC.)
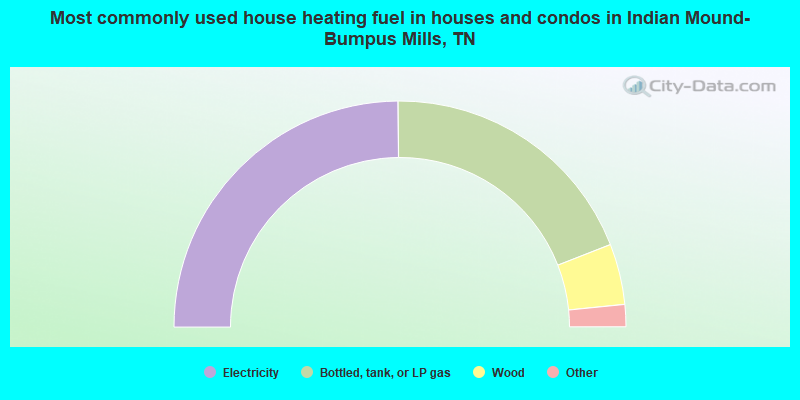
- 49.8%Electricity
- 38.4%Bottled, tank, or LP gas
- 8.7%Wood
- 1.3%Fuel oil, kerosene, etc.
- 1.0%Utility gas
- 0.9%No fuel used
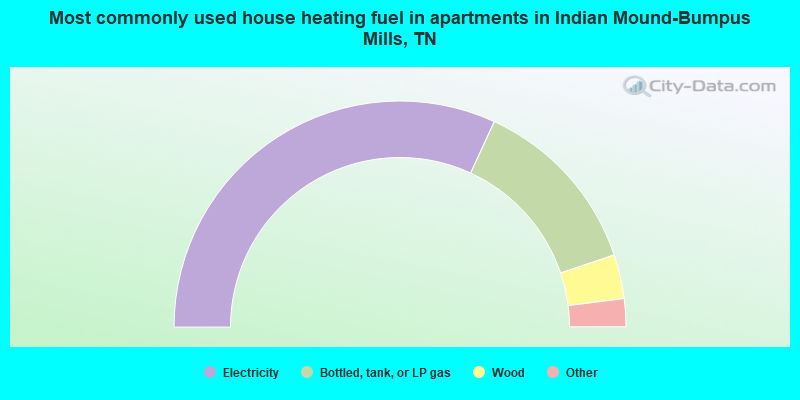
- 63.7%Electricity
- 26.0%Bottled, tank, or LP gas
- 6.3%Wood
- 2.7%Utility gas
- 1.3%No fuel used
Indian Mound-Bumpus Mills compared to Tennessee state average:
- Black race population percentage significantly below state average.
- Hispanic race population percentage significantly below state average.
- Foreign-born population percentage significantly below state average.
- Renting percentage significantly below state average.
- Length of stay since moving in significantly above state average.
- Number of rooms per house significantly below state average.
- House age significantly below state average.
- Number of college students below state average.
- Percentage of population with a bachelor's degree or higher significantly below state average.
Indian Mound-Bumpus Mills on our top lists:
- #3 on the list of "Top 101 cities with largest percentage of females in occupations: material recording, scheduling, dispatching, and distributing workers (population 5,000+)"
- #4 on the list of "Top 101 cities with largest percentage of females in industries: u. s. postal service (population 5,000+)"
- #5 on the list of "Top 101 cities with largest percentage of males in industries: nonmetallic mineral products (population 5,000+)"
- #9 on the list of "Top 101 cities with largest percentage of males in industries: water transportation (population 5,000+)"
- #13 on the list of "Top 101 cities with largest percentage of females in occupations: other financial specialists (population 5,000+)"
- #15 on the list of "Top 101 cities with largest percentage of males in industries: machinery (population 5,000+)"
- #17 on the list of "Top 101 cities with largest percentage of females in industries: hardware, plumbing and heating equipment, and supplies merchant wholesalers (population 5,000+)"
- #19 on the list of "Top 101 cities with largest percentage of females in industries: apparel (population 5,000+)"
- #19 on the list of "Top 101 cities with largest percentage of males in occupations: rail and water transportation workers (population 5,000+)"
- #22 on the list of "Top 101 cities with largest percentage of females in industries: printing and related support activities (population 5,000+)"
- #23 on the list of "Top 101 cities with largest percentage of males in industries: metals and minerals, except petroleum, merchant wholesalers (population 5,000+)"
- #24 on the list of "Top 101 cities with largest percentage of females in occupations: cooks and food preparation workers (population 5,000+)"
- #25 on the list of "Top 101 cities with largest percentage of females in industries: plastics and rubber products (population 5,000+)"
- #27 on the list of "Top 101 cities with largest percentage of males in industries: truck transportation (population 5,000+)"
- #28 on the list of "Top 101 cities with largest percentage of males in industries: building material and garden equipment and supplies dealers (population 5,000+)"
- #31 on the list of "Top 101 cities with largest percentage of females in industries: health and personal care, except drug, stores (population 5,000+)"
- #32 on the list of "Top 101 cities with largest percentage of males in industries: furniture and related product manufacturing (population 5,000+)"
- #37 on the list of "Top 101 cities with largest percentage of males in industries: apparel (population 5,000+)"
- #38 on the list of "Top 101 cities with largest percentage of males in industries: hardware, plumbing and heating equipment, and supplies merchant wholesalers (population 5,000+)"
- #42 on the list of "Top 101 cities with largest percentage of males in occupations: carpenters (population 5,000+)"
- #1 on the list of "Top 101 counties with the lowest percentage of residents that drank alcohol in the past 30 days"
- #1 on the list of "Top 101 counties with the highest percentage of residents that keep firearms around their homes"
- #6 on the list of "Top 101 counties with the worst general health status score of residents (1-5), 3 years of data"
- #12 on the list of "Top 101 counties with the lowest percentage of residents that visited a dentist within the past year"
- #21 on the list of "Top 101 counties with the lowest percentage of residents that exercised in the past month"