Imperial, California
Submit your own pictures of this city and show them to the world
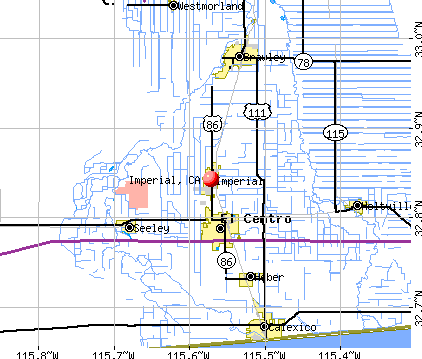
- OSM Map
- General Map
- Google Map
- MSN Map
Population change since 2000: +180.9%
| Males: 10,203 | |
| Females: 11,030 |
| Median resident age: | 31.0 years |
| California median age: | 37.9 years |
Zip codes: 92251.
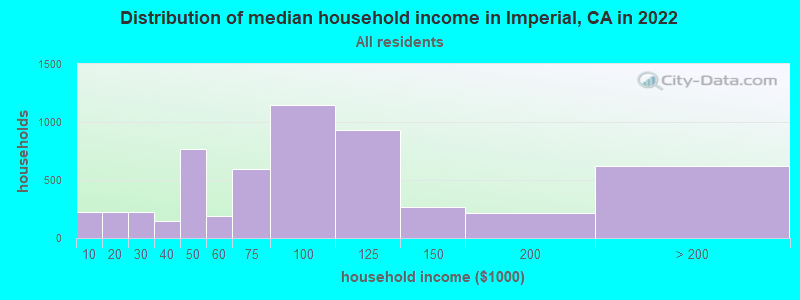
| Imperial: | $88,369 |
| CA: | $91,551 |
Estimated per capita income in 2022: $27,992 (it was $16,538 in 2000)
Imperial city income, earnings, and wages data
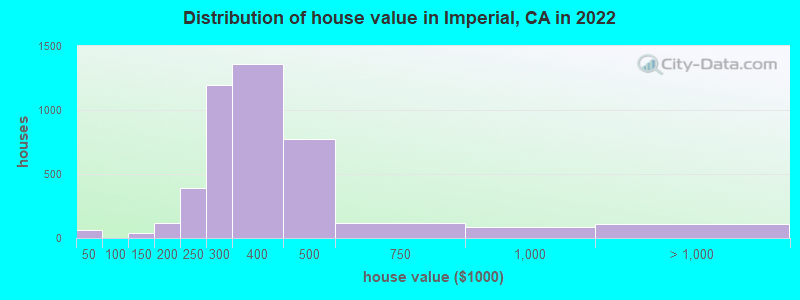
Estimated median house or condo value in 2022: $341,074 (it was $100,500 in 2000)
| Imperial: | $341,074 |
| CA: | $715,900 |
Mean prices in 2022: all housing units: $267,501; detached houses: $287,824; townhouses or other attached units: $339,294; in 2-unit structures: $153,064; in 3-to-4-unit structures: $163,407; in 5-or-more-unit structures: $239,638; mobile homes: $72,491; occupied boats, rvs, vans, etc.: $99,236
Median gross rent in 2022: $1,290.
(4.8% for White Non-Hispanic residents, 12.9% for Hispanic or Latino residents, 12.9% for other race residents, 5.6% for two or more races residents)
Detailed information about poverty and poor residents in Imperial, CA

Compare current foreclosures near Imperial, CA:
| Photo | Address | Area | Beds / Baths | Price | Details |
|---|---|---|---|---|---|

|
#1
E 5th St
Imperial, CA 92251
|
- sq. feet
|
2 baths 3 beds |
show details | |

|
#2
E 2nd St
Imperial, CA 92251
|
- sq. feet
|
2 baths 3 beds |
show details | |

|
#3
Dulles Dr
Imperial, CA 92251
|
- sq. feet
|
- baths - beds |
show details | |

|
#4
Garnet St
Imperial, CA 92251
|
- sq. feet
|
- baths - beds |
show details | |

|
#5
W Santa Rosalia Dr
Imperial, CA 92251
|
- sq. feet
|
- baths - beds |
show details | |

|
#6
Sylvia Ct
Imperial, CA 92251
|
- sq. feet
|
- baths - beds |
show details | |

|
#7
La Paz Dr
Imperial, CA 92251
|
- sq. feet
|
- baths - beds |
show details | |

|
#8
Shoshonean Dr
Imperial, CA 92251
|
- sq. feet
|
- baths - beds |
show details | |

|
#9
Saddleback Dr
Imperial, CA 92251
|
- sq. feet
|
- baths - beds |
show details | |

|
#10
W Nuevo Vallarta Dr
Imperial, CA 92251
|
- sq. feet
|
- baths - beds |
show details |
| Photo | Address | Area | Beds / Baths | Price | Details |
|---|---|---|---|---|---|

|
#11
W Barioni Blvd # 215
Imperial, CA 92251
|
- sq. feet
|
- baths - beds |
show details | |

|
#12
La Guardia Ct
Imperial, CA 92251
|
- sq. feet
|
- baths - beds |
show details | |

|
#13
Cinnabar St
Imperial, CA 92251
|
- sq. feet
|
- baths - beds |
show details | |

|
#14
Tamarisk St
Imperial, CA 92251
|
- sq. feet
|
- baths - beds |
show details | |

|
#15
N G St # 102
Imperial, CA 92251
|
- sq. feet
|
- baths - beds |
show details | |

|
#16
Mesquite St
Imperial, CA 92251
|
- sq. feet
|
- baths - beds |
show details | |

|
#17
Ocotillo Dr
El Centro, CA 92243
|
1,284 sq. feet
|
2 baths 3 beds |
show details | |

|
#18
E Ross Rd
El Centro, CA 92243
|
1,392 sq. feet
|
2 baths 2 beds |
show details | |

|
#19
F Herrera St
Calexico, CA 92231
|
2,021 sq. feet
|
2 baths 5 beds |
show details | |

|
#20
Pepper Dr
El Centro, CA 92243
|
1,148 sq. feet
|
2 baths 4 beds |
show details |
| Photo | Address | Area | Beds / Baths | Price | Details |
|---|---|---|---|---|---|

|
#21
S 6th St
El Centro, CA 92243
|
1,295 sq. feet
|
2 baths 3 beds |
show details | |

|
#22
Chavez Avenue
Calexico, CA 92231
|
- sq. feet
|
1 baths 2 beds |
show details | |

|
#23
Blooming Canyon Way
Brawley, CA 92227
|
1,563 sq. feet
|
- baths - beds |
show details | |

|
#24
Grant St
Calexico, CA 92231
|
- sq. feet
|
2 baths 3 beds |
show details | |

|
#25
N 18th St
El Centro, CA 92243
|
- sq. feet
|
2 baths 4 beds |
show details | |

|
#26
S Imperial Ave
Brawley, CA 92227
|
- sq. feet
|
2 baths 3 beds |
show details | |

|
#27
Rose Ave
El Centro, CA 92243
|
- sq. feet
|
1 baths 3 beds |
show details | |

|
#28
Vega St
Calexico, CA 92231
|
- sq. feet
|
2 baths 3 beds |
show details | |

|
#29
N Imperial Ave Apt 23a
El Centro, CA 92243
|
- sq. feet
|
- baths - beds |
show details | |

|
#30
W D St Apt A
Brawley, CA 92227
|
- sq. feet
|
- baths - beds |
show details |
| Photo | Address | Area | Beds / Baths | Price | Details |
|---|---|---|---|---|---|

|
#31
Drew Rd Spc 18
El Centro, CA 92243
|
- sq. feet
|
- baths - beds |
show details | |

|
#32
N Imperial Ave Apt 8
Brawley, CA 92227
|
- sq. feet
|
- baths - beds |
show details | |

|
#33
Flammang Ave
Brawley, CA 92227
|
- sq. feet
|
- baths - beds |
show details | |

|
#34
Vernardo Dr Spc 145
Calexico, CA 92231
|
- sq. feet
|
- baths - beds |
show details | |

|
#35
E Thiesen Rd
Holtville, CA 92250
|
- sq. feet
|
- baths - beds |
show details | |

|
#36
Virginia Way
Calexico, CA 92231
|
- sq. feet
|
- baths - beds |
show details | |

|
#37
Barbara Worth Dr
Holtville, CA 92250
|
- sq. feet
|
- baths 3 beds |
show details | |

|
#38
E Danenberg Dr # 1028
El Centro, CA 92243
|
- sq. feet
|
- baths - beds |
show details | |

|
#39
Herrera Street
Calexico, CA 92231
|
- sq. feet
|
- baths - beds |
show details | |

|
#40
E Evan Hewes Hwy Spc 13
El Centro, CA 92243
|
- sq. feet
|
- baths - beds |
show details |
| Photo | Address | Area | Beds / Baths | Price | Details |
|---|---|---|---|---|---|

|
#41
El Centro Ave Apt A
El Centro, CA 92243
|
- sq. feet
|
- baths - beds |
show details | |

|
#42
N 10th St, Apt 7
El Centro, CA 92243
|
- sq. feet
|
- baths - beds |
show details | |

|
#43
N 8th St, Apt 123
El Centro, CA 92243
|
- sq. feet
|
- baths - beds |
show details | |

|
#44
Andrade Ave
Calexico, CA 92231
|
- sq. feet
|
- baths - beds |
show details | |

|
#45
E 4th St, Apt E
Calexico, CA 92231
|
- sq. feet
|
- baths - beds |
show details | |

|
#46
S 9th St
El Centro, CA 92243
|
- sq. feet
|
- baths - beds |
show details | |

|
#47
W Pico Ave
El Centro, CA 92243
|
- sq. feet
|
- baths - beds |
show details | |

|
#48
Cottonwood Cir Apt 37
El Centro, CA 92243
|
- sq. feet
|
- baths - beds |
show details | |

|
#49
E 7th St
Calexico, CA 92231
|
- sq. feet
|
- baths - beds |
show details | |

|
Check over 1 million property listings on Foreclosure.com!
|
browse all offers | |||


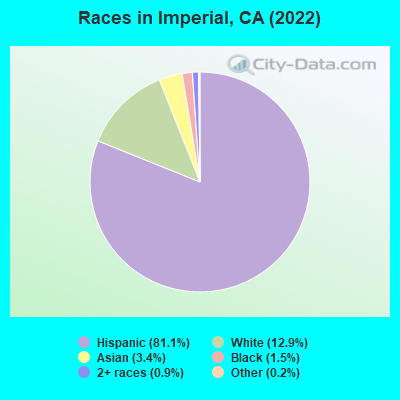
- 16,49581.1%Hispanic
- 2,61612.9%White alone
- 6833.4%Asian alone
- 3021.5%Black alone
- 1830.9%Two or more races
- 470.2%Other race alone
According to our research of California and other state lists, there were 22 registered sex offenders living in Imperial, California as of May 09, 2024.
The ratio of all residents to sex offenders in Imperial is 763 to 1.
The ratio of registered sex offenders to all residents in this city is near the state average.
Type |
2009 |
2010 |
2011 |
2012 |
2013 |
2014 |
2015 |
2016 |
2017 |
2018 |
2019 |
2020 |
2022 |
|---|---|---|---|---|---|---|---|---|---|---|---|---|---|
| Murders (per 100,000) | 0 (0.0) | 0 (0.0) | 0 (0.0) | 0 (0.0) | 0 (0.0) | 0 (0.0) | 0 (0.0) | 0 (0.0) | 1 (5.7) | 0 (0.0) | 0 (0.0) | 0 (0.0) | 0 (0.0) |
| Rapes (per 100,000) | 0 (0.0) | 0 (0.0) | 0 (0.0) | 0 (0.0) | 0 (0.0) | 0 (0.0) | 1 (5.8) | 0 (0.0) | 0 (0.0) | 2 (11.1) | 0 (0.0) | 0 (0.0) | 1 (4.6) |
| Robberies (per 100,000) | 5 (34.3) | 2 (13.6) | 0 (0.0) | 2 (13.2) | 1 (6.3) | 1 (6.0) | 0 (0.0) | 1 (5.7) | 2 (11.3) | 1 (5.6) | 1 (5.5) | 2 (10.8) | 0 (0.0) |
| Assaults (per 100,000) | 6 (41.2) | 3 (20.3) | 8 (53.6) | 5 (33.1) | 6 (37.6) | 4 (24.2) | 4 (23.1) | 6 (34.1) | 8 (45.4) | 6 (33.4) | 4 (22.1) | 7 (37.8) | 19 (87.9) |
| Burglaries (per 100,000) | 12 (82.4) | 21 (142.3) | 22 (147.3) | 17 (112.4) | 18 (112.9) | 6 (36.3) | 2 (11.5) | 7 (39.8) | 14 (79.4) | 18 (100.1) | 10 (55.3) | 14 (75.6) | 13 (60.1) |
| Thefts (per 100,000) | 50 (343.3) | 44 (298.1) | 48 (321.5) | 50 (330.6) | 53 (332.4) | 27 (163.3) | 47 (271.1) | 60 (341.3) | 36 (204.2) | 38 (211.4) | 36 (199.0) | 29 (156.5) | 50 (231.2) |
| Auto thefts (per 100,000) | 19 (130.4) | 19 (128.7) | 18 (120.6) | 6 (39.7) | 15 (94.1) | 13 (78.6) | 5 (28.8) | 6 (34.1) | 11 (62.4) | 21 (116.8) | 10 (55.3) | 12 (64.8) | 15 (69.4) |
| Arson (per 100,000) | 1 (6.9) | 0 (0.0) | 0 (0.0) | 0 (0.0) | 0 (0.0) | 0 (0.0) | 0 (0.0) | 0 (0.0) | 1 (5.7) | 0 (0.0) | 0 (0.0) | 0 (0.0) | 4 (18.5) |
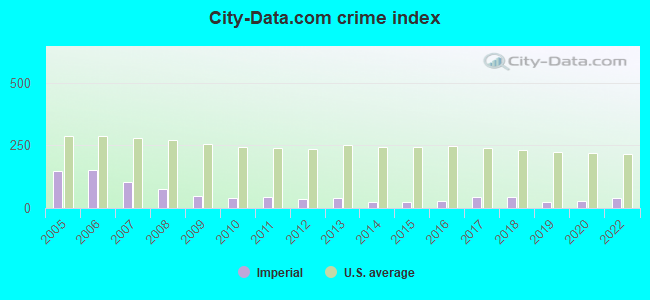
| City-Data.com crime index | 48.5 | 40.3 | 43.5 | 34.8 | 38.1 | 22.0 | 23.2 | 27.7 | 42.5 | 42.1 | 22.3 | 27.5 | 40.3 |
The City-Data.com crime index weighs serious crimes and violent crimes more heavily. Higher means more crime, U.S. average is 246.1. It adjusts for the number of visitors and daily workers commuting into cities.
Crime rate in Imperial detailed stats: murders, rapes, robberies, assaults, burglaries, thefts, arson
Full-time law enforcement employees in 2021, including police officers: 22 (19 officers - 15 male; 4 female).
| Officers per 1,000 residents here: | 0.94 |
| California average: | 2.30 |
 Recent articles from our blog. Our writers, many of them Ph.D. graduates or candidates, create easy-to-read articles on a wide variety of topics.


 | Imperial Beach issues or not? (9 replies) |
| Imperial Beach grandmother punched in road rage attack (1 reply) |
| What is Imperial like? (18 replies) |
| El Centro California / Nice place to live ? (38 replies) |
| COVID-19 Thread San Diego (2226 replies) |
| Is there anywhere in OC within a 'commutable' distance to LA? (52 replies) |
Latest news from Imperial, CA collected exclusively by city-data.com from local newspapers, TV, and radio stations
Ancestries: American (4.4%).
Current Local Time: PST time zone
Elevation: -60 feet
Land area: 3.91 square miles.
Population density: 5,427 people per square mile (average).
5,245 residents are foreign born (22.6% Latin America).
| This city: | 25.8% |
| California: | 26.5% |
Median real estate property taxes paid for housing units with mortgages in 2022: $3,273 (1.0%)
Median real estate property taxes paid for housing units with no mortgage in 2022: $2,372 (0.6%)
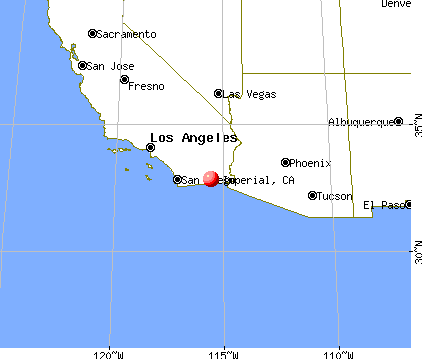
Nearest city with pop. 50,000+: Yuma, AZ  (56.6 miles , pop. 77,515).
Nearest city with pop. 200,000+: San Diego, CA (91.6 miles , pop. 1,223,400).
Nearest cities:
), ), ), Latitude: 32.84 N, Longitude: 115.57 W
Daytime population change due to commuting: -3,389 (-16.7%)
Workers who live and work in this city: 1,442 (18.8%)
Area code: 760

Imperial, California accommodation & food services, waste management - Economy and Business Data
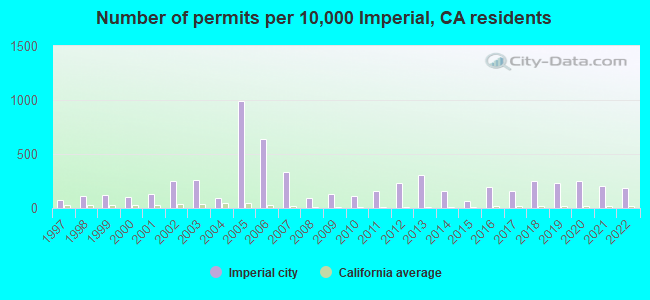
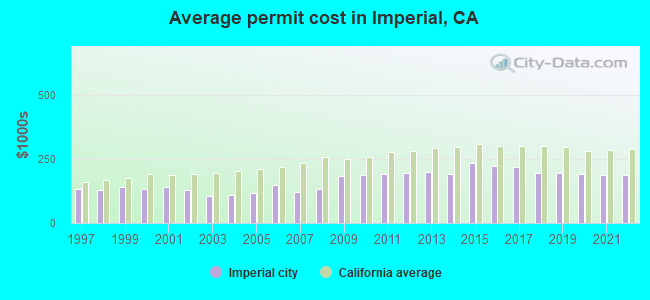
Single-family new house construction building permits:
- 2022: 139 buildings, average cost: $189,400
- 2021: 154 buildings, average cost: $188,700
- 2020: 189 buildings, average cost: $190,500
- 2019: 178 buildings, average cost: $194,500
- 2018: 186 buildings, average cost: $194,900
- 2017: 117 buildings, average cost: $217,700
- 2016: 148 buildings, average cost: $222,000
- 2015: 51 buildings, average cost: $233,000
- 2014: 116 buildings, average cost: $190,800
- 2013: 234 buildings, average cost: $198,100
- 2012: 173 buildings, average cost: $197,400
- 2011: 117 buildings, average cost: $190,700
- 2010: 84 buildings, average cost: $187,100
- 2009: 98 buildings, average cost: $184,700
- 2008: 72 buildings, average cost: $134,400
- 2007: 253 buildings, average cost: $123,200
- 2006: 485 buildings, average cost: $146,900
- 2005: 752 buildings, average cost: $117,700
- 2004: 68 buildings, average cost: $110,600
- 2003: 196 buildings, average cost: $107,200
- 2002: 192 buildings, average cost: $130,600
- 2001: 98 buildings, average cost: $141,800
- 2000: 79 buildings, average cost: $133,400
- 1999: 90 buildings, average cost: $140,000
- 1998: 81 buildings, average cost: $130,100
- 1997: 54 buildings, average cost: $132,600
| Here: | 18.3% |
| California: | 5.1% |
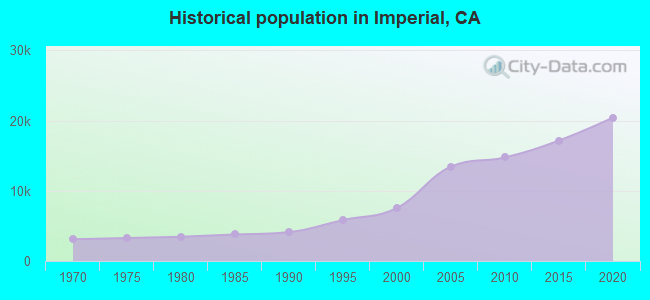
Population change in the 1990s: +3,272 (+76.3%).
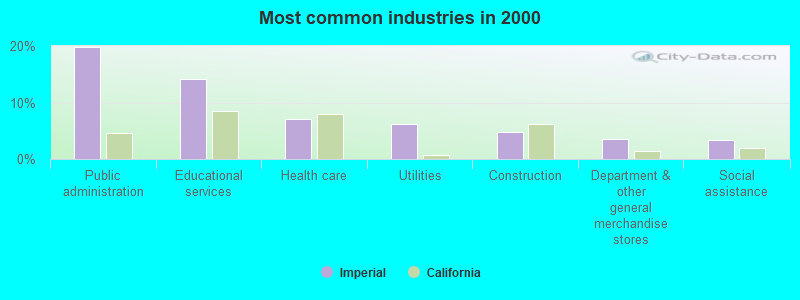
- Public administration (19.8%)
- Educational services (14.2%)
- Health care (7.0%)
- Utilities (6.1%)
- Construction (4.8%)
- Department & other general merchandise stores (3.6%)
- Social assistance (3.4%)
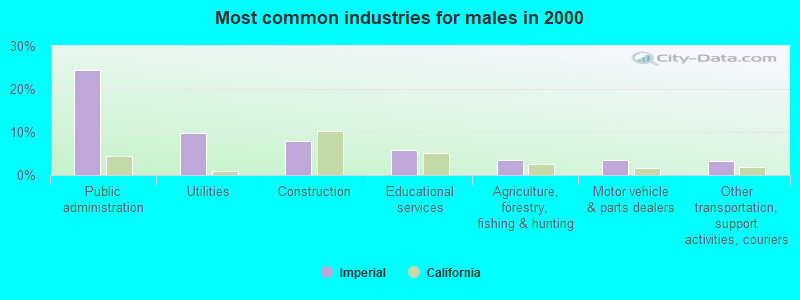
- Public administration (24.5%)
- Utilities (9.8%)
- Construction (8.0%)
- Educational services (5.7%)
- Agriculture, forestry, fishing & hunting (3.6%)
- Motor vehicle & parts dealers (3.4%)
- Other transportation, support activities, couriers (3.2%)
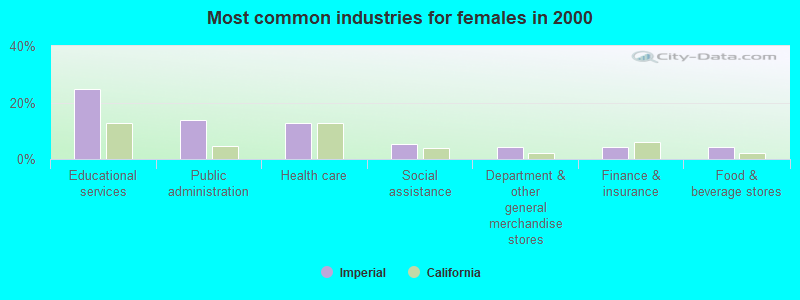
- Educational services (24.6%)
- Public administration (13.9%)
- Health care (12.7%)
- Social assistance (5.4%)
- Department & other general merchandise stores (4.4%)
- Finance & insurance (4.4%)
- Food & beverage stores (4.1%)
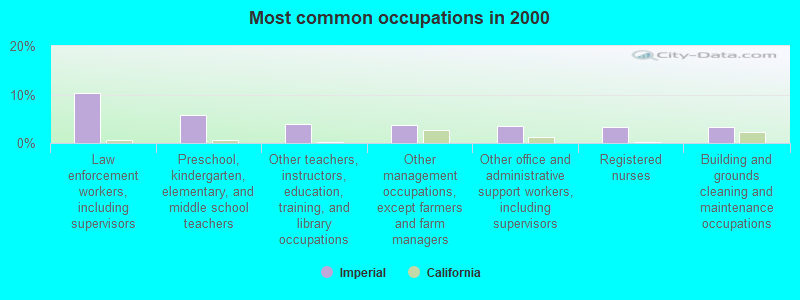
- Law enforcement workers, including supervisors (10.2%)
- Preschool, kindergarten, elementary, and middle school teachers (5.7%)
- Other teachers, instructors, education, training, and library occupations (4.0%)
- Other management occupations, except farmers and farm managers (3.7%)
- Other office and administrative support workers, including supervisors (3.4%)
- Registered nurses (3.3%)
- Building and grounds cleaning and maintenance occupations (3.3%)
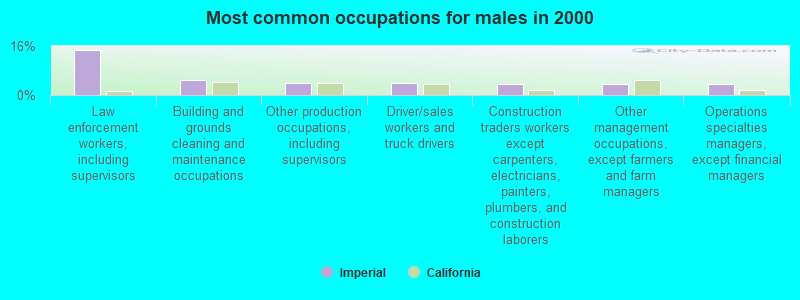
- Law enforcement workers, including supervisors (14.6%)
- Building and grounds cleaning and maintenance occupations (5.0%)
- Other production occupations, including supervisors (4.0%)
- Driver/sales workers and truck drivers (4.0%)
- Construction traders workers except carpenters, electricians, painters, plumbers, and construction laborers (3.7%)
- Other management occupations, except farmers and farm managers (3.6%)
- Operations specialties managers, except financial managers (3.4%)
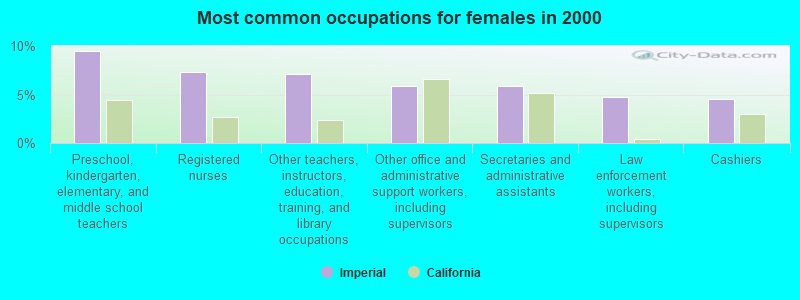
- Preschool, kindergarten, elementary, and middle school teachers (9.4%)
- Registered nurses (7.3%)
- Other teachers, instructors, education, training, and library occupations (7.1%)
- Other office and administrative support workers, including supervisors (5.9%)
- Secretaries and administrative assistants (5.9%)
- Law enforcement workers, including supervisors (4.8%)
- Cashiers (4.6%)
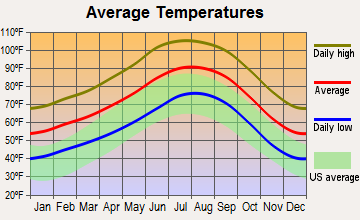
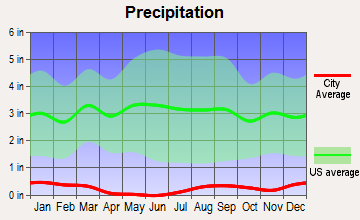
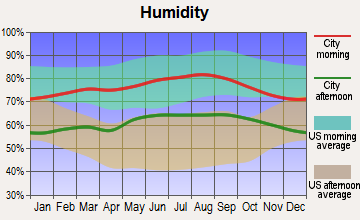
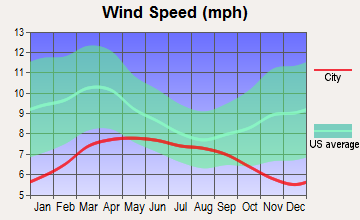
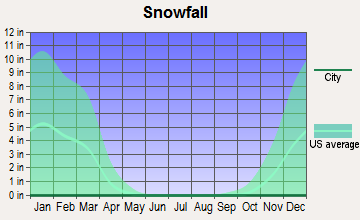
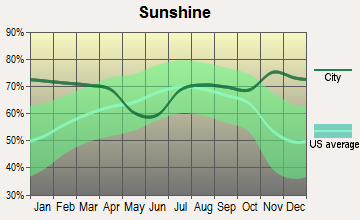
Average climate in Imperial, California
Based on data reported by over 4,000 weather stations
|
|

(lower is better)
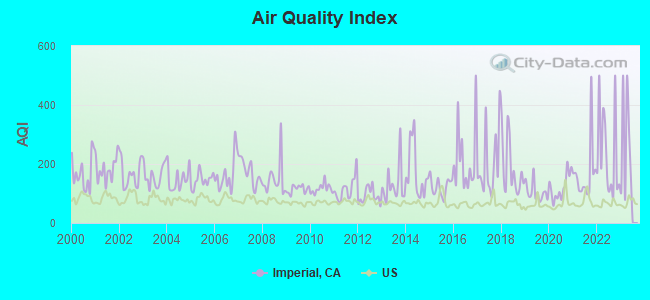
Air Quality Index (AQI) level in 2022 was 233. This is significantly worse than average.
| City: | 233 |
| U.S.: | 73 |
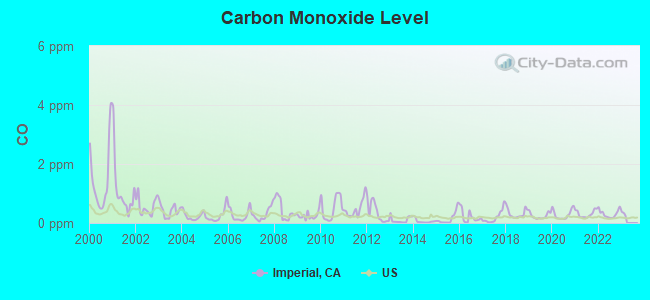
Carbon Monoxide (CO) [ppm] level in 2022 was 0.310. This is worse than average. Closest monitor was 3.5 miles away from the city center.
| City: | 0.310 |
| U.S.: | 0.251 |
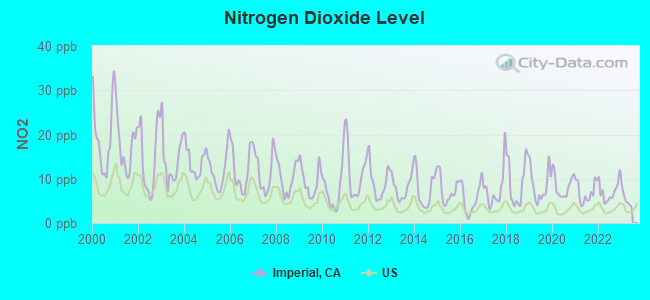
Nitrogen Dioxide (NO2) [ppb] level in 2022 was 7.12. This is worse than average. Closest monitor was 3.5 miles away from the city center.
| City: | 7.12 |
| U.S.: | 5.11 |
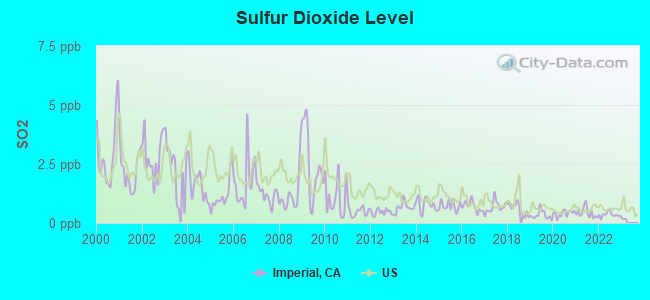
Sulfur Dioxide (SO2) [ppb] level in 2022 was 0.356. This is significantly better than average. Closest monitor was 3.5 miles away from the city center.
| City: | 0.356 |
| U.S.: | 1.515 |
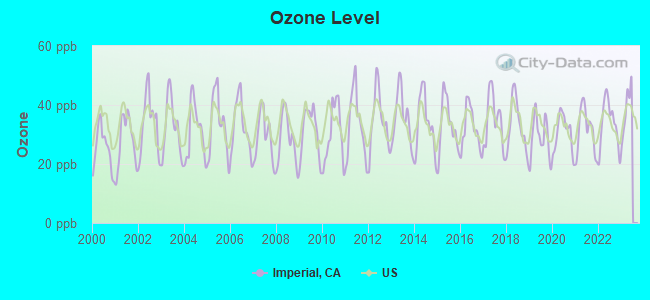
Ozone [ppb] level in 2022 was 33.6. This is about average. Closest monitor was 3.5 miles away from the city center.
| City: | 33.6 |
| U.S.: | 33.3 |
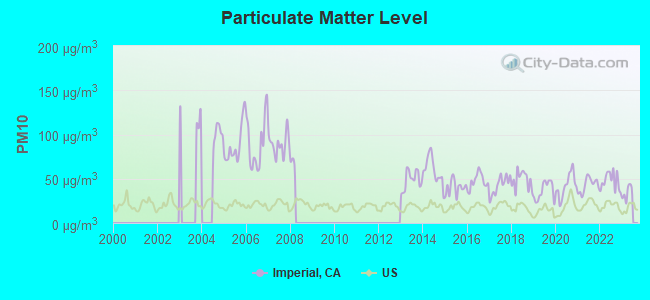
Particulate Matter (PM10) [µg/m3] level in 2022 was 47.4. This is significantly worse than average. Closest monitor was 3.4 miles away from the city center.
| City: | 47.4 |
| U.S.: | 19.2 |
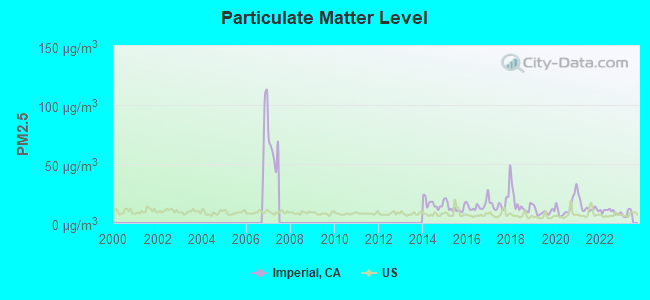
Particulate Matter (PM2.5) [µg/m3] level in 2022 was 9.80. This is worse than average. Closest monitor was 3.5 miles away from the city center.
| City: | 9.80 |
| U.S.: | 8.11 |
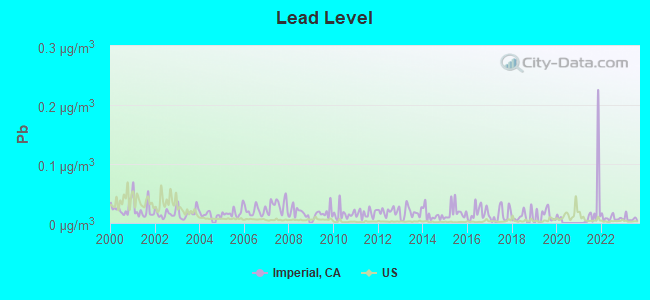
Lead (Pb) [µg/m3] level in 2023 was 0.00715. This is better than average. Closest monitor was 3.4 miles away from the city center.
| City: | 0.00715 |
| U.S.: | 0.00931 |
Earthquake activity:
Imperial-area historical earthquake activity is significantly above California state average. It is 5382% greater than the overall U.S. average.On 6/28/1992 at 11:57:34, a magnitude 7.6 (6.2 MB, 7.6 MS, 7.3 MW, Depth: 0.7 mi, Class: Major, Intensity: VIII - XII) earthquake occurred 108.0 miles away from the city center, causing 3 deaths (1 shaking deaths, 2 other deaths) and 400 injuries, causing $100,000,000 total damage and $40,000,000 insured losses
On 5/19/1940 at 04:36:40, a magnitude 7.2 (7.2 UK) earthquake occurred 27.2 miles away from Imperial center, causing $33,000,000 total damage
On 12/31/1934 at 18:45:56, a magnitude 7.1 (7.1 UK) earthquake occurred 15.5 miles away from Imperial center
On 10/15/1979 at 23:16:54, a magnitude 7.0 (5.7 MB, 6.9 MS, 7.0 ML, 6.4 MW) earthquake occurred 4.3 miles away from the city center
On 10/16/1999 at 09:46:44, a magnitude 7.4 (6.3 MB, 7.4 MS, 7.2 MW, 7.3 ML) earthquake occurred 125.9 miles away from Imperial center
On 7/21/1952 at 11:52:14, a magnitude 7.7 (7.7 UK) earthquake occurred 246.9 miles away from the city center, causing $50,000,000 total damage
Magnitude types: body-wave magnitude (MB), local magnitude (ML), surface-wave magnitude (MS), moment magnitude (MW)
Natural disasters:
The number of natural disasters in Imperial County (10) is smaller than the US average (15).Major Disasters (Presidential) Declared: 8
Emergencies Declared: 1
Causes of natural disasters: Floods: 5, Winter Storms: 3, Earthquakes: 2, Landslides: 2, Freeze: 1, Hurricane: 1, Storm: 1, Tropical Storm: 1, Other: 1 (Note: some incidents may be assigned to more than one category).

Hospitals and medical centers in Imperial:
Other hospitals and medical centers near Imperial:
- GENTIVA HEALTH SERVICES (Home Health Center, about 3 miles away; EL CENTRO, CA)
- OLSTEN KIMBERLY QUALITY CARE (Hospital, about 4 miles away; EL CENTRO, CA)
- PCP HOME HEALTH SERVICES (Home Health Center, about 4 miles away; EL CENTRO, CA)
- HOSPICE OF IMPERIAL VALLEY (Hospital, about 4 miles away; EL CENTRO, CA)
- ACCENTCARE HOME HEALTH OF CALIFORNIA INC (Home Health Center, about 4 miles away; EL CENTRO, CA)
- HELPING HANDS-HOSPICE (Hospital, about 5 miles away; EL CENTRO, CA)
- EL CENTRO REGIONAL MEDICAL CENTER Acute Care Hospitals (about 5 miles away; EL CENTRO, CA)
Airports located in Imperial:
- Imperial County Airport (IPL) (Runways: 2, Commercial Ops: 1,650, Air Taxi Ops: 465, Itinerant Ops: 3,600, Local Ops: 6,500, Military Ops: 2,389)
College/University in Imperial:
Other colleges/universities with over 2000 students near Imperial:
- Arizona Western College (about 64 miles; Yuma, AZ; Full-time enrollment: 5,454)
- College of the Desert (about 78 miles; Palm Desert, CA; FT enrollment: 5,686)
- Cuyamaca College (about 80 miles; El Cajon, CA; FT enrollment: 4,270)
- Grossmont College (about 84 miles; El Cajon, CA; FT enrollment: 10,461)
- Southwestern College (about 85 miles; Chula Vista, CA; FT enrollment: 10,761)
- San Diego State University (about 88 miles; San Diego, CA; FT enrollment: 27,516)
- Alliant International University (about 89 miles; San Diego, CA; FT enrollment: 3,155)
Public high schools in Imperial:
- IMPERIAL HIGH (Students: 658, Location: 517 W. BARIONI BLVD., Grades: 9-12)
- IMPERIAL AVE. HOLBROOK HIGH (Students: 33, Location: 322 N. IMPERIAL AVE., Grades: 9-12)
Private high school in Imperial:
Public elementary/middle schools in Imperial:
- FRANK M. WRIGHT MIDDLE (Students: 773, Location: 885 N. IMPERIAL AVE., Grades: 6-8)
- BEN HULSE ELEMENTARY (Students: 629, Location: 303 S. D ST., Grades: KG-5)
- T. L. WAGGONER ELEMENTARY (Students: 454, Location: 627 JOSHUA TREE ST., Grades: KG-5)
Private elementary/middle school in Imperial:
- FAITH ACADEMY (Students: 59, Location: 320 S J ST, Grades: KG-7)
Points of interest:
Notable locations in Imperial: Motor Vu Twin Drive-In (A), Imperial Valley Pioneer Museum (B), Imperial Public Library (C), Imperial City Hall (D), Desert Air Ambulance (E), Imperial County Fire Department Station 1 - Imperial City Fire Station 4 (F). Display/hide their locations on the map
Church in Imperial: Imperial Chamber of Commerce (A). Display/hide its location on the map
Parks in Imperial include: City Park (1), Emerson Park (2), Evans Park (3), Irving Park (4), California Mid-Winter Fairgrounds (5). Display/hide their locations on the map
Drinking water stations with addresses in Imperial and their reported violations in the past:
CALIPATRIA STATE PRISON (Population served: 4,800, Purch surface water):Past health violations:CENTINELA STATE PRISON (Population served: 3,721, Surface water):
- Treatment Technique (SWTR and GWR) - In FEB-2012. Follow-up actions: St Violation/Reminder Notice (APR-11-2012)
- MCL, Monthly (TCR) - In JUL-2009, Contaminant: Coliform. Follow-up actions: St Compliance achieved (JUL-31-2009), St Public Notif issued (FEB-25-2010)
Past health violations:
- MCL, Average - Between JUL-2013 and SEP-2013, Contaminant: TTHM. Follow-up actions: St AO (w/o penalty) issued (2 times from NOV-13-2012 to JUN-25-2013)
- MCL, Average - Between APR-2013 and JUN-2013, Contaminant: TTHM. Follow-up actions: St AO (w/o penalty) issued (2 times from NOV-13-2012 to JUN-25-2013)
- MCL, Average - Between JAN-2013 and MAR-2013, Contaminant: TTHM. Follow-up actions: St AO (w/o penalty) issued (2 times from NOV-13-2012 to JUN-25-2013)
- Treatment Technique (SWTR and GWR) - In SEP-2012. Follow-up actions: St AO (w/o penalty) issued (DEC-19-2012)
- MCL, Average - Between JUL-2012 and SEP-2012, Contaminant: TTHM. Follow-up actions: St AO (w/o penalty) issued (2 times from NOV-13-2012 to JUN-25-2013)
- MCL, Average - Between OCT-2009 and DEC-2009, Contaminant: TTHM. Follow-up actions: St Public Notif issued (JUN-08-2009), St Compliance achieved (APR-12-2010)
- 4 other older health violations
| This city: | 3.3 people |
| California: | 2.9 people |
| This city: | 82.2% |
| Whole state: | 68.7% |
| This city: | 6.7% |
| Whole state: | 7.2% |
Likely homosexual households (counted as self-reported same-sex unmarried-partner households)
- Lesbian couples: 0.4% of all households
- Gay men: 0.2% of all households
29 people in nursing homes in 2000
2 people in homes or halfway houses for drug/alcohol abuse in 2000
For population 15 years and over in Imperial:
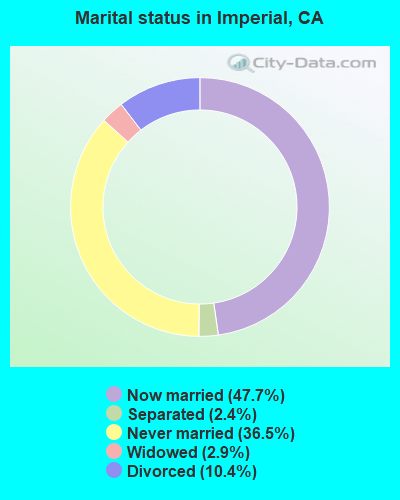
- Never married: 36.5%
- Now married: 47.7%
- Separated: 2.4%
- Widowed: 2.9%
- Divorced: 10.4%
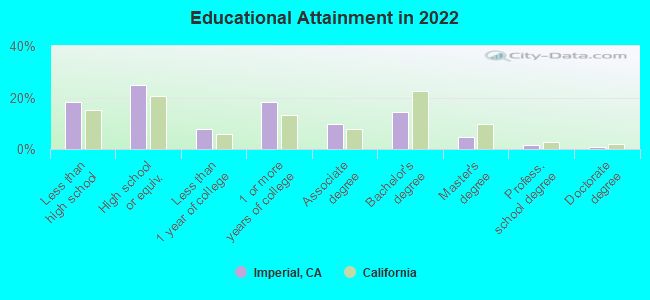
For population 25 years and over in Imperial:
- High school or higher: 80.1%
- Bachelor's degree or higher: 20.3%
- Graduate or professional degree: 6.6%
- Unemployed: 8.3%
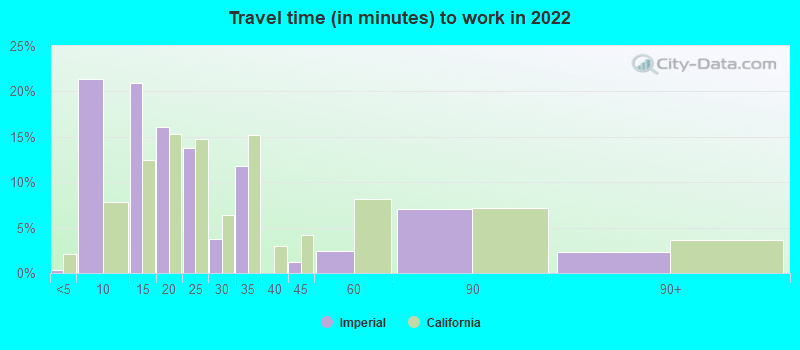
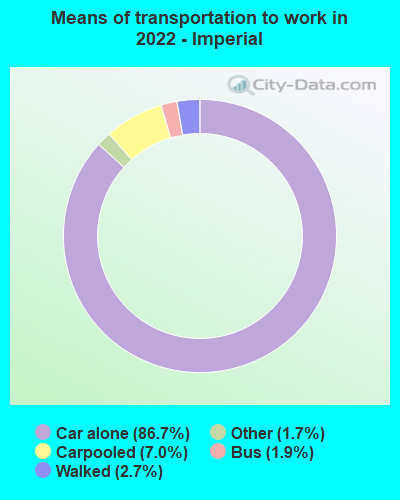
- Mean travel time to work (commute): 17.9 minutes
| Here: | 12.7 |
| California average: | 15.5 |
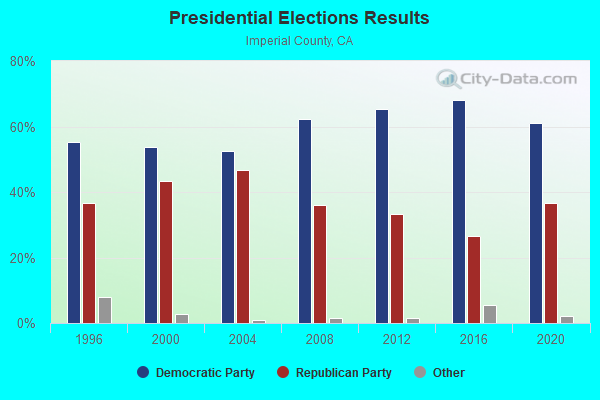
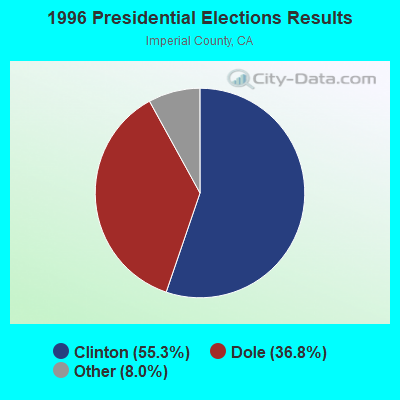
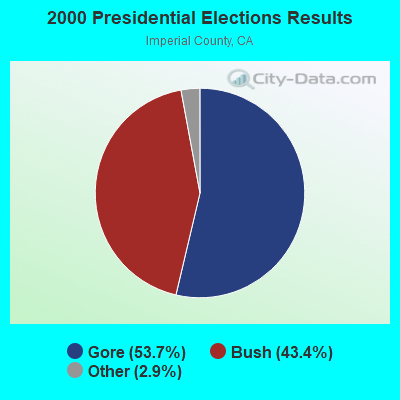
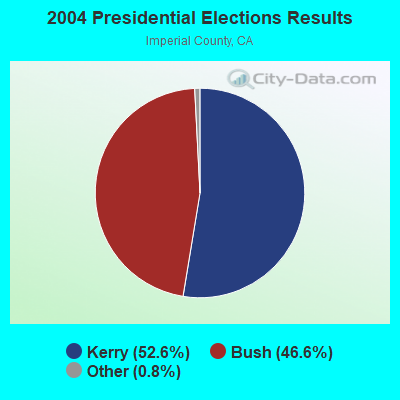
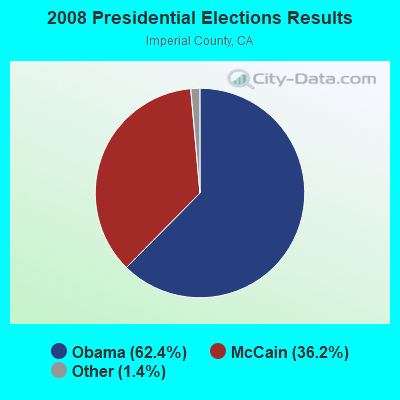
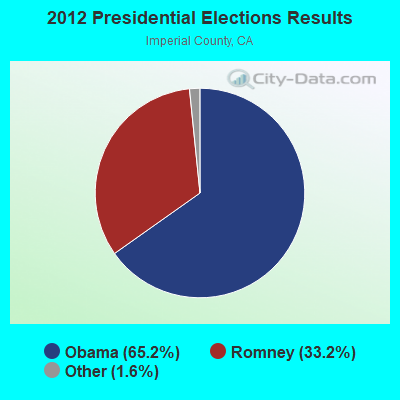
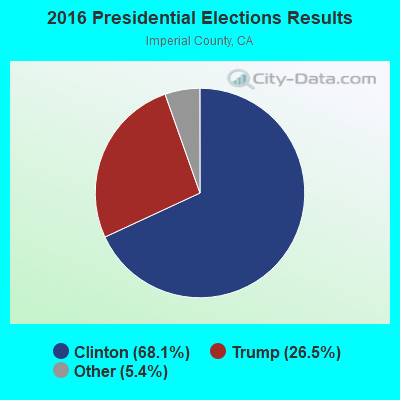
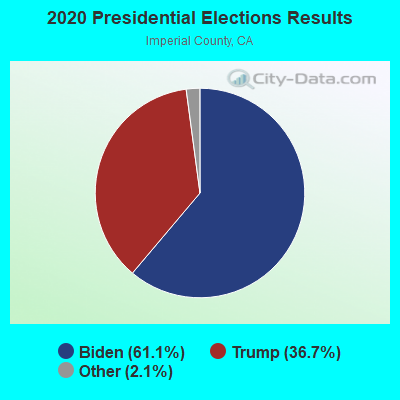
Graphs represent county-level data. Detailed 2008 Election Results
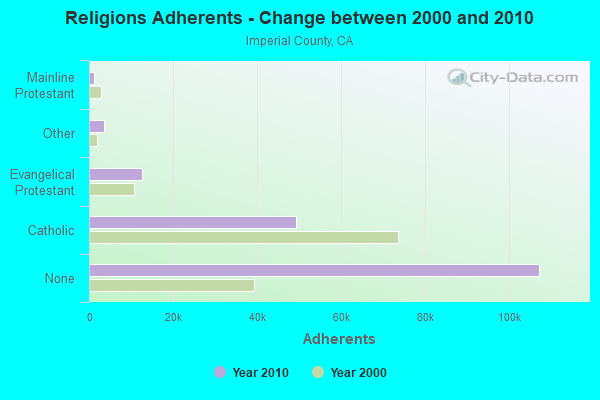
Religion statistics for Imperial, CA (based on Imperial County data)
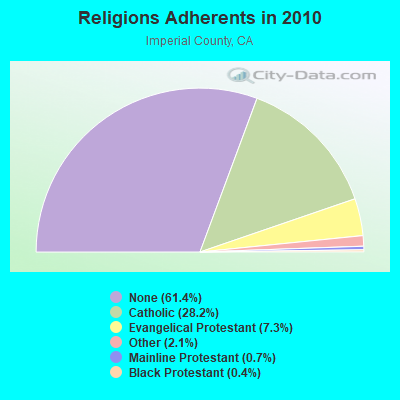
| Religion | Adherents | Congregations |
|---|---|---|
| Catholic | 49,226 | 12 |
| Evangelical Protestant | 12,707 | 80 |
| Other | 3,633 | 14 |
| Mainline Protestant | 1,137 | 12 |
| Black Protestant | 669 | 5 |
| None | 107,156 | - |
Food Environment Statistics:
| Imperial County: | 2.49 / 10,000 pop. |
| California: | 2.14 / 10,000 pop. |
| This county: | 0.06 / 10,000 pop. |
| California: | 0.04 / 10,000 pop. |
| Here: | 0.62 / 10,000 pop. |
| California: | 0.62 / 10,000 pop. |
| This county: | 3.23 / 10,000 pop. |
| State: | 1.49 / 10,000 pop. |
| This county: | 4.85 / 10,000 pop. |
| California: | 7.42 / 10,000 pop. |
| Imperial County: | 6.9% |
| State: | 7.3% |
| Imperial County: | 25.4% |
| State: | 21.3% |
| Imperial County: | 16.6% |
| California: | 17.9% |
Health and Nutrition:
| This city: | 48.8% |
| California: | 49.4% |
| Imperial: | 48.9% |
| California: | 48.0% |
| Imperial: | 28.5 |
| California: | 28.1 |
| Imperial: | 19.5% |
| State: | 20.2% |
| This city: | 10.5% |
| California: | 11.2% |
| This city: | 6.8 |
| California: | 6.8 |
| This city: | 34.0% |
| California: | 31.5% |
| Here: | 57.4% |
| California: | 56.4% |
| Imperial: | 82.6% |
| State: | 80.9% |
More about Health and Nutrition of Imperial, CA Residents
| Local government employment and payroll (March 2022) | |||||
| Function | Full-time employees | Monthly full-time payroll | Average yearly full-time wage | Part-time employees | Monthly part-time payroll |
|---|---|---|---|---|---|
| Police Protection - Officers | 19 | $158,768 | $100,275 | 0 | $0 |
| Streets and Highways | 16 | $92,244 | $69,183 | 0 | $0 |
| Water Supply | 11 | $54,825 | $59,809 | 0 | $0 |
| Financial Administration | 9 | $52,284 | $69,712 | 1 | $531 |
| Parks and Recreation | 7 | $30,741 | $52,699 | 4 | $5,397 |
| Sewerage | 7 | $35,686 | $61,176 | 0 | $0 |
| Other Government Administration | 5 | $43,046 | $103,310 | 8 | $1,950 |
| Local Libraries | 3 | $18,418 | $73,672 | 7 | $12,214 |
| Police - Other | 3 | $13,577 | $54,308 | 0 | $0 |
| Other and Unallocable | 3 | $25,478 | $101,912 | 0 | $0 |
| Electric Power | 1 | $5,016 | $60,192 | 0 | $0 |
| Totals for Government | 84 | $530,081 | $75,726 | 20 | $20,093 |
Imperial government finances - Expenditure in 2021 (per resident):
- Construction - Regular Highways: $1,420,000 ($66.88)
- Current Operations - Police Protection: $3,723,000 ($175.34)
Water Utilities: $3,488,000 ($164.27)
Regular Highways: $2,732,000 ($128.67)
Sewerage: $2,663,000 ($125.42)
Central Staff Services: $2,654,000 ($124.99)
Solid Waste Management: $1,414,000 ($66.59)
Local Fire Protection: $761,000 ($35.84)
Parks and Recreation: $729,000 ($34.33)
Housing and Community Development: $373,000 ($17.57)
Protective Inspection and Regulation - Other: $300,000 ($14.13)
Libraries: $251,000 ($11.82)
Health - Other: $77,000 ($3.63)
- General - Interest on Debt: $1,078,000 ($50.77)
- Water Utilities - Interest on Debt: $480,000 ($22.61)
Imperial government finances - Revenue in 2021 (per resident):
- Charges - Sewerage: $5,697,000 ($268.31)
Other: $1,555,000 ($73.24)
Solid Waste Management: $1,494,000 ($70.36)
Parks and Recreation: $46,000 ($2.17)
- Federal Intergovernmental - Other: $716,000 ($33.72)
- Local Intergovernmental - Other: $123,000 ($5.79)
- Miscellaneous - General Revenue - Other: $1,538,000 ($72.43)
Special Assessments: $1,073,000 ($50.53)
Interest Earnings: $917,000 ($43.19)
Fines and Forfeits: $180,000 ($8.48)
Rents: $65,000 ($3.06)
- Revenue - Water Utilities: $6,197,000 ($291.86)
- State Intergovernmental - Other: $1,182,000 ($55.67)
Water Utilities: $1,046,000 ($49.26)
Highways: $793,000 ($37.35)
General Local Government Support: $12,000 ($0.57)
- Tax - General Sales and Gross Receipts: $3,724,000 ($175.39)
Property: $3,499,000 ($164.79)
Other: $1,485,000 ($69.94)
Other License: $554,000 ($26.09)
Public Utilities Sales: $319,000 ($15.02)
Documentary and Stock Transfer: $97,000 ($4.57)
Occupation and Business License - Other: $63,000 ($2.97)
Other Selective Sales: $62,000 ($2.92)
Imperial government finances - Debt in 2021 (per resident):
- Long Term Debt - Beginning Outstanding - Unspecified Public Purpose: $38,185,000 ($1798.38)
Outstanding Unspecified Public Purpose: $35,665,000 ($1679.70)
Retired Unspecified Public Purpose: $2,520,000 ($118.68)
Imperial government finances - Cash and Securities in 2021 (per resident):
- Other Funds - Cash and Securities: $17,882,000 ($842.18)
- Sinking Funds - Cash and Securities: $2,912,000 ($137.15)
| Businesses in Imperial, CA | ||||
| Name | Count | Name | Count | |
|---|---|---|---|---|
| Budget Car Rental | 1 | Quiznos | 1 | |
| Circle K | 1 | Toyota | 1 | |
| FedEx | 1 | U-Haul | 1 | |
| Nissan | 1 | UPS | 1 | |
Strongest AM radio stations in Imperial:
- KWST (1430 AM; 1 kW; EL CENTRO, CA; Owner: ENTRAVISION HOLDINGS, LLC)
- KXO (1230 AM; 1 kW; EL CENTRO, CA; Owner: KXO, INC.)
- KFMB (760 AM; 50 kW; SAN DIEGO, CA; Owner: MIDWEST TELEVISION, INC.)
- KCBQ (1170 AM; 50 kW; SAN DIEGO, CA; Owner: RADIO 1210, INC.)
- KICO (1490 AM; 1 kW; CALEXICO, CA; Owner: HANSON BROADCASTING CO. OF CALIFORNIA)
- KROP (1300 AM; 1 kW; BRAWLEY, CA; Owner: COMMONWEALTH LICENSE SUBSIDIARY, LLC)
- KPLS (830 AM; 50 kW; ORANGE, CA; Owner: CRN LICENSES, LLC)
- KLAC (570 AM; 50 kW; LOS ANGELES, CA; Owner: AMFM RADIO LICENSES, L.L.C.)
- KFI (640 AM; 50 kW; LOS ANGELES, CA; Owner: CAPSTAR TX LIMITED PARTNERSHIP)
- KSPN (710 AM; 50 kW; LOS ANGELES, CA; Owner: KABC-AM RADIO, INC.)
- KTNQ (1020 AM; 50 kW; LOS ANGELES, CA; Owner: KTNQ-AM LICENSE CORP.)
- KPRZ (1210 AM; 20 kW; SAN MARCOS, CA; Owner: RADIO 1210, INC.)
- KFWB (980 AM; 50 kW; LOS ANGELES, CA; Owner: INFINITY BROADCASTING OPERATIONS, INC.)
Strongest FM radio stations in Imperial:
- KMXX (99.3 FM; IMPERIAL, CA; Owner: ENTRAVISION HOLDINGS, LLC)
- KGBA (100.1 FM; HOLTVILLE, CA; Owner: THE VOICE OF INTERNATONAL CHRISTIAN EVANGELISM, INC.)
- KUBO (88.7 FM; CALEXICO, CA; Owner: RADIO BILINGUE, INC.)
- KXO-FM (107.5 FM; EL CENTRO, CA; Owner: KXO, INC.)
- KSIQ (96.1 FM; BRAWLEY, CA; Owner: COMMONWEALTH LICENSE SUBSIDIARY, LLC)
- KSEH (94.5 FM; BRAWLEY, CA; Owner: ENTRAVISION HOLDINGS, LLC)
- KZAL (105.5 FM; DESERT CENTER, CA; Owner: WORLDWIDE MULTI-MEDIA B/C CO.)
- KQVO (97.7 FM; CALEXICO, CA; Owner: HANSON BROADCASTING CO. OF CALIFORNIA)
- KLVJ (100.1 FM; JULIAN, CA; Owner: EDUCATIONAL MEDIA FOUNDATION)
- KSSB (100.9 FM; CALIPATRIA, CA; Owner: PHILLIP J. PLANK)
TV broadcast stations around Imperial:
- K56GC (Channel 56; EL CENTRO-HOLTVILLE, CA; Owner: INSPIRATION TELEVISION, INC.)
- K36FO (Channel 36; CALEXICO, CA; Owner: BROADCAST GROUP, LTD.)
- National Bridge Inventory (NBI) Statistics
- 8Number of bridges
- 56ft / 17.1mTotal length
- $297,000Total costs
- 8,671Total average daily traffic
- 286Total average daily truck traffic
- 10,327Total future (year 2038) average daily traffic
FCC Registered Private Land Mobile Towers: 2 (See the full list of FCC Registered Private Land Mobile Towers in Imperial, CA)
FCC Registered Broadcast Land Mobile Towers: 20 (See the full list of FCC Registered Broadcast Land Mobile Towers)
FCC Registered Microwave Towers: 24 (See the full list of FCC Registered Microwave Towers in this town)
FCC Registered Paging Towers: 1 (See the full list of FCC Registered Paging Towers)
FCC Registered Maritime Coast & Aviation Ground Towers: 10 (See the full list of FCC Registered Maritime Coast & Aviation Ground Towers)
FCC Registered Amateur Radio Licenses: 75 (See the full list of FCC Registered Amateur Radio Licenses in Imperial)
FAA Registered Aircraft: 14 (See the full list of FAA Registered Aircraft in Imperial)
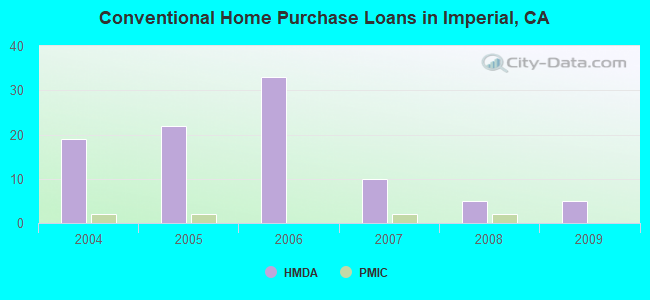
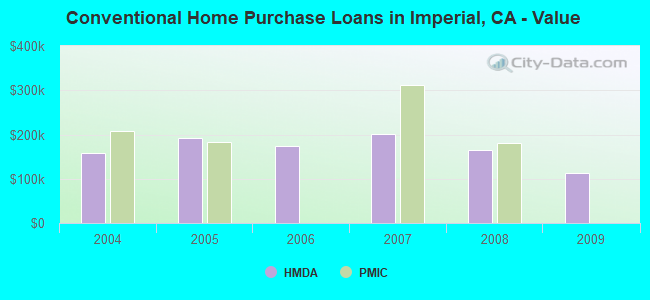
| Home Mortgage Disclosure Act Aggregated Statistics For Year 2009 (Based on 1 partial tract) | ||||||||
| A) FHA, FSA/RHS & VA Home Purchase Loans | B) Conventional Home Purchase Loans | C) Refinancings | F) Non-occupant Loans on < 5 Family Dwellings (A B C & D) | |||||
|---|---|---|---|---|---|---|---|---|
| Number | Average Value | Number | Average Value | Number | Average Value | Number | Average Value | |
| LOANS ORIGINATED | 13 | $149,850 | 5 | $113,554 | 7 | $181,814 | 2 | $93,355 |
| APPLICATIONS APPROVED, NOT ACCEPTED | 0 | $0 | 0 | $0 | 0 | $0 | 0 | $0 |
| APPLICATIONS DENIED | 2 | $151,285 | 1 | $79,950 | 4 | $167,458 | 0 | $0 |
| APPLICATIONS WITHDRAWN | 3 | $163,477 | 1 | $85,150 | 3 | $242,017 | 0 | $0 |
| FILES CLOSED FOR INCOMPLETENESS | 0 | $0 | 0 | $0 | 0 | $0 | 0 | $0 |
Detailed HMDA statistics for the following Tracts: 0112.01
| Private Mortgage Insurance Companies Aggregated Statistics For Year 2008 (Based on 1 partial tract) | ||||
| A) Conventional Home Purchase Loans | B) Refinancings | |||
|---|---|---|---|---|
| Number | Average Value | Number | Average Value | |
| LOANS ORIGINATED | 2 | $180,215 | 1 | $158,440 |
| APPLICATIONS APPROVED, NOT ACCEPTED | 0 | $0 | 2 | $229,285 |
| APPLICATIONS DENIED | 0 | $0 | 0 | $0 |
| APPLICATIONS WITHDRAWN | 0 | $0 | 0 | $0 |
| FILES CLOSED FOR INCOMPLETENESS | 0 | $0 | 0 | $0 |
Detailed PMIC statistics for the following Tracts: 0112.01
2005 - 2018 National Fire Incident Reporting System (NFIRS) incidents
- Fire incident types reported to NFIRS in Imperial, CA
- 41255.6%Outside Fires
- 16121.7%Structure Fires
- 12116.3%Mobile Property/Vehicle Fires
- 476.3%Other
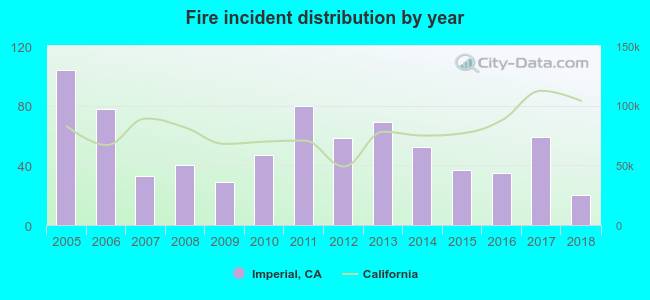 Based on the data from the years 2005 - 2018 the average number of fires per year is 53. The highest number of fire incidents - 104 took place in 2005, and the least - 20 in 2018. The data has a declining trend.
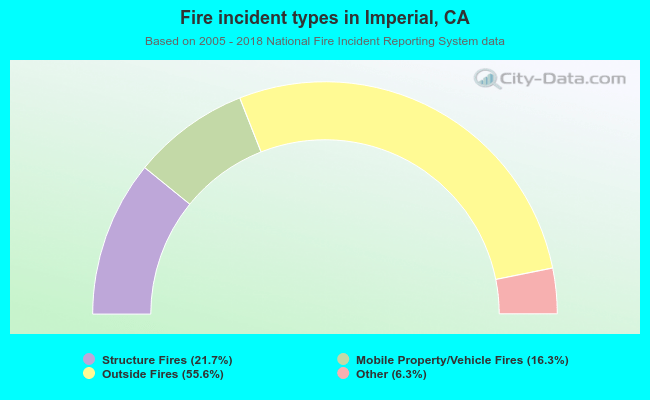 When looking into fire subcategories, the most reports belonged to: Outside Fires (55.6%), and Structure Fires (21.7%).
| Most common first names in Imperial, CA among deceased individuals | ||
| Name | Count | Lived (average) |
|---|---|---|
| William | 27 | 74.2 years |
| James | 25 | 71.8 years |
| John | 23 | 72.9 years |
| Maria | 19 | 74.9 years |
| Robert | 19 | 73.6 years |
| Mary | 18 | 74.6 years |
| George | 12 | 76.3 years |
| Charles | 12 | 72.7 years |
| Jose | 11 | 63.0 years |
| Frances | 10 | 79.3 years |
| Most common last names in Imperial, CA among deceased individuals | ||
| Last name | Count | Lived (average) |
|---|---|---|
| Johnson | 12 | 76.8 years |
| Nelson | 10 | 74.6 years |
| Gonzalez | 10 | 77.6 years |
| Smith | 10 | 76.8 years |
| Cox | 10 | 77.2 years |
| Wilson | 9 | 81.2 years |
| Williams | 9 | 71.4 years |
| Estrada | 9 | 71.1 years |
| Jones | 8 | 75.8 years |
| Lopez | 8 | 66.6 years |
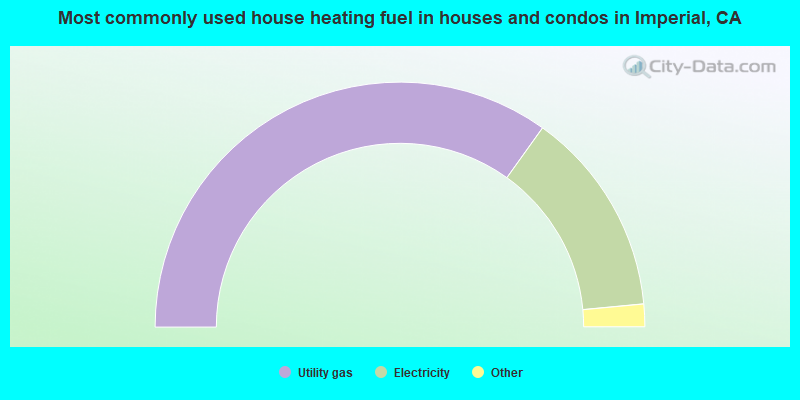
- 69.8%Utility gas
- 27.2%Electricity
- 1.3%No fuel used
- 1.1%Wood
- 0.6%Other fuel
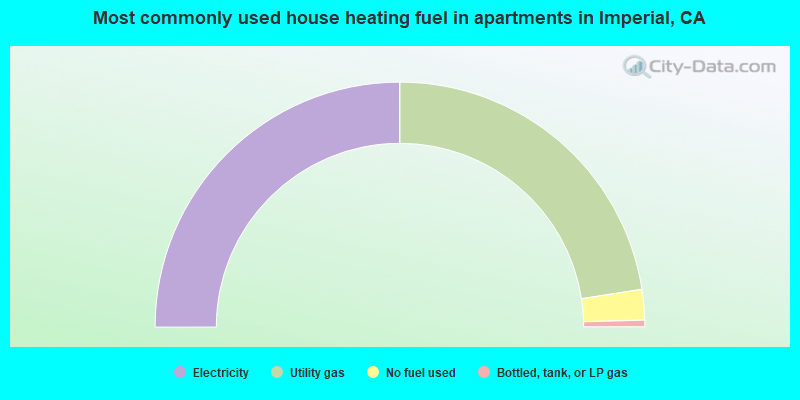
- 50.0%Electricity
- 45.1%Utility gas
- 4.0%No fuel used
- 0.9%Bottled, tank, or LP gas
Imperial compared to California state average:
- Median house value below state average.
- Unemployed percentage below state average.
- Hispanic race population percentage significantly above state average.
- Foreign-born population percentage significantly above state average.
- Renting percentage below state average.
- Length of stay since moving in below state average.
- House age significantly below state average.
- Number of college students above state average.
Imperial on our top lists:
- #5 on the list of "Top 101 cities with largest percentage of males in industries: utilities (population 5,000+)"
- #13 on the list of "Top 101 cities with largest percentage of males in occupations: law enforcement workers including supervisors (population 5,000+)"
- #41 on the list of "Top 101 cities with largest percentage of females in industries: utilities (population 5,000+)"
- #81 on the list of "Top 101 cities with the largest percentage population increase from 2000 (population 5,000+)"
- #1 on the list of "Top 101 counties with the highest lead air pollution readings in 2012 (µg/m3)"
- #8 on the list of "Top 101 counties with the highest Particulate Matter (PM10) Annual air pollution readings in 2012 (µg/m3)"
- #13 on the list of "Top 101 counties with the highest number of births per 1000 residents 2007-2013"
- #27 on the list of "Top 101 counties with the highest Particulate Matter (PM2.5) Annual air pollution readings in 2012 (µg/m3)"
- #37 on the list of "Top 101 counties with the largest decrease in the number of deaths per 1000 residents 2000-2006 to 2007-2013 (pop. 50,000+)"

|
|
Total of 10 patent applications in 2008-2024.