Howard, Wisconsin Submit your own pictures of this village and show them to the world
OSM Map
General Map
Google Map
MSN Map
OSM Map
General Map
Google Map
MSN Map
OSM Map
General Map
Google Map
MSN Map
OSM Map
General Map
Google Map
MSN Map
Please wait while loading the map...
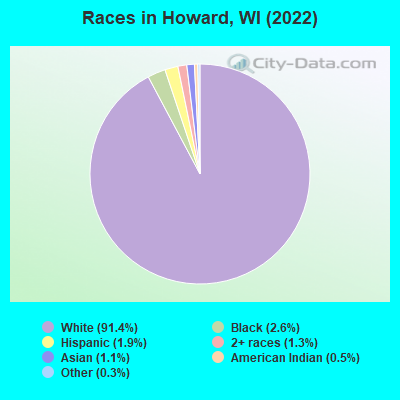
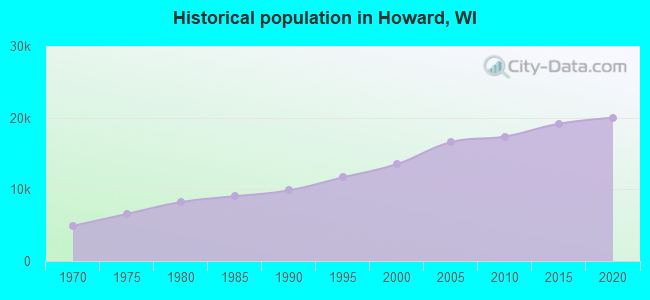
Population in 2022: 20,460 (95% urban, 5% rural). Population change since 2000: +51.0%Males: 9,755 Females: 10,705
March 2022 cost of living index in Howard: 92.3 (less than average, U.S. average is 100) Percentage of residents living in poverty in 2022: 6.2%for White Non-Hispanic residents , 19.8% for Black residents , 23.5% for Hispanic or Latino residents , 12.0% for American Indian residents , 23.6% for two or more races residents )Business Search - 14 Million verified businesses
Data:
Median household income ($)
Median household income (% change since 2000)
Household income diversity
Ratio of average income to average house value (%)
Ratio of average income to average rent
Median household income ($) - White
Median household income ($) - Black or African American
Median household income ($) - Asian
Median household income ($) - Hispanic or Latino
Median household income ($) - American Indian and Alaska Native
Median household income ($) - Multirace
Median household income ($) - Other Race
Median household income for houses/condos with a mortgage ($)
Median household income for apartments without a mortgage ($)
Races - White alone (%)
Races - White alone (% change since 2000)
Races - Black alone (%)
Races - Black alone (% change since 2000)
Races - American Indian alone (%)
Races - American Indian alone (% change since 2000)
Races - Asian alone (%)
Races - Asian alone (% change since 2000)
Races - Hispanic (%)
Races - Hispanic (% change since 2000)
Races - Native Hawaiian and Other Pacific Islander alone (%)
Races - Native Hawaiian and Other Pacific Islander alone (% change since 2000)
Races - Two or more races (%)
Races - Two or more races (% change since 2000)
Races - Other race alone (%)
Races - Other race alone (% change since 2000)
Racial diversity
Unemployment (%)
Unemployment (% change since 2000)
Unemployment (%) - White
Unemployment (%) - Black or African American
Unemployment (%) - Asian
Unemployment (%) - Hispanic or Latino
Unemployment (%) - American Indian and Alaska Native
Unemployment (%) - Multirace
Unemployment (%) - Other Race
Population density (people per square mile)
Population - Males (%)
Population - Females (%)
Population - Males (%) - White
Population - Males (%) - Black or African American
Population - Males (%) - Asian
Population - Males (%) - Hispanic or Latino
Population - Males (%) - American Indian and Alaska Native
Population - Males (%) - Multirace
Population - Males (%) - Other Race
Population - Females (%) - White
Population - Females (%) - Black or African American
Population - Females (%) - Asian
Population - Females (%) - Hispanic or Latino
Population - Females (%) - American Indian and Alaska Native
Population - Females (%) - Multirace
Population - Females (%) - Other Race
Coronavirus confirmed cases (May 08, 2024)
Deaths caused by coronavirus (May 08, 2024)
Coronavirus confirmed cases (per 100k population) (May 08, 2024)
Deaths caused by coronavirus (per 100k population) (May 08, 2024)
Daily increase in number of cases (May 08, 2024)
Weekly increase in number of cases (May 08, 2024)
Cases doubled (in days) (May 08, 2024)
Hospitalized patients (Apr 18, 2022)
Negative test results (Apr 18, 2022)
Total test results (Apr 18, 2022)
COVID Vaccine doses distributed (per 100k population) (Sep 19, 2023)
COVID Vaccine doses administered (per 100k population) (Sep 19, 2023)
COVID Vaccine doses distributed (Sep 19, 2023)
COVID Vaccine doses administered (Sep 19, 2023)
Likely homosexual households (%)
Likely homosexual households (% change since 2000)
Likely homosexual households - Lesbian couples (%)
Likely homosexual households - Lesbian couples (% change since 2000)
Likely homosexual households - Gay men (%)
Likely homosexual households - Gay men (% change since 2000)
Cost of living index
Median gross rent ($)
Median contract rent ($)
Median monthly housing costs ($)
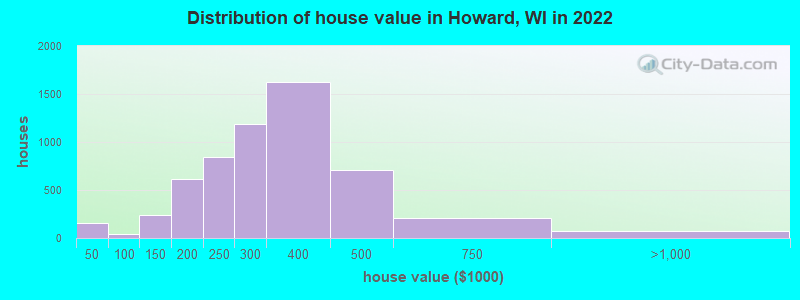
Median house or condo value ($)
Median house or condo value ($ change since 2000)
Mean house or condo value by units in structure - 1, detached ($)
Mean house or condo value by units in structure - 1, attached ($)
Mean house or condo value by units in structure - 2 ($)
Mean house or condo value by units in structure by units in structure - 3 or 4 ($)
Mean house or condo value by units in structure - 5 or more ($)
Mean house or condo value by units in structure - Boat, RV, van, etc. ($)
Mean house or condo value by units in structure - Mobile home ($)
Median house or condo value ($) - White
Median house or condo value ($) - Black or African American
Median house or condo value ($) - Asian
Median house or condo value ($) - Hispanic or Latino
Median house or condo value ($) - American Indian and Alaska Native
Median house or condo value ($) - Multirace
Median house or condo value ($) - Other Race
Median resident age
Resident age diversity
Median resident age - Males
Median resident age - Females
Median resident age - White
Median resident age - Black or African American
Median resident age - Asian
Median resident age - Hispanic or Latino
Median resident age - American Indian and Alaska Native
Median resident age - Multirace
Median resident age - Other Race
Median resident age - Males - White
Median resident age - Males - Black or African American
Median resident age - Males - Asian
Median resident age - Males - Hispanic or Latino
Median resident age - Males - American Indian and Alaska Native
Median resident age - Males - Multirace
Median resident age - Males - Other Race
Median resident age - Females - White
Median resident age - Females - Black or African American
Median resident age - Females - Asian
Median resident age - Females - Hispanic or Latino
Median resident age - Females - American Indian and Alaska Native
Median resident age - Females - Multirace
Median resident age - Females - Other Race
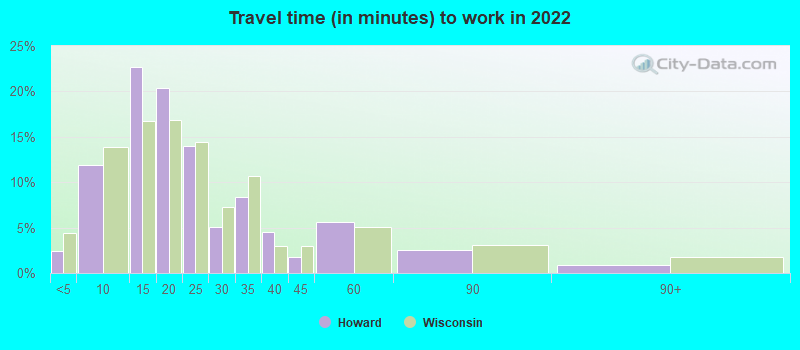
Commute - mean travel time to work (minutes)
Travel time to work - Less than 5 minutes (%)
Travel time to work - Less than 5 minutes (% change since 2000)
Travel time to work - 5 to 9 minutes (%)
Travel time to work - 5 to 9 minutes (% change since 2000)
Travel time to work - 10 to 19 minutes (%)
Travel time to work - 10 to 19 minutes (% change since 2000)
Travel time to work - 20 to 29 minutes (%)
Travel time to work - 20 to 29 minutes (% change since 2000)
Travel time to work - 30 to 39 minutes (%)
Travel time to work - 30 to 39 minutes (% change since 2000)
Travel time to work - 40 to 59 minutes (%)
Travel time to work - 40 to 59 minutes (% change since 2000)
Travel time to work - 60 to 89 minutes (%)
Travel time to work - 60 to 89 minutes (% change since 2000)
Travel time to work - 90 or more minutes (%)
Travel time to work - 90 or more minutes (% change since 2000)
Marital status - Never married (%)
Marital status - Now married (%)
Marital status - Separated (%)
Marital status - Widowed (%)
Marital status - Divorced (%)
Median family income ($)
Median family income (% change since 2000)
Median non-family income ($)
Median non-family income (% change since 2000)
Median per capita income ($)
Median per capita income (% change since 2000)
Median family income ($) - White
Median family income ($) - Black or African American
Median family income ($) - Asian
Median family income ($) - Hispanic or Latino
Median family income ($) - American Indian and Alaska Native
Median family income ($) - Multirace
Median family income ($) - Other Race
Median year house/condo built
Median year apartment built
Year house built - Built 2005 or later (%)
Year house built - Built 2000 to 2004 (%)
Year house built - Built 1990 to 1999 (%)
Year house built - Built 1980 to 1989 (%)
Year house built - Built 1970 to 1979 (%)
Year house built - Built 1960 to 1969 (%)
Year house built - Built 1950 to 1959 (%)
Year house built - Built 1940 to 1949 (%)
Year house built - Built 1939 or earlier (%)
Average household size
Household density (households per square mile)
Average household size - White
Average household size - Black or African American
Average household size - Asian
Average household size - Hispanic or Latino
Average household size - American Indian and Alaska Native
Average household size - Multirace
Average household size - Other Race
Occupied housing units (%)
Vacant housing units (%)
Owner occupied housing units (%)
Renter occupied housing units (%)
Vacancy status - For rent (%)
Vacancy status - For sale only (%)
Vacancy status - Rented or sold, not occupied (%)
Vacancy status - For seasonal, recreational, or occasional use (%)
Vacancy status - For migrant workers (%)
Vacancy status - Other vacant (%)
Residents with income below the poverty level (%)
Residents with income below 50% of the poverty level (%)
Children below poverty level (%)
Poor families by family type - Married-couple family (%)
Poor families by family type - Male, no wife present (%)
Poor families by family type - Female, no husband present (%)
Poverty status for native-born residents (%)
Poverty status for foreign-born residents (%)
Poverty among high school graduates not in families (%)
Poverty among people who did not graduate high school not in families (%)
Residents with income below the poverty level (%) - White
Residents with income below the poverty level (%) - Black or African American
Residents with income below the poverty level (%) - Asian
Residents with income below the poverty level (%) - Hispanic or Latino
Residents with income below the poverty level (%) - American Indian and Alaska Native
Residents with income below the poverty level (%) - Multirace
Residents with income below the poverty level (%) - Other Race
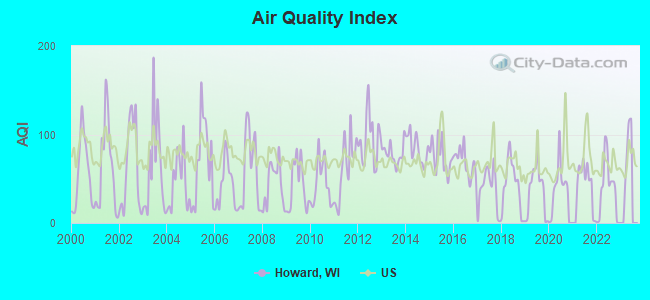
Air pollution - Air Quality Index (AQI)
Air pollution - CO
Air pollution - NO2
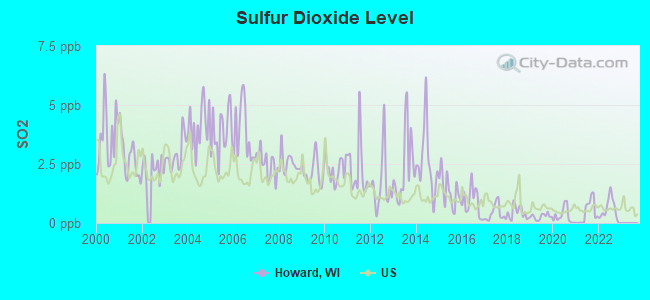
Air pollution - SO2
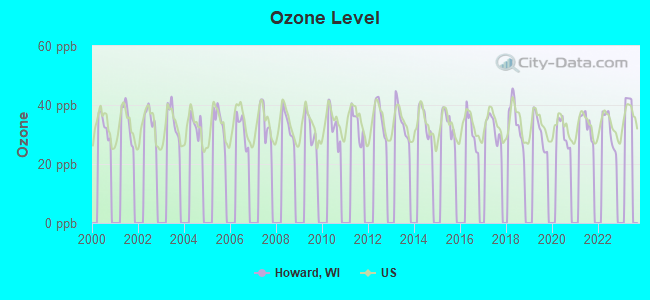
Air pollution - Ozone
Air pollution - PM10
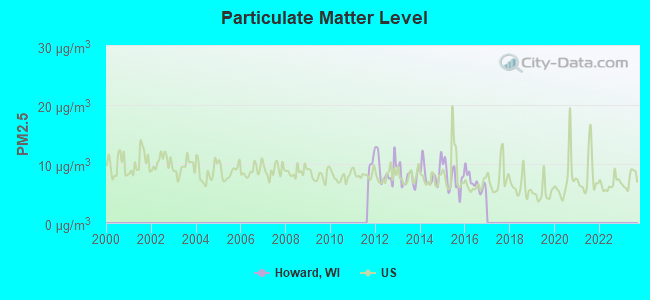
Air pollution - PM25
Air pollution - Pb
Crime - Murders per 100,000 population
Crime - Rapes per 100,000 population
Crime - Robberies per 100,000 population
Crime - Assaults per 100,000 population
Crime - Burglaries per 100,000 population
Crime - Thefts per 100,000 population
Crime - Auto thefts per 100,000 population
Crime - Arson per 100,000 population
Crime - City-data.com crime index
Crime - Violent crime index
Crime - Property crime index
Crime - Murders per 100,000 population (5 year average)
Crime - Rapes per 100,000 population (5 year average)
Crime - Robberies per 100,000 population (5 year average)
Crime - Assaults per 100,000 population (5 year average)
Crime - Burglaries per 100,000 population (5 year average)
Crime - Thefts per 100,000 population (5 year average)
Crime - Auto thefts per 100,000 population (5 year average)
Crime - Arson per 100,000 population (5 year average)
Crime - City-data.com crime index (5 year average)
Crime - Violent crime index (5 year average)
Crime - Property crime index (5 year average)
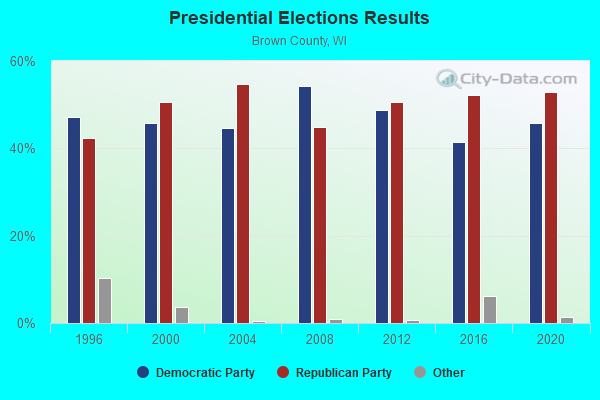
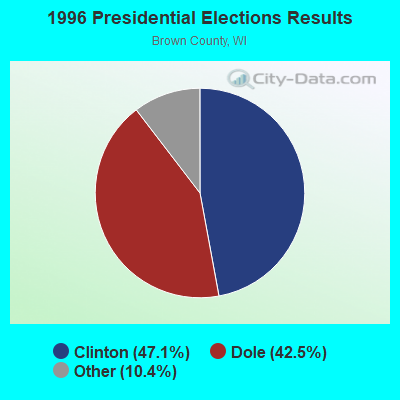
1996 Presidential Elections Results (%) - Democratic Party (Clinton)
1996 Presidential Elections Results (%) - Republican Party (Dole)
1996 Presidential Elections Results (%) - Other
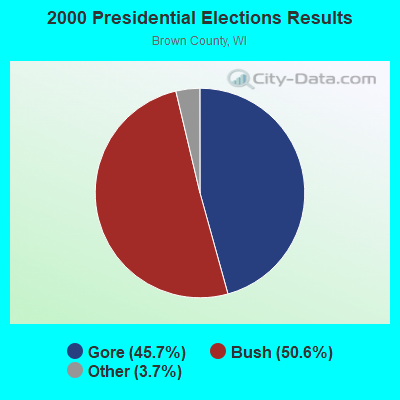
2000 Presidential Elections Results (%) - Democratic Party (Gore)
2000 Presidential Elections Results (%) - Republican Party (Bush)
2000 Presidential Elections Results (%) - Other
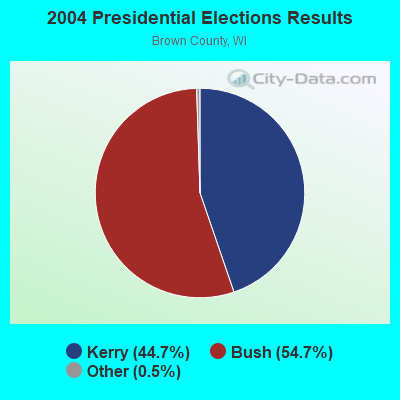
2004 Presidential Elections Results (%) - Democratic Party (Kerry)
2004 Presidential Elections Results (%) - Republican Party (Bush)
2004 Presidential Elections Results (%) - Other
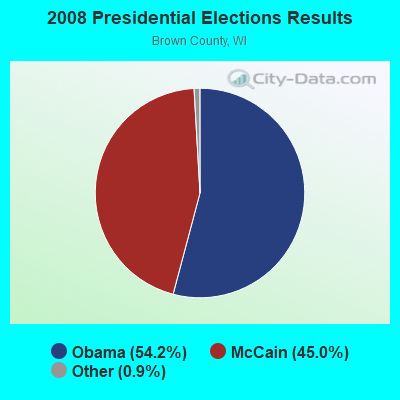
2008 Presidential Elections Results (%) - Democratic Party (Obama)
2008 Presidential Elections Results (%) - Republican Party (McCain)
2008 Presidential Elections Results (%) - Other
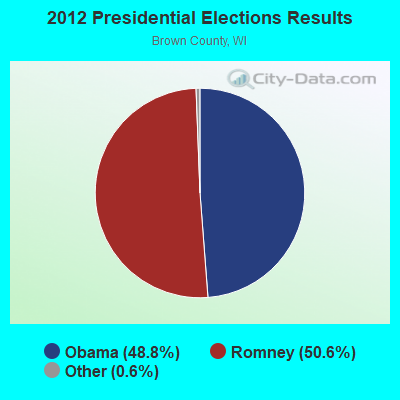
2012 Presidential Elections Results (%) - Democratic Party (Obama)
2012 Presidential Elections Results (%) - Republican Party (Romney)
2012 Presidential Elections Results (%) - Other
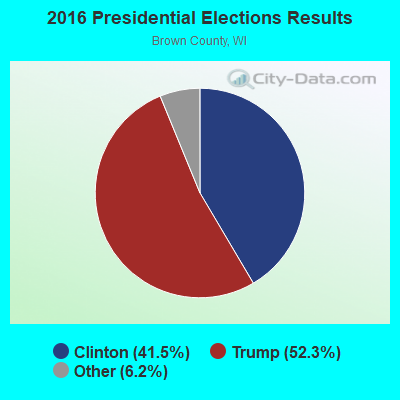
2016 Presidential Elections Results (%) - Democratic Party (Clinton)
2016 Presidential Elections Results (%) - Republican Party (Trump)
2016 Presidential Elections Results (%) - Other
2020 Presidential Elections Results (%) - Democratic Party (Biden)
2020 Presidential Elections Results (%) - Republican Party (Trump)
2020 Presidential Elections Results (%) - Other
Ancestries Reported - Arab (%)
Ancestries Reported - Czech (%)
Ancestries Reported - Danish (%)
Ancestries Reported - Dutch (%)
Ancestries Reported - English (%)
Ancestries Reported - French (%)
Ancestries Reported - French Canadian (%)
Ancestries Reported - German (%)
Ancestries Reported - Greek (%)
Ancestries Reported - Hungarian (%)
Ancestries Reported - Irish (%)
Ancestries Reported - Italian (%)
Ancestries Reported - Lithuanian (%)
Ancestries Reported - Norwegian (%)
Ancestries Reported - Polish (%)
Ancestries Reported - Portuguese (%)
Ancestries Reported - Russian (%)
Ancestries Reported - Scotch-Irish (%)
Ancestries Reported - Scottish (%)
Ancestries Reported - Slovak (%)
Ancestries Reported - Subsaharan African (%)
Ancestries Reported - Swedish (%)
Ancestries Reported - Swiss (%)
Ancestries Reported - Ukrainian (%)
Ancestries Reported - United States (%)
Ancestries Reported - Welsh (%)
Ancestries Reported - West Indian (%)
Ancestries Reported - Other (%)
Educational Attainment - No schooling completed (%)
Educational Attainment - Less than high school (%)
Educational Attainment - High school or equivalent (%)
Educational Attainment - Less than 1 year of college (%)
Educational Attainment - 1 or more years of college (%)
Educational Attainment - Associate degree (%)
Educational Attainment - Bachelor's degree (%)
Educational Attainment - Master's degree (%)
Educational Attainment - Professional school degree (%)
Educational Attainment - Doctorate degree (%)
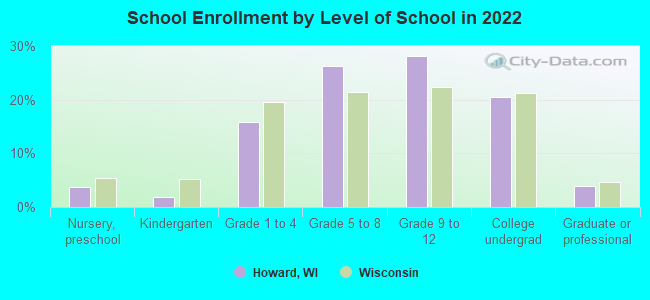
School Enrollment - Nursery, preschool (%)
School Enrollment - Kindergarten (%)
School Enrollment - Grade 1 to 4 (%)
School Enrollment - Grade 5 to 8 (%)
School Enrollment - Grade 9 to 12 (%)
School Enrollment - College undergrad (%)
School Enrollment - Graduate or professional (%)
School Enrollment - Not enrolled in school (%)
School enrollment - Public schools (%)
School enrollment - Private schools (%)
School enrollment - Not enrolled (%)
Median number of rooms in houses and condos
Median number of rooms in apartments
Housing units lacking complete plumbing facilities (%)
Housing units lacking complete kitchen facilities (%)
Density of houses
Urban houses (%)
Rural houses (%)
Households with people 60 years and over (%)
Households with people 65 years and over (%)
Households with people 75 years and over (%)
Households with one or more nonrelatives (%)
Households with no nonrelatives (%)
Population in households (%)
Family households (%)
Nonfamily households (%)
Population in families (%)
Family households with own children (%)
Median number of bedrooms in owner occupied houses
Mean number of bedrooms in owner occupied houses
Median number of bedrooms in renter occupied houses
Mean number of bedrooms in renter occupied houses
Median number of vehichles in owner occupied houses
Mean number of vehichles in owner occupied houses
Median number of vehichles in renter occupied houses
Mean number of vehichles in renter occupied houses
Mortgage status - with mortgage (%)
Mortgage status - with second mortgage (%)
Mortgage status - with home equity loan (%)
Mortgage status - with both second mortgage and home equity loan (%)
Mortgage status - without a mortgage (%)
Average family size
Average family size - White
Average family size - Black or African American
Average family size - Asian
Average family size - Hispanic or Latino
Average family size - American Indian and Alaska Native
Average family size - Multirace
Average family size - Other Race
Geographical mobility - Same house 1 year ago (%)
Geographical mobility - Moved within same county (%)
Geographical mobility - Moved from different county within same state (%)
Geographical mobility - Moved from different state (%)
Geographical mobility - Moved from abroad (%)
Place of birth - Born in state of residence (%)
Place of birth - Born in other state (%)
Place of birth - Native, outside of US (%)
Place of birth - Foreign born (%)
Housing units in structures - 1, detached (%)
Housing units in structures - 1, attached (%)
Housing units in structures - 2 (%)
Housing units in structures - 3 or 4 (%)
Housing units in structures - 5 to 9 (%)
Housing units in structures - 10 to 19 (%)
Housing units in structures - 20 to 49 (%)
Housing units in structures - 50 or more (%)
Housing units in structures - Mobile home (%)
Housing units in structures - Boat, RV, van, etc. (%)
House/condo owner moved in on average (years ago)
Renter moved in on average (years ago)
Year householder moved into unit - Moved in 1999 to March 2000 (%)
Year householder moved into unit - Moved in 1995 to 1998 (%)
Year householder moved into unit - Moved in 1990 to 1994 (%)
Year householder moved into unit - Moved in 1980 to 1989 (%)
Year householder moved into unit - Moved in 1970 to 1979 (%)
Year householder moved into unit - Moved in 1969 or earlier (%)
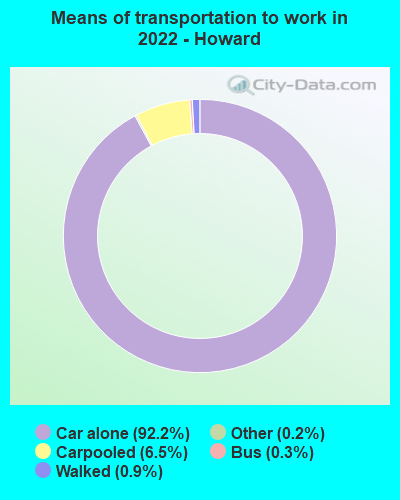
Means of transportation to work - Drove car alone (%)
Means of transportation to work - Carpooled (%)
Means of transportation to work - Public transportation (%)
Means of transportation to work - Bus or trolley bus (%)
Means of transportation to work - Streetcar or trolley car (%)
Means of transportation to work - Subway or elevated (%)
Means of transportation to work - Railroad (%)
Means of transportation to work - Ferryboat (%)
Means of transportation to work - Taxicab (%)
Means of transportation to work - Motorcycle (%)
Means of transportation to work - Bicycle (%)
Means of transportation to work - Walked (%)
Means of transportation to work - Other means (%)
Working at home (%)
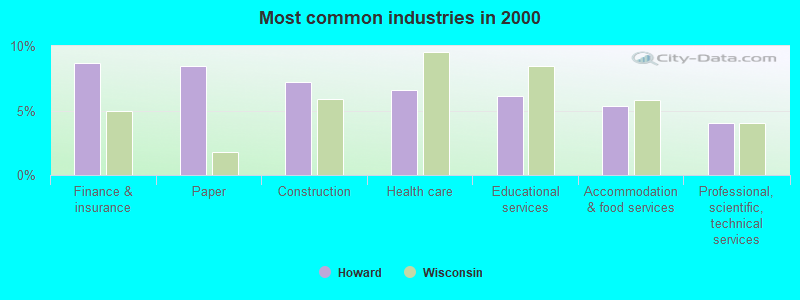
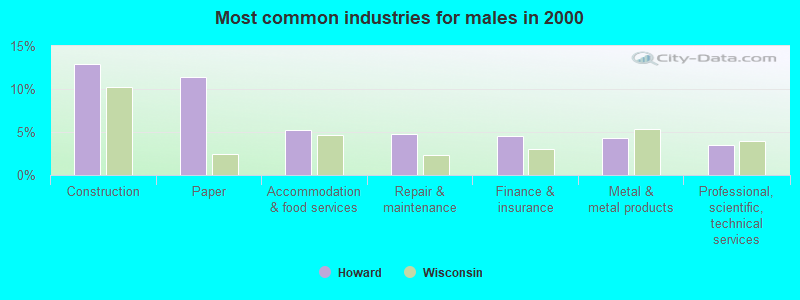
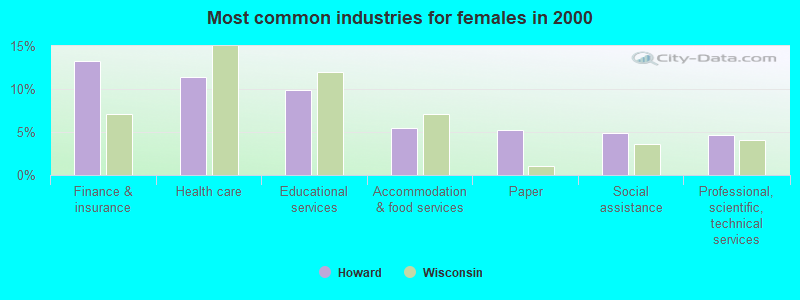
Industry diversity
Most Common Industries - Agriculture, forestry, fishing and hunting, and mining (%)
Most Common Industries - Agriculture, forestry, fishing and hunting (%)
Most Common Industries - Mining, quarrying, and oil and gas extraction (%)
Most Common Industries - Construction (%)
Most Common Industries - Manufacturing (%)
Most Common Industries - Wholesale trade (%)
Most Common Industries - Retail trade (%)
Most Common Industries - Transportation and warehousing, and utilities (%)
Most Common Industries - Transportation and warehousing (%)
Most Common Industries - Utilities (%)
Most Common Industries - Information (%)
Most Common Industries - Finance and insurance, and real estate and rental and leasing (%)
Most Common Industries - Finance and insurance (%)
Most Common Industries - Real estate and rental and leasing (%)
Most Common Industries - Professional, scientific, and management, and administrative and waste management services (%)
Most Common Industries - Professional, scientific, and technical services (%)
Most Common Industries - Management of companies and enterprises (%)
Most Common Industries - Administrative and support and waste management services (%)
Most Common Industries - Educational services, and health care and social assistance (%)
Most Common Industries - Educational services (%)
Most Common Industries - Health care and social assistance (%)
Most Common Industries - Arts, entertainment, and recreation, and accommodation and food services (%)
Most Common Industries - Arts, entertainment, and recreation (%)
Most Common Industries - Accommodation and food services (%)
Most Common Industries - Other services, except public administration (%)
Most Common Industries - Public administration (%)
Occupation diversity
Most Common Occupations - Management, business, science, and arts occupations (%)
Most Common Occupations - Management, business, and financial occupations (%)
Most Common Occupations - Management occupations (%)
Most Common Occupations - Business and financial operations occupations (%)
Most Common Occupations - Computer, engineering, and science occupations (%)
Most Common Occupations - Computer and mathematical occupations (%)
Most Common Occupations - Architecture and engineering occupations (%)
Most Common Occupations - Life, physical, and social science occupations (%)
Most Common Occupations - Education, legal, community service, arts, and media occupations (%)
Most Common Occupations - Community and social service occupations (%)
Most Common Occupations - Legal occupations (%)
Most Common Occupations - Education, training, and library occupations (%)
Most Common Occupations - Arts, design, entertainment, sports, and media occupations (%)
Most Common Occupations - Healthcare practitioners and technical occupations (%)
Most Common Occupations - Health diagnosing and treating practitioners and other technical occupations (%)
Most Common Occupations - Health technologists and technicians (%)
Most Common Occupations - Service occupations (%)
Most Common Occupations - Healthcare support occupations (%)
Most Common Occupations - Protective service occupations (%)
Most Common Occupations - Fire fighting and prevention, and other protective service workers including supervisors (%)
Most Common Occupations - Law enforcement workers including supervisors (%)
Most Common Occupations - Food preparation and serving related occupations (%)
Most Common Occupations - Building and grounds cleaning and maintenance occupations (%)
Most Common Occupations - Personal care and service occupations (%)
Most Common Occupations - Sales and office occupations (%)
Most Common Occupations - Sales and related occupations (%)
Most Common Occupations - Office and administrative support occupations (%)
Most Common Occupations - Natural resources, construction, and maintenance occupations (%)
Most Common Occupations - Farming, fishing, and forestry occupations (%)
Most Common Occupations - Construction and extraction occupations (%)
Most Common Occupations - Installation, maintenance, and repair occupations (%)
Most Common Occupations - Production, transportation, and material moving occupations (%)
Most Common Occupations - Production occupations (%)
Most Common Occupations - Transportation occupations (%)
Most Common Occupations - Material moving occupations (%)
People in Group quarters - Institutionalized population (%)
People in Group quarters - Correctional institutions (%)
People in Group quarters - Federal prisons and detention centers (%)
People in Group quarters - Halfway houses (%)
People in Group quarters - Local jails and other confinement facilities (including police lockups) (%)
People in Group quarters - Military disciplinary barracks (%)
People in Group quarters - State prisons (%)
People in Group quarters - Other types of correctional institutions (%)
People in Group quarters - Nursing homes (%)
People in Group quarters - Hospitals/wards, hospices, and schools for the handicapped (%)
People in Group quarters - Hospitals/wards and hospices for chronically ill (%)
People in Group quarters - Hospices or homes for chronically ill (%)
People in Group quarters - Military hospitals or wards for chronically ill (%)
People in Group quarters - Other hospitals or wards for chronically ill (%)
People in Group quarters - Hospitals or wards for drug/alcohol abuse (%)
People in Group quarters - Mental (Psychiatric) hospitals or wards (%)
People in Group quarters - Schools, hospitals, or wards for the mentally retarded (%)
People in Group quarters - Schools, hospitals, or wards for the physically handicapped (%)
People in Group quarters - Institutions for the deaf (%)
People in Group quarters - Institutions for the blind (%)
People in Group quarters - Orthopedic wards and institutions for the physically handicapped (%)
People in Group quarters - Wards in general hospitals for patients who have no usual home elsewhere (%)
People in Group quarters - Wards in military hospitals for patients who have no usual home elsewhere (%)
People in Group quarters - Juvenile institutions (%)
People in Group quarters - Long-term care (%)
People in Group quarters - Homes for abused, dependent, and neglected children (%)
People in Group quarters - Residential treatment centers for emotionally disturbed children (%)
People in Group quarters - Training schools for juvenile delinquents (%)
People in Group quarters - Short-term care, detention or diagnostic centers for delinquent children (%)
People in Group quarters - Type of juvenile institution unknown (%)
People in Group quarters - Noninstitutionalized population (%)
People in Group quarters - College dormitories (includes college quarters off campus) (%)
People in Group quarters - Military quarters (%)
People in Group quarters - On base (%)
People in Group quarters - Barracks, unaccompanied personnel housing (UPH), (Enlisted/Officer), ;and similar group living quarters for military personnel (%)
People in Group quarters - Transient quarters for temporary residents (%)
People in Group quarters - Military ships (%)
People in Group quarters - Group homes (%)
People in Group quarters - Homes or halfway houses for drug/alcohol abuse (%)
People in Group quarters - Homes for the mentally ill (%)
People in Group quarters - Homes for the mentally retarded (%)
People in Group quarters - Homes for the physically handicapped (%)
People in Group quarters - Other group homes (%)
People in Group quarters - Religious group quarters (%)
People in Group quarters - Dormitories (%)
People in Group quarters - Agriculture workers' dormitories on farms (%)
People in Group quarters - Job Corps and vocational training facilities (%)
People in Group quarters - Other workers' dormitories (%)
People in Group quarters - Crews of maritime vessels (%)
People in Group quarters - Other nonhousehold living situations (%)
People in Group quarters - Other noninstitutional group quarters (%)
Residents speaking English at home (%)
Residents speaking English at home - Born in the United States (%)
Residents speaking English at home - Native, born elsewhere (%)
Residents speaking English at home - Foreign born (%)
Residents speaking Spanish at home (%)
Residents speaking Spanish at home - Born in the United States (%)
Residents speaking Spanish at home - Native, born elsewhere (%)
Residents speaking Spanish at home - Foreign born (%)
Residents speaking other language at home (%)
Residents speaking other language at home - Born in the United States (%)
Residents speaking other language at home - Native, born elsewhere (%)
Residents speaking other language at home - Foreign born (%)
Class of Workers - Employee of private company (%)
Class of Workers - Self-employed in own incorporated business (%)
Class of Workers - Private not-for-profit wage and salary workers (%)
Class of Workers - Local government workers (%)
Class of Workers - State government workers (%)
Class of Workers - Federal government workers (%)
Class of Workers - Self-employed workers in own not incorporated business and Unpaid family workers (%)
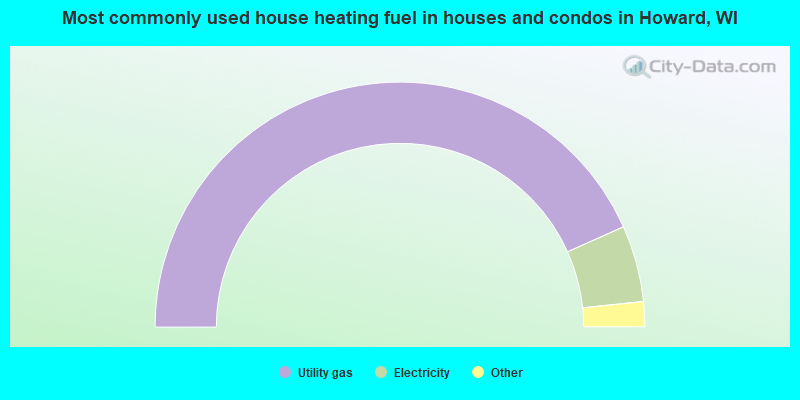
House heating fuel used in houses and condos - Utility gas (%)
House heating fuel used in houses and condos - Bottled, tank, or LP gas (%)
House heating fuel used in houses and condos - Electricity (%)
House heating fuel used in houses and condos - Fuel oil, kerosene, etc. (%)
House heating fuel used in houses and condos - Coal or coke (%)
House heating fuel used in houses and condos - Wood (%)
House heating fuel used in houses and condos - Solar energy (%)
House heating fuel used in houses and condos - Other fuel (%)
House heating fuel used in houses and condos - No fuel used (%)
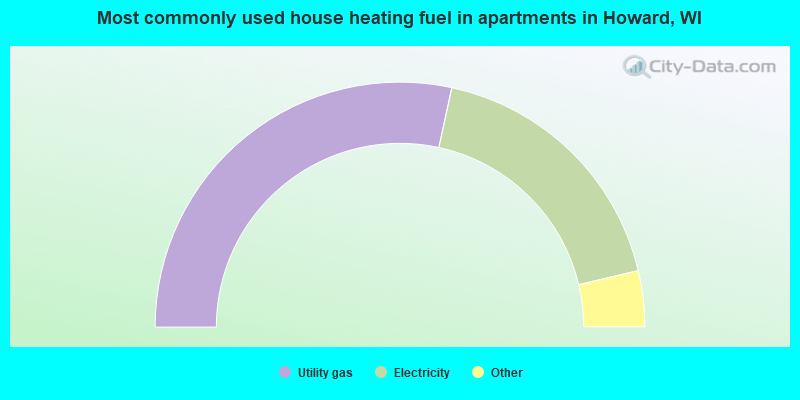
House heating fuel used in apartments - Utility gas (%)
House heating fuel used in apartments - Bottled, tank, or LP gas (%)
House heating fuel used in apartments - Electricity (%)
House heating fuel used in apartments - Fuel oil, kerosene, etc. (%)
House heating fuel used in apartments - Coal or coke (%)
House heating fuel used in apartments - Wood (%)
House heating fuel used in apartments - Solar energy (%)
House heating fuel used in apartments - Other fuel (%)
House heating fuel used in apartments - No fuel used (%)
Armed forces status - In Armed Forces (%)
Armed forces status - Civilian (%)
Armed forces status - Civilian - Veteran (%)
Armed forces status - Civilian - Nonveteran (%)
Fatal accidents locations in years 2005-2021
Fatal accidents locations in 2005
Fatal accidents locations in 2006
Fatal accidents locations in 2007
Fatal accidents locations in 2008
Fatal accidents locations in 2009
Fatal accidents locations in 2010
Fatal accidents locations in 2011
Fatal accidents locations in 2012
Fatal accidents locations in 2013
Fatal accidents locations in 2014
Fatal accidents locations in 2015
Fatal accidents locations in 2016
Fatal accidents locations in 2017
Fatal accidents locations in 2018
Fatal accidents locations in 2019
Fatal accidents locations in 2020
Fatal accidents locations in 2021
Alcohol use - People drinking some alcohol every month (%)
Alcohol use - People not drinking at all (%)
Alcohol use - Average days/month drinking alcohol
Alcohol use - Average drinks/week
Alcohol use - Average days/year people drink much
Audiometry - Average condition of hearing (%)
Audiometry - People that can hear a whisper from across a quiet room (%)
Audiometry - People that can hear normal voice from across a quiet room (%)
Audiometry - Ears ringing, roaring, buzzing (%)
Audiometry - Had a job exposure to loud noise (%)
Audiometry - Had off-work exposure to loud noise (%)
Blood Pressure & Cholesterol - Has high blood pressure (%)
Blood Pressure & Cholesterol - Checking blood pressure at home (%)
Blood Pressure & Cholesterol - Frequently checking blood cholesterol (%)
Blood Pressure & Cholesterol - Has high cholesterol level (%)
Consumer Behavior - Money monthly spent on food at supermarket/grocery store
Consumer Behavior - Money monthly spent on food at other stores
Consumer Behavior - Money monthly spent on eating out
Consumer Behavior - Money monthly spent on carryout/delivered foods
Consumer Behavior - Income spent on food at supermarket/grocery store (%)
Consumer Behavior - Income spent on food at other stores (%)
Consumer Behavior - Income spent on eating out (%)
Consumer Behavior - Income spent on carryout/delivered foods (%)
Current Health Status - General health condition (%)
Current Health Status - Blood donors (%)
Current Health Status - Has blood ever tested for HIV virus (%)
Current Health Status - Left-handed people (%)
Dermatology - People using sunscreen (%)
Diabetes - Diabetics (%)
Diabetes - Had a blood test for high blood sugar (%)
Diabetes - People taking insulin (%)
Diet Behavior & Nutrition - Diet health (%)
Diet Behavior & Nutrition - Milk product consumption (# of products/month)
Diet Behavior & Nutrition - Meals not home prepared (#/week)
Diet Behavior & Nutrition - Meals from fast food or pizza place (#/week)
Diet Behavior & Nutrition - Ready-to-eat foods (#/month)
Diet Behavior & Nutrition - Frozen meals/pizza (#/month)
Drug Use - People that ever used marijuana or hashish (%)
Drug Use - Ever used hard drugs (%)
Drug Use - Ever used any form of cocaine (%)
Drug Use - Ever used heroin (%)
Drug Use - Ever used methamphetamine (%)
Health Insurance - People covered by health insurance (%)
Kidney Conditions-Urology - Avg. # of times urinating at night
Medical Conditions - People with asthma (%)
Medical Conditions - People with anemia (%)
Medical Conditions - People with psoriasis (%)
Medical Conditions - People with overweight (%)
Medical Conditions - Elderly people having difficulties in thinking or remembering (%)
Medical Conditions - People who ever received blood transfusion (%)
Medical Conditions - People having trouble seeing even with glass/contacts (%)
Medical Conditions - People with arthritis (%)
Medical Conditions - People with gout (%)
Medical Conditions - People with congestive heart failure (%)
Medical Conditions - People with coronary heart disease (%)
Medical Conditions - People with angina pectoris (%)
Medical Conditions - People who ever had heart attack (%)
Medical Conditions - People who ever had stroke (%)
Medical Conditions - People with emphysema (%)
Medical Conditions - People with thyroid problem (%)
Medical Conditions - People with chronic bronchitis (%)
Medical Conditions - People with any liver condition (%)
Medical Conditions - People who ever had cancer or malignancy (%)
Mental Health - People who have little interest in doing things (%)
Mental Health - People feeling down, depressed, or hopeless (%)
Mental Health - People who have trouble sleeping or sleeping too much (%)
Mental Health - People feeling tired or having little energy (%)
Mental Health - People with poor appetite or overeating (%)
Mental Health - People feeling bad about themself (%)
Mental Health - People who have trouble concentrating on things (%)
Mental Health - People moving or speaking slowly or too fast (%)
Mental Health - People having thoughts they would be better off dead (%)
Oral Health - Average years since last visit a dentist
Oral Health - People embarrassed because of mouth (%)
Oral Health - People with gum disease (%)
Oral Health - General health of teeth and gums (%)
Oral Health - Average days a week using dental floss/device
Oral Health - Average days a week using mouthwash for dental problem
Oral Health - Average number of teeth
Pesticide Use - Households using pesticides to control insects (%)
Pesticide Use - Households using pesticides to kill weeds (%)
Physical Activity - People doing vigorous-intensity work activities (%)
Physical Activity - People doing moderate-intensity work activities (%)
Physical Activity - People walking or bicycling (%)
Physical Activity - People doing vigorous-intensity recreational activities (%)
Physical Activity - People doing moderate-intensity recreational activities (%)
Physical Activity - Average hours a day doing sedentary activities
Physical Activity - Average hours a day watching TV or videos
Physical Activity - Average hours a day using computer
Physical Functioning - People having limitations keeping them from working (%)
Physical Functioning - People limited in amount of work they can do (%)
Physical Functioning - People that need special equipment to walk (%)
Physical Functioning - People experiencing confusion/memory problems (%)
Physical Functioning - People requiring special healthcare equipment (%)
Prescription Medications - Average number of prescription medicines taking
Preventive Aspirin Use - Adults 40+ taking low-dose aspirin (%)
Reproductive Health - Vaginal deliveries (%)
Reproductive Health - Cesarean deliveries (%)
Reproductive Health - Deliveries resulted in a live birth (%)
Reproductive Health - Pregnancies resulted in a delivery (%)
Reproductive Health - Women breastfeeding newborns (%)
Reproductive Health - Women that had a hysterectomy (%)
Reproductive Health - Women that had both ovaries removed (%)
Reproductive Health - Women that have ever taken birth control pills (%)
Reproductive Health - Women taking birth control pills (%)
Reproductive Health - Women that have ever used Depo-Provera or injectables (%)
Reproductive Health - Women that have ever used female hormones (%)
Sexual Behavior - People 18+ that ever had sex (vaginal, anal, or oral) (%)
Sexual Behavior - Males 18+ that ever had vaginal sex with a woman (%)
Sexual Behavior - Males 18+ that ever performed oral sex on a woman (%)
Sexual Behavior - Males 18+ that ever had anal sex with a woman (%)
Sexual Behavior - Males 18+ that ever had any sex with a man (%)
Sexual Behavior - Females 18+ that ever had vaginal sex with a man (%)
Sexual Behavior - Females 18+ that ever performed oral sex on a man (%)
Sexual Behavior - Females 18+ that ever had anal sex with a man (%)
Sexual Behavior - Females 18+ that ever had any kind of sex with a woman (%)
Sexual Behavior - Average age people first had sex
Sexual Behavior - Average number of female sex partners in lifetime (males 18+)
Sexual Behavior - Average number of female vaginal sex partners in lifetime (males 18+)
Sexual Behavior - Average age people first performed oral sex on a woman (18+)
Sexual Behavior - Average number of woman performed oral sex on in lifetime (18+)
Sexual Behavior - Average number of male sex partners in lifetime (males 18+)
Sexual Behavior - Average number of male anal sex partners in lifetime (males 18+)
Sexual Behavior - Average age people first performed oral sex on a man (18+)
Sexual Behavior - Average number of male oral sex partners in lifetime (18+)
Sexual Behavior - People using protection when performing oral sex (%)
Sexual Behavior - Average number of times people have vaginal or anal sex a year
Sexual Behavior - People having sex without condom (%)
Sexual Behavior - Average number of male sex partners in lifetime (females 18+)
Sexual Behavior - Average number of male vaginal sex partners in lifetime (females 18+)
Sexual Behavior - Average number of female sex partners in lifetime (females 18+)
Sexual Behavior - Circumcised males 18+ (%)
Sleep Disorders - Average hours sleeping at night
Sleep Disorders - People that has trouble sleeping (%)
Smoking-Cigarette Use - People smoking cigarettes (%)
Taste & Smell - People 40+ having problems with smell (%)
Taste & Smell - People 40+ having problems with taste (%)
Taste & Smell - People 40+ that ever had wisdom teeth removed (%)
Taste & Smell - People 40+ that ever had tonsils teeth removed (%)
Taste & Smell - People 40+ that ever had a loss of consciousness because of a head injury (%)
Taste & Smell - People 40+ that ever had a broken nose or other serious injury to face or skull (%)
Taste & Smell - People 40+ that ever had two or more sinus infections (%)
Weight - Average height (inches)
Weight - Average weight (pounds)
Weight - Average BMI
Weight - People that are obese (%)
Weight - People that ever were obese (%)
Weight - People trying to lose weight (%)
According to our research of Wisconsin and other state lists, there were 4 registered sex offenders living in Howard, Wisconsin as of May 08, 2024 . The ratio of all residents to sex offenders in Howard is 4,807 to 1.The ratio of registered sex offenders to all residents in this city is much lower than the state average.
Latest news from Howard, WI collected exclusively by city-data.com from local newspapers, TV, and radio stations
Ancestries: German (35.3%), American (9.4%), Polish (8.9%), Irish (4.8%), Eastern European (3.8%), Norwegian (3.2%).
Current Local Time:
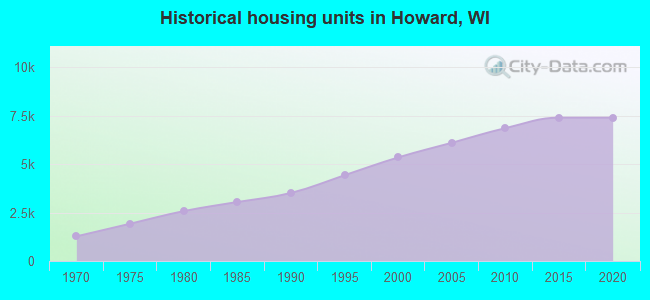
Land area: 18.0 square miles.
Population density: 1,138 people per square mile (low).
435 residents are foreign born (0.6% Europe , 0.6% Asia , 0.5% North America , 0.4% Latin America ).
This village:
2.2%Wisconsin:
5.0%
Median real estate property taxes paid for housing units with mortgages in 2022: $3,598 (1.1%)Median real estate property taxes paid for housing units with no mortgage in 2022: $3,389 (1.2%)
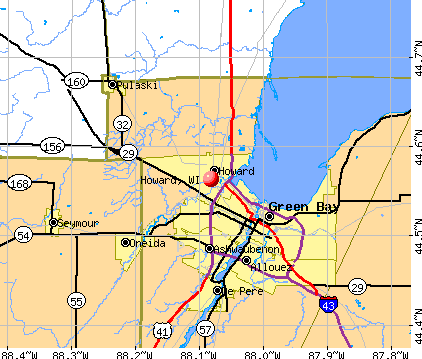
Nearest city with pop. 50,000+: Green Bay, WI
Nearest city with pop. 200,000+: Milwaukee, WI
Nearest city with pop. 1,000,000+: Chicago, IL
Nearest cities:
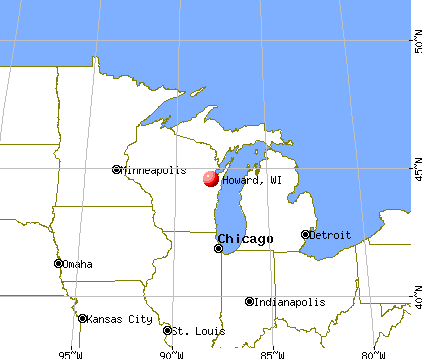
Latitude: 44.56 N, Longitude: 88.08 W
Daytime population change due to commuting: -1,403 (-7.0%)Workers who live and work in this village: 2,466 (23.0%)
Area code commonly used in this area: 920
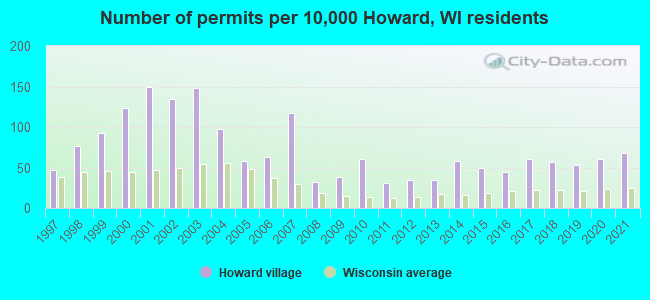
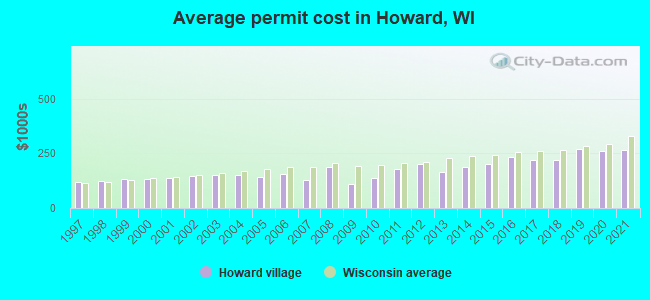
Single-family new house construction building permits:
2021: 92 buildings , average cost: $263,6002020: 83 buildings , average cost: $261,3002019: 72 buildings , average cost: $270,7002018: 77 buildings , average cost: $221,9002017: 83 buildings , average cost: $219,6002016: 61 buildings , average cost: $233,1002015: 68 buildings , average cost: $202,9002014: 78 buildings , average cost: $186,1002013: 48 buildings , average cost: $165,7002012: 48 buildings , average cost: $201,1002011: 42 buildings , average cost: $179,2002010: 81 buildings , average cost: $139,0002009: 51 buildings , average cost: $112,4002008: 43 buildings , average cost: $188,9002007: 158 buildings , average cost: $128,0002006: 86 buildings , average cost: $155,2002005: 79 buildings , average cost: $144,0002004: 133 buildings , average cost: $152,1002003: 200 buildings , average cost: $148,9002002: 181 buildings , average cost: $146,8002001: 202 buildings , average cost: $136,1002000: 166 buildings , average cost: $133,5001999: 124 buildings , average cost: $133,6001998: 103 buildings , average cost: $125,5001997: 63 buildings , average cost: $116,600Unemployment in December 2023:
Population change in the 1990s: +3,527 (+35.2%).
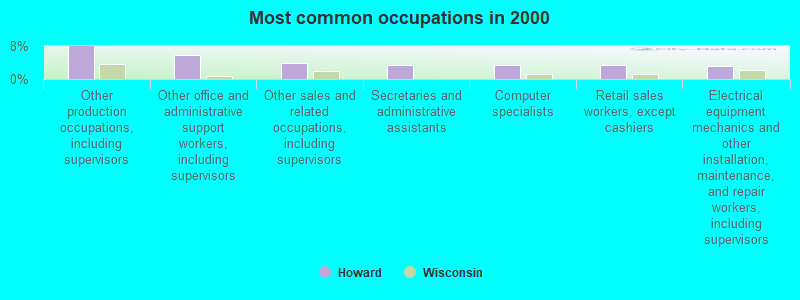
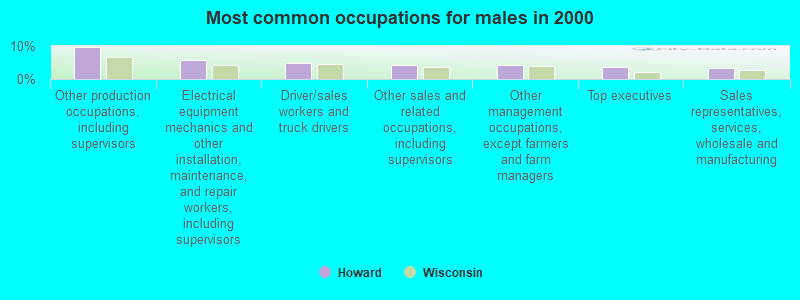
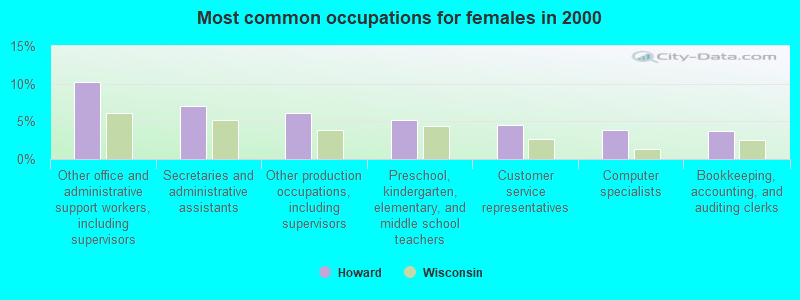
Most common occupations in Howard, WI (%)
Both Males Females
Other production occupations, including supervisors (7.9%)
Other office and administrative support workers, including supervisors (5.8%)
Other sales and related occupations, including supervisors (3.9%)
Secretaries and administrative assistants (3.5%)
Computer specialists (3.3%)
Retail sales workers, except cashiers (3.3%)
Electrical equipment mechanics and other installation, maintenance, and repair workers, including supervisors (3.2%)
Other production occupations, including supervisors (9.6%)
Electrical equipment mechanics and other installation, maintenance, and repair workers, including supervisors (5.9%)
Driver/sales workers and truck drivers (4.8%)
Other sales and related occupations, including supervisors (4.3%)
Other management occupations, except farmers and farm managers (4.1%)
Top executives (3.7%)
Sales representatives, services, wholesale and manufacturing (3.4%)
Other office and administrative support workers, including supervisors (10.2%)
Secretaries and administrative assistants (7.0%)
Other production occupations, including supervisors (6.0%)
Preschool, kindergarten, elementary, and middle school teachers (5.1%)
Customer service representatives (4.5%)
Computer specialists (3.9%)
Bookkeeping, accounting, and auditing clerks (3.7%)
Tornado activity:
Howard-area historical tornado activity is slightly below Wisconsin state average. It is 9% smaller than the overall U.S. average.
On 4/27/1984, a category F4 (max. wind speeds 207-260 mph) tornado 13.3 miles away from the Howard village center killed one person and injured 19 people and caused between $500,000 and $5,000,000 in damages.
On 7/5/1994, a category F4 tornado 22.8 miles away from the village center injured 2 people and caused between $500,000 and $5,000,000 in damages.
Earthquake activity:
Howard-area historical earthquake activity is significantly above Wisconsin state average. It is 24% smaller than the overall U.S. average. On 5/2/2015 at 16:23:07, a magnitude 4.2 (4.2 MW, Depth: 2.8 mi, Class: Light, Intensity: IV - V) earthquake occurred 209.0 miles away from Howard center On 4/18/2008 at 09:36:59, a magnitude 5.4 (5.1 MB, 4.8 MS, 5.4 MW, 5.2 MW, Class: Moderate, Intensity: VI - VII) earthquake occurred 422.8 miles away from Howard center On 6/28/2004 at 06:10:52, a magnitude 4.2 (4.2 MW, Depth: 6.2 mi) earthquake occurred 218.6 miles away from the city center On 6/10/1987 at 23:48:54, a magnitude 5.1 (4.9 MB, 4.4 MS, 4.6 MS, 5.1 LG) earthquake occurred 397.3 miles away from the city center On 2/10/2010 at 09:59:35, a magnitude 3.8 (3.8 MW, Depth: 6.2 mi, Class: Light, Intensity: II - III) earthquake occurred 180.6 miles away from the city center On 4/18/2008 at 09:36:59, a magnitude 5.2 (5.2 MW, Depth: 8.9 mi) earthquake occurred 422.8 miles away from Howard center Magnitude types: regional Lg-wave magnitude (LG), body-wave magnitude (MB), surface-wave magnitude (MS), moment magnitude (MW) Natural disasters: The number of natural disasters in Brown County (7) is smaller than the US average (15).Major Disasters (Presidential) Declared: 5Emergencies Declared: 2Floods: 4, Storms: 4, Tornadoes: 2, Drought: 1, Hurricane: 1, Other: 1 (Note: some incidents may be assigned to more than one category). Hospitals and medical centers near Howard: ST MARYS HSPTL MED CTR (about 3 miles away; GREEN BAY, WI)
AMERICANA NURSING CENTER-WEST (Nursing Home, about 3 miles away; GREEN BAY, WI)
GOLDEN LIVINGCENTER-VILLAGE GARDENS (Nursing Home, about 3 miles away; GREEN BAY, WI)
MANORCARE HEALTH SERVICES-WEST (Nursing Home, about 3 miles away; GREEN BAY, WI)
DAVITA - TITLE TOWN (Dialysis Facility, about 3 miles away; GREEN BAY, WI)
GRANCARE NURSING CENTER (Nursing Home, about 3 miles away; GREEN BAY, WI)
SOUTHERNCARE GREEN BAY (Hospital, about 3 miles away; GREEN BAY, WI)
Amtrak station near Howard: 6 miles: GREEN BAY (800 CEDAR ST.) - Bus Station Services: enclosed waiting area.
Colleges/universities with over 2000 students nearest to Howard:
Northeast Wisconsin Technical College (about 3 miles; Green Bay, WI ; Full-time enrollment: 6,069)
Saint Norbert College (about 9 miles; De Pere, WI ; FT enrollment: 2,324)
University of Wisconsin-Green Bay (about 9 miles; Green Bay, WI ; FT enrollment: 5,415)
Lawrence University (about 27 miles; Appleton, WI ; FT enrollment: 2,821)
Fox Valley Technical College (about 27 miles; Appleton, WI ; FT enrollment: 5,682)
University of Wisconsin-Oshkosh (about 44 miles; Oshkosh, WI ; FT enrollment: 10,637)
Lakeland College (about 51 miles; Plymouth, WI ; FT enrollment: 2,395)
Birthplace of: Gerhard Melvin Dahl - Lawyer, Carl Zoll - Football guard, E. F. Brunette - Politician, Martin Zoll - Football guard, William Emery Merrill - Union Army officer.
Brown County has a predicted average indoor radon screening level between 2 and 4 pCi/L (pico curies per liter) - Moderate Potential Average household size: This village:
2.5 peopleWisconsin:
2.4 people
Percentage of family households: This village:
68.6%Whole state:
64.4%
Percentage of households with unmarried partners: This village:
8.4%Whole state:
7.3%
Likely homosexual households (counted as self-reported same-sex unmarried-partner households)
Lesbian couples: 0.4% of all households Gay men: 0.2% of all households
People in group quarters in Howard in 2010:
28 people in group homes intended for adults
19 people in nursing facilities/skilled-nursing facilities
14 people in other noninstitutional facilities
8 people in workers' group living quarters and job corps centers
People in group quarters in Howard in 2000:
29 people in other noninstitutional group quarters
19 people in religious group quarters
10 people in other group homes
7 people in homes for the physically handicapped
4 people in homes for the mentally ill
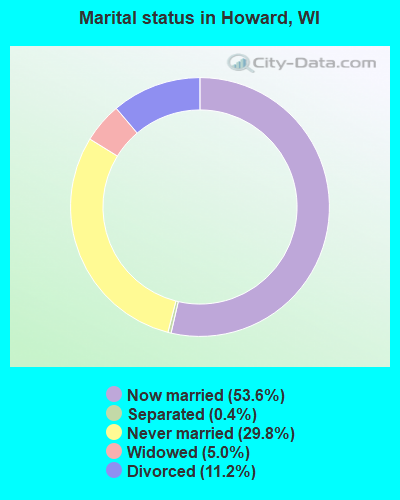
For population 15 years and over in Howard:
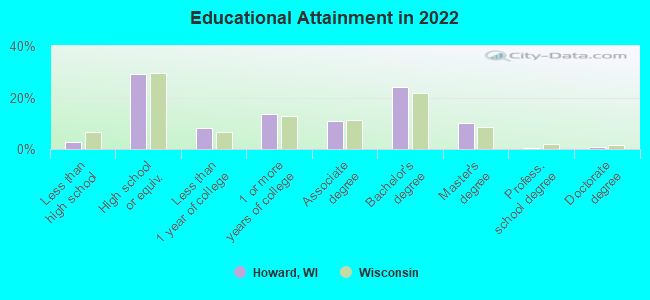
Never married: 29.8%Now married: 53.6%Separated: 0.4%Widowed: 5.0%Divorced: 11.2% For population 25 years and over in Howard:
High school or higher: 97.4%Bachelor's degree or higher: 34.7%Graduate or professional degree: 10.0%Unemployed: 3.1%Mean travel time to work (commute): 18.9 minutes
Education Gini index (Inequality in education) Here:
9.0Wisconsin average:
10.4
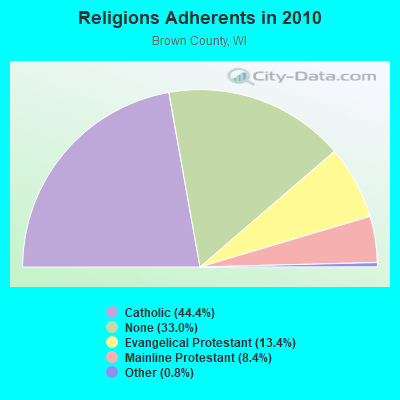
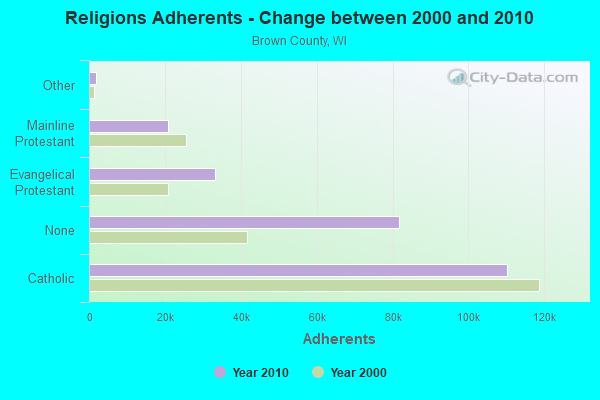
Religion statistics for Howard, WI (based on Brown County data)
Religion Adherents Congregations Catholic 110,123 35 Evangelical Protestant 33,156 79 Mainline Protestant 20,941 40 Other 1,913 12 Orthodox 100 1 None 81,774 -
Source: Clifford Grammich, Kirk Hadaway, Richard Houseal, Dale E.Jones, Alexei Krindatch, Richie Stanley and Richard H.Taylor. 2012. 2010 U.S.Religion Census: Religious Congregations & Membership Study. Association of Statisticians of American Religious Bodies. Jones, Dale E., et al. 2002. Congregations and Membership in the United States 2000. Nashville, TN: Glenmary Research Center. Graphs represent county-level data
Food Environment Statistics: Number of grocery stores : 33Brown County :
1.36 / 10,000 pop.Wisconsin :
1.86 / 10,000 pop.
Number of supercenters and club stores : 3This county :
0.12 / 10,000 pop.Wisconsin :
0.11 / 10,000 pop.
Number of convenience stores (no gas) : 7This county :
0.29 / 10,000 pop.State :
0.38 / 10,000 pop.
Number of convenience stores (with gas) : 91Brown County :
3.74 / 10,000 pop.Wisconsin :
4.12 / 10,000 pop.
Number of full-service restaurants : 205This county :
8.43 / 10,000 pop.Wisconsin :
8.64 / 10,000 pop.
Adult diabetes rate : Brown County :
7.0%State :
7.6%
Adult obesity rate : Brown County :
26.7%State :
27.5%
Low-income preschool obesity rate : This county :
13.1%Wisconsin :
13.0%
Health and Nutrition:
Average overall health of teeth and gums : Howard:
53.0%Wisconsin:
46.6%
Average BMI : This city:
27.5Wisconsin:
28.7
People feeling badly about themselves : Howard:
19.5%Wisconsin:
21.4%
People not drinking alcohol at all : Howard:
7.8%Wisconsin:
10.2%
Average hours sleeping at night : Overweight people : Howard:
30.4%Wisconsin:
34.0%
General health condition : Howard:
61.5%Wisconsin:
56.3%
Average condition of hearing : More about Health and Nutrition of Howard, WI Residents
Local government employment and payroll (March 2022)
Function
Full-time employees
Monthly full-time payroll
Average yearly full-time wage
Part-time employees
Monthly part-time payroll
Streets and Highways
21 $132,142 $75,510 1 $416 Firefighters
6 $37,446 $74,892 32 $27,493 Housing and Community Development (Local)
5 $28,516 $68,438 0 $0 Financial Administration
4 $25,965 $77,895 0 $0 Other Government Administration
4 $27,351 $82,053 17 $12,940 Parks and Recreation
3 $18,746 $74,984 3 $686 Water Supply
3 $16,911 $67,644 0 $0 Natural Resources
1 $6,960 $83,520 0 $0 Sewerage
1 $5,111 $61,332 0 $0 Judicial and Legal
1 $4,349 $52,188 1 $1,312 Police - Other
0 $0 7 $2,812
Totals for Government
49 $303,494 $74,325 61 $45,659
Howard government finances - Expenditure in 2021 (per resident):
Construction - Regular Highways: $1,412,000 ($69.01)
Parks and Recreation: $432,000 ($21.11)Police Protection: $79,000 ($3.86)Local Fire Protection: $63,000 ($3.08)General - Other: $33,000 ($1.61)Current Operations - Water Utilities: $6,198,000 ($302.93)
Sewerage: $4,430,000 ($216.52)Regular Highways: $4,039,000 ($197.41)General - Other: $2,970,000 ($145.16)Police Protection: $1,879,000 ($91.84)Parks and Recreation: $1,092,000 ($53.37)Local Fire Protection: $1,073,000 ($52.44)Solid Waste Management: $840,000 ($41.06)Central Staff Services: $641,000 ($31.33)Financial Administration: $328,000 ($16.03)Protective Inspection and Regulation - Other: $184,000 ($8.99)Health - Other: $182,000 ($8.90)Judicial and Legal Services: $181,000 ($8.85)General Public Buildings: $79,000 ($3.86)General - Interest on Debt: $1,723,000 ($84.21)
Total Salaries and Wages: $4,220,000 ($206.26)
Howard government finances - Revenue in 2021 (per resident):
Charges - Sewerage: $4,634,000 ($226.49)
Other: $2,252,000 ($110.07)Regular Highways: $1,241,000 ($60.65)Housing and Community Development: $827,000 ($40.42)Parks and Recreation: $693,000 ($33.87)Solid Waste Management: $15,000 ($0.73)Natural Resources - Other: $6,000 ($0.29)Local Intergovernmental - Other: $234,000 ($11.44)
Highways: $18,000 ($0.88)Miscellaneous - General Revenue - Other: $930,000 ($45.45)
Special Assessments: $683,000 ($33.38)Rents: $185,000 ($9.04)Interest Earnings: $141,000 ($6.89)Sale of Property: $109,000 ($5.33)Fines and Forfeits: $103,000 ($5.03)Donations From Private Sources: $34,000 ($1.66)Revenue - Water Utilities: $5,654,000 ($276.34)
Transit Utilities: $90,000 ($4.40)State Intergovernmental - Highways: $1,114,000 ($54.45)
General Local Government Support: $1,079,000 ($52.74)Education: $299,000 ($14.61)Other: $200,000 ($9.78)Tax - Property: $8,849,000 ($432.50)
Other License: $461,000 ($22.53)Occupation and Business License - Other: $226,000 ($11.05)Other Selective Sales: $8,000 ($0.39)
Howard government finances - Debt in 2021 (per resident):
Long Term Debt - Outstanding Unspecified Public Purpose: $81,004,000 ($3959.14)
Beginning Outstanding - Unspecified Public Purpose: $76,383,000 ($3733.28)Issue, Unspecified Public Purpose: $21,967,000 ($1073.66)Retired Unspecified Public Purpose: $17,346,000 ($847.80)
Howard government finances - Cash and Securities in 2021 (per resident):
Bond Funds - Cash and Securities: $2,602,000 ($127.17)
Other Funds - Cash and Securities: $25,373,000 ($1240.13)
5.04% of this county's 2021 resident taxpayers lived in other counties in 2020 ($64,264 average adjusted gross income )
Here:
5.04%Wisconsin average:
6.07%
0.02% of residents moved from foreign countries ($156 average AGI )Brown County:
0.02%Wisconsin average:
0.00%
Top counties from which taxpayers relocated into this county between 2020 and 2021:
4.95% of this county's 2020 resident taxpayers moved to other counties in 2021 ($63,518 average adjusted gross income )
Here:
4.95%Wisconsin average:
6.10%
0.02% of residents moved to foreign countries ($127 average AGI )Brown County:
0.02%Wisconsin average:
0.00%
Top counties to which taxpayers relocated from this county between 2020 and 2021: Businesses in Howard, WI
Burger King: 1Dairy Queen: 1Jimmy John's: 1 Strongest AM radio stations in Howard:
WTAQ (1360 AM; 10 kW; GREEN BAY, WI; Owner: MIDWEST COMMUNICATIONS, INC.)
WNFL (1440 AM; 5 kW; GREEN BAY, WI; Owner: MIDWEST COMMUNICATIONS, INC.)
WNAM (1280 AM; 50 kW; NEENAH-MENASHA, WI; Owner: CUMULUS LICENSING CORP.)
WDUZ (1400 AM; 1 kW; GREEN BAY, WI; Owner: CUMULUS LICENSING CORP.)
WHBY (1150 AM; 25 kW; KIMBERLY, WI; Owner: WOODWARD COMMUNICATIONS, INC.)
WSPT (1010 AM; 50 kW; STEVENS POINT, WI)
WSAU (550 AM; 20 kW; WAUSAU, WI; Owner: WRIG, INC.)
WTMJ (620 AM; 50 kW; MILWAUKEE, WI; Owner: JOURNAL BROADCAST CORPORATION)
WTCM (580 AM; 35 kW; TRAVERSE CITY, MI; Owner: WTCM RADIO, INC.)
WCUB (980 AM; 5 kW; TWO RIVERS, WI; Owner: CUB RADIO, INC.)
WISN (1130 AM; 50 kW; MILWAUKEE, WI; Owner: CAPSTAR TX LIMITED PARTNERSHIP)
WLDR (1210 AM; daytime; 50 kW; KINGSLEY, MI; Owner: FORT BEND BROADCASTING COMPANY)
WFCL (1380 AM; 4 kW; CLINTONVILLE, WI; Owner: RESULTS BROADCASTING CORP.)
Strongest FM radio stations in Howard:
WQLH (98.5 FM; GREEN BAY, WI; Owner: CUMULUS LICENSING CORP.)
WEMY (91.5 FM; GREEN BAY, WI; Owner: EVANGEL MINISTRIES, INC)
WIXX (101.1 FM; GREEN BAY, WI; Owner: MIDWEST COMMUNICATIONS, INC.)
WPNE-FM (89.3 FM; GREEN BAY, WI; Owner: WISCONSIN EDUCATIONAL COMMUNICATIONS BOARD)
W270AJ (101.9 FM; GREEN BAY, WI; Owner: MIDWEST COMMUNICATIONS, INC)
WHID (88.1 FM; GREEN BAY, WI; Owner: BD OF REGENTS OF THE UNIV OF WI SYS)
WKSZ (95.9 FM; DE PERE, WI; Owner: WOODWARD COMMUNICATIONS INC)
WJLW (106.7 FM; ALLOUEZ, WI; Owner: CUMULUS LICENSING CORP)
WOGB (103.1 FM; KAUKAUNA, WI; Owner: CUMULUS LICENSING CORP.)
WXWX (107.5 FM; BRILLION, WI; Owner: CUMULUS LICENSING CORP.)
WORQ (90.1 FM; GREEN BAY, WI; Owner: LAKESHORE COMMUNICATIONS, INC.)
WAPL-FM (105.7 FM; APPLETON, WI; Owner: WOODWARD COMMUNICATIONS, INC.)
WECB (104.3 FM; SEYMOUR, WI; Owner: WOODWARD COMMUNICATIONS, INC.)
WLYD (99.7 FM; STURGEON BAY, WI; Owner: MIDWEST COMMUNICATIONS INC)
WRVM (102.7 FM; SURING, WI; Owner: WRVM, INC.)
WPCK (104.9 FM; KAUKAUNA, WI; Owner: MIDWEST DIMENSIONS, INC.)
WOZZ (93.5 FM; NEW LONDON, WI; Owner: MIDWEST COMMUNICATIONS, INC)
WBDK (96.7 FM; ALGOMA, WI; Owner: NICOLET BROADCASTING, INC.)
WOWN (99.3 FM; SHAWANO, WI; Owner: RESULTS BROADCASTING OF SHAWANO, INC.)
WNCY-FM (100.3 FM; NEENAH-MENASHA, WI; Owner: MIDWEST COMMUNICATIONS, INC.)
TV broadcast stations around Howard:
WBAY-TV (Channel 2; GREEN BAY, WI; Owner: YOUNG BROADCASTING OF GREEN BAY, INC.)
WPNE (Channel 38; GREEN BAY, WI; Owner: WISCONSIN EDUCATIONAL COMMUNICATIONS BOARD)
WIWB (Channel 14; SURING, WI; Owner: ACME TV LICENSES OF WISCONSIN, LLC)
WLUK-TV (Channel 11; GREEN BAY, WI; Owner: EMMIS TELEVISION LICENSE CORPORATION)
WFRV-TV (Channel 5; GREEN BAY, WI; Owner: CBS BROADCASTING INC.)
WGBA (Channel 26; GREEN BAY, WI; Owner: ARIES TELECOMMUNICATION CORPORATION)
WACY (Channel 32; APPLETON, WI; Owner: ACE TV, INC.)
W49CB (Channel 49; GREEN BAY, WI; Owner: TRINITY BROADCASTING NETWORK)
W30BU (Channel 30; GREEN BAY, WI; Owner: THREE ANGELS BROADCASTING NETWORK)
WMMF-TV (Channel 68; FOND DU LAC, WI; Owner: PAPPAS TELECASTING OF WISCONSIN, A CALIFORNIA LTD PARTNRSHP)
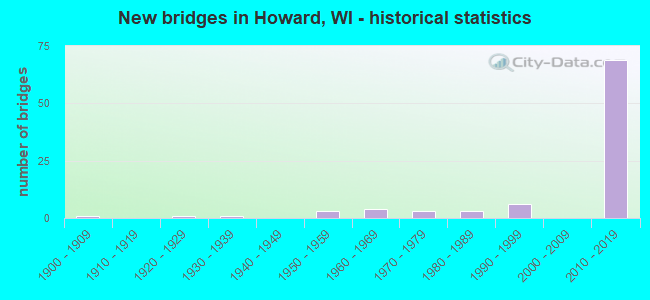
National Bridge Inventory (NBI) Statistics 91 Number of bridges2,349ft / 716m Total length $45,605,000 Total costs1,593,221 Total average daily traffic7,893 Total average daily truck traffic
New bridges - historical statistics
1 1900-1909 1 1920-1929 1 1930-1939 3 1950-1959 4 1960-1969 3 1970-1979 3 1980-1989 6 1990-1999 69 2010-2019
See full National Bridge Inventory statistics for Howard, WI
FCC Registered Cell Phone Towers: 2 (
See the full list of FCC Registered Cell Phone Towers in Howard )
FCC Registered Antenna Towers: 38 (
See the full list of FCC Registered Antenna Towers )
FCC Registered Broadcast Land Mobile Towers: 2
1901 Velp Ave (Lat: 44.570556 Lon: -88.076500), Call Sign: KNDH854, Assigned Frequencies: 42.9600 MHz, Grant Date: 05/14/1997, Expiration Date: 07/23/2002, Cancellation Date: 11/24/2002, Registrant: Package Boiler Burner Service Corp, 5401 N Park St, Butler, WI 53007, Phone: (414) 781-9620 Lat: 44.578472 Lon: -88.077611, Call Sign: WPUA743, Assigned Frequencies: 467.750 MHz, 467.825 MHz, Grant Date: 12/30/2011, Expiration Date: 01/24/2022, Cancellation Date: 12/12/2012, Certifier: Charles W Olsen, Registrant: Piggly Wiggly Midwest, LLC, 2215 Union Avenue, Sheboygan, WI 53081, Phone: (920) 208-4003, Fax: (920) 208-5003, Email:
FCC Registered Microwave Towers: 3
VELP, 2198 Glendale Ave. (Lat: 44.566278 Lon: -88.069389), Type: Tower, Structure height: 42.7 m, Overall height: 45.4 m, Call Sign: WPQY679, Licensee ID: L00127162, Assigned Frequencies: 10552.5 MHz, Grant Date: 11/02/2010, Expiration Date: 12/04/2020, Cancellation Date: 08/19/2015, Certifier: Steven T Campbell, Registrant: United States Cellular Operating Company LLC ML15AL025, 12600 Velp Avenue (Lat: 44.613889 Lon: -88.069167), Type: Mtower, Structure height: 45.7 m, Overall height: 50.6 m, Call Sign: WQWU499, Assigned Frequencies: 11305.0 MHz, 11305.0 MHz, 11305.0 MHz, 11305.0 MHz, 11305.0 MHz, 11305.0 MHz, 11305.0 MHz, Grant Date: 11/20/2015, Expiration Date: 11/20/2025, Cancellation Date: 05/12/2023, Certifier: David Werblow, Registrant: T-Mobile Usa, Inc., 12920 Se 38th Street, Bellevue, WA 98006, Phone: (425) 383-8401, Email:
ML04AL027, 4165 Shawano Ave (Lat: 44.575833 Lon: -88.143833), Type: Tank, Structure height: 47.2 m, Overall height: 49.4 m, Call Sign: WQWZ990, Assigned Frequencies: 19575.0 MHz, 19575.0 MHz, 19575.0 MHz, 19575.0 MHz, 19575.0 MHz, Grant Date: 01/11/2016, Expiration Date: 01/11/2026, Cancellation Date: 05/12/2023, Certifier: David Werblow, Registrant: T-Mobile Usa, Inc., 12920 Se 38th Street, Bellevue, WA 98006, Phone: (425) 383-8401, Email:
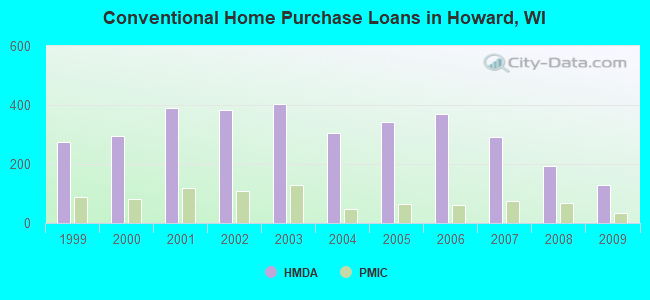
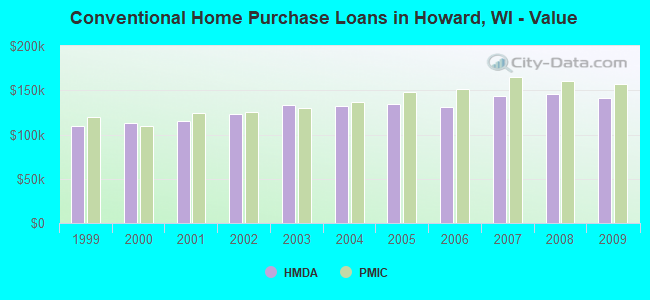
Home Mortgage Disclosure Act Aggregated Statistics For Year 2009(Based on 2 full tracts) A) FHA, FSA/RHS & VA B) Conventional C) Refinancings D) Home Improvement Loans E) Loans on Dwellings For 5+ Families F) Non-occupant Loans on Number Average Value Number Average Value Number Average Value Number Average Value Number Average Value Number Average Value
LOANS ORIGINATED 73 $153,720 130 $141,436 972 $148,047 27 $96,437 5 $1,162,086 22 $137,168 APPLICATIONS APPROVED, NOT ACCEPTED 2 $121,500 7 $229,857 82 $162,851 0 $0 0 $0 1 $130,000 APPLICATIONS DENIED 7 $136,636 13 $135,313 130 $158,862 5 $57,584 1 $666,130 6 $102,442 APPLICATIONS WITHDRAWN 2 $121,500 10 $162,870 105 $166,682 5 $97,262 1 $1,175,520 8 $110,872 FILES CLOSED FOR INCOMPLETENESS 1 $136,000 1 $246,000 26 $163,195 0 $0 0 $0 1 $184,000
Aggregated Statistics For Year 2008(Based on 2 full tracts) A) FHA, FSA/RHS & VA B) Conventional C) Refinancings D) Home Improvement Loans E) Loans on Dwellings For 5+ Families F) Non-occupant Loans on G) Loans On Manufactured Number Average Value Number Average Value Number Average Value Number Average Value Number Average Value Number Average Value Number Average Value
LOANS ORIGINATED 44 $157,518 192 $145,541 539 $139,724 40 $34,132 2 $8,194,355 22 $125,683 0 $0 APPLICATIONS APPROVED, NOT ACCEPTED 2 $202,410 11 $183,182 64 $146,440 6 $16,303 0 $0 2 $283,500 0 $0 APPLICATIONS DENIED 6 $126,833 11 $118,685 141 $170,740 16 $57,746 0 $0 8 $178,194 2 $54,000 APPLICATIONS WITHDRAWN 5 $134,600 8 $149,250 62 $176,173 2 $15,000 1 $13,541,990 3 $152,287 0 $0 FILES CLOSED FOR INCOMPLETENESS 3 $156,000 5 $189,200 13 $191,236 0 $0 0 $0 1 $270,000 0 $0
Aggregated Statistics For Year 2007(Based on 2 full tracts) A) FHA, FSA/RHS & VA B) Conventional C) Refinancings D) Home Improvement Loans E) Loans on Dwellings For 5+ Families F) Non-occupant Loans on G) Loans On Manufactured Number Average Value Number Average Value Number Average Value Number Average Value Number Average Value Number Average Value Number Average Value
LOANS ORIGINATED 18 $162,141 293 $143,459 488 $135,446 51 $55,360 6 $233,825 37 $158,616 1 $45,000 APPLICATIONS APPROVED, NOT ACCEPTED 2 $190,265 28 $120,119 71 $110,895 6 $26,748 1 $125,000 2 $146,000 0 $0 APPLICATIONS DENIED 1 $146,000 29 $156,594 154 $126,984 28 $73,545 0 $0 16 $143,062 0 $0 APPLICATIONS WITHDRAWN 0 $0 25 $156,648 78 $139,216 8 $51,225 0 $0 4 $168,700 0 $0 FILES CLOSED FOR INCOMPLETENESS 0 $0 10 $145,508 47 $156,458 0 $0 0 $0 1 $116,000 0 $0
Aggregated Statistics For Year 2006(Based on 2 full tracts) A) FHA, FSA/RHS & VA B) Conventional C) Refinancings D) Home Improvement Loans E) Loans on Dwellings For 5+ Families F) Non-occupant Loans on G) Loans On Manufactured Number Average Value Number Average Value Number Average Value Number Average Value Number Average Value Number Average Value Number Average Value
LOANS ORIGINATED 14 $152,101 370 $130,950 490 $120,061 76 $41,478 6 $1,183,075 37 $115,138 2 $100,305 APPLICATIONS APPROVED, NOT ACCEPTED 0 $0 29 $115,420 68 $113,439 6 $61,493 0 $0 7 $121,050 0 $0 APPLICATIONS DENIED 3 $121,333 45 $100,932 179 $130,277 26 $66,639 1 $186,000 13 $167,208 6 $52,872 APPLICATIONS WITHDRAWN 0 $0 28 $136,731 98 $122,110 7 $138,286 0 $0 1 $31,000 1 $36,000 FILES CLOSED FOR INCOMPLETENESS 0 $0 15 $140,652 46 $162,869 0 $0 0 $0 5 $142,756 0 $0
Aggregated Statistics For Year 2005(Based on 2 full tracts) A) FHA, FSA/RHS & VA B) Conventional C) Refinancings D) Home Improvement Loans E) Loans on Dwellings For 5+ Families F) Non-occupant Loans on G) Loans On Manufactured Number Average Value Number Average Value Number Average Value Number Average Value Number Average Value Number Average Value Number Average Value
LOANS ORIGINATED 6 $135,023 342 $134,611 543 $138,224 86 $40,035 5 $426,572 45 $142,208 0 $0 APPLICATIONS APPROVED, NOT ACCEPTED 0 $0 16 $121,680 56 $134,528 12 $31,529 0 $0 5 $197,446 0 $0 APPLICATIONS DENIED 1 $87,180 48 $115,411 209 $146,060 12 $58,917 3 $1,322,460 15 $152,477 1 $4,900 APPLICATIONS WITHDRAWN 2 $181,115 21 $112,173 128 $132,505 7 $178,630 1 $471,190 8 $173,275 0 $0 FILES CLOSED FOR INCOMPLETENESS 0 $0 13 $100,704 63 $159,590 2 $31,835 0 $0 1 $306,000 0 $0
Aggregated Statistics For Year 2004(Based on 2 full tracts) A) FHA, FSA/RHS & VA B) Conventional C) Refinancings D) Home Improvement Loans E) Loans on Dwellings For 5+ Families F) Non-occupant Loans on G) Loans On Manufactured Number Average Value Number Average Value Number Average Value Number Average Value Number Average Value Number Average Value Number Average Value
LOANS ORIGINATED 10 $155,602 304 $131,853 750 $126,801 54 $32,646 1 $512,000 50 $134,223 1 $2,000 APPLICATIONS APPROVED, NOT ACCEPTED 2 $208,000 28 $107,388 63 $105,545 7 $20,426 0 $0 2 $152,500 0 $0 APPLICATIONS DENIED 0 $0 26 $149,612 159 $127,355 15 $53,317 0 $0 6 $71,663 0 $0 APPLICATIONS WITHDRAWN 1 $182,000 10 $105,988 98 $143,720 4 $121,250 0 $0 1 $108,000 0 $0 FILES CLOSED FOR INCOMPLETENESS 1 $215,000 4 $115,990 47 $141,467 2 $19,900 0 $0 2 $100,370 0 $0
Aggregated Statistics For Year 2003(Based on 2 full tracts) A) FHA, FSA/RHS & VA B) Conventional C) Refinancings D) Home Improvement Loans E) Loans on Dwellings For 5+ Families F) Non-occupant Loans on Number Average Value Number Average Value Number Average Value Number Average Value Number Average Value Number Average Value
LOANS ORIGINATED 22 $143,181 403 $133,555 1,826 $122,134 59 $23,928 7 $744,061 79 $136,864 APPLICATIONS APPROVED, NOT ACCEPTED 1 $105,000 20 $120,616 85 $99,446 3 $6,640 0 $0 4 $124,250 APPLICATIONS DENIED 0 $0 24 $114,680 132 $114,807 18 $22,809 0 $0 8 $104,779 APPLICATIONS WITHDRAWN 0 $0 35 $124,654 106 $121,253 2 $15,185 0 $0 4 $138,852 FILES CLOSED FOR INCOMPLETENESS 0 $0 4 $92,775 29 $138,400 0 $0 0 $0 0 $0
Aggregated Statistics For Year 2002(Based on 2 full tracts) A) FHA, FSA/RHS & VA B) Conventional C) Refinancings D) Home Improvement Loans E) Loans on Dwellings For 5+ Families F) Non-occupant Loans on Number Average Value Number Average Value Number Average Value Number Average Value Number Average Value Number Average Value
LOANS ORIGINATED 25 $113,195 383 $122,694 1,537 $118,955 75 $21,296 4 $571,635 69 $114,571 APPLICATIONS APPROVED, NOT ACCEPTED 0 $0 26 $107,185 75 $111,138 3 $19,667 0 $0 3 $100,693 APPLICATIONS DENIED 1 $110,000 32 $85,231 114 $106,926 16 $26,679 0 $0 5 $125,262 APPLICATIONS WITHDRAWN 0 $0 20 $109,691 91 $116,948 4 $44,872 0 $0 3 $149,060 FILES CLOSED FOR INCOMPLETENESS 2 $118,825 5 $87,470 19 $135,752 1 $50,000 0 $0 3 $155,033
Aggregated Statistics For Year 2001(Based on 2 full tracts) A) FHA, FSA/RHS & VA B) Conventional C) Refinancings D) Home Improvement Loans E) Loans on Dwellings For 5+ Families F) Non-occupant Loans on Number Average Value Number Average Value Number Average Value Number Average Value Number Average Value Number Average Value
LOANS ORIGINATED 39 $119,634 389 $115,340 1,109 $107,631 57 $18,061 4 $1,658,708 32 $111,859 APPLICATIONS APPROVED, NOT ACCEPTED 1 $70,530 20 $96,400 81 $99,223 4 $14,398 0 $0 2 $51,540 APPLICATIONS DENIED 1 $107,000 29 $104,302 107 $93,593 9 $9,751 0 $0 8 $96,095 APPLICATIONS WITHDRAWN 5 $84,866 18 $128,175 74 $110,507 5 $27,518 1 $118,000 3 $85,530 FILES CLOSED FOR INCOMPLETENESS 0 $0 2 $92,125 9 $88,512 0 $0 1 $157,000 0 $0
Aggregated Statistics For Year 2000(Based on 2 full tracts) A) FHA, FSA/RHS & VA B) Conventional C) Refinancings D) Home Improvement Loans E) Loans on Dwellings For 5+ Families F) Non-occupant Loans on Number Average Value Number Average Value Number Average Value Number Average Value Number Average Value Number Average Value
LOANS ORIGINATED 14 $117,990 295 $113,437 286 $87,716 65 $24,074 2 $388,165 31 $120,648 APPLICATIONS APPROVED, NOT ACCEPTED 2 $133,000 24 $84,464 34 $95,192 4 $12,475 0 $0 1 $121,470 APPLICATIONS DENIED 0 $0 46 $82,785 73 $94,145 7 $30,720 0 $0 5 $111,086 APPLICATIONS WITHDRAWN 2 $89,665 15 $108,855 24 $59,069 7 $23,149 0 $0 1 $70,000 FILES CLOSED FOR INCOMPLETENESS 0 $0 5 $71,254 5 $137,462 1 $15,000 0 $0 0 $0
Aggregated Statistics For Year 1999(Based on 1 full and 1 partial tracts) A) FHA, FSA/RHS & VA B) Conventional C) Refinancings D) Home Improvement Loans E) Loans on Dwellings For 5+ Families F) Non-occupant Loans on Number Average Value Number Average Value Number Average Value Number Average Value Number Average Value Number Average Value
LOANS ORIGINATED 18 $104,600 274 $110,105 425 $85,559 75 $17,045 1 $291,210 41 $109,309 APPLICATIONS APPROVED, NOT ACCEPTED 0 $0 20 $95,597 38 $75,504 6 $28,452 0 $0 1 $94,750 APPLICATIONS DENIED 3 $99,743 28 $80,103 77 $79,998 12 $32,924 0 $0 4 $83,920 APPLICATIONS WITHDRAWN 0 $0 26 $104,790 51 $90,267 9 $34,423 0 $0 2 $79,790 FILES CLOSED FOR INCOMPLETENESS 0 $0 5 $95,094 17 $100,775 0 $0 0 $0 0 $0
Detailed HMDA statistics for the following Tracts:
0205.01
, 0205.02
Private Mortgage Insurance Companies Aggregated Statistics For Year 2009(Based on 2 full tracts) A) Conventional B) Refinancings Number Average Value Number Average Value
LOANS ORIGINATED 33 $157,381 43 $161,202 APPLICATIONS APPROVED, NOT ACCEPTED 4 $181,000 14 $181,419 APPLICATIONS DENIED 4 $193,750 4 $132,342 APPLICATIONS WITHDRAWN 6 $161,500 2 $149,440 FILES CLOSED FOR INCOMPLETENESS 0 $0 0 $0
Aggregated Statistics For Year 2008(Based on 2 full tracts) A) Conventional B) Refinancings C) Non-occupant Loans on Number Average Value Number Average Value Number Average Value
LOANS ORIGINATED 68 $160,446 53 $166,157 0 $0 APPLICATIONS APPROVED, NOT ACCEPTED 6 $216,637 12 $174,882 0 $0 APPLICATIONS DENIED 1 $260,000 2 $146,860 1 $260,000 APPLICATIONS WITHDRAWN 0 $0 0 $0 0 $0 FILES CLOSED FOR INCOMPLETENESS 0 $0 1 $147,000 1 $147,000
Aggregated Statistics For Year 2007(Based on 2 full tracts) A) Conventional B) Refinancings C) Non-occupant Loans on Number Average Value Number Average Value Number Average Value
LOANS ORIGINATED 75 $165,239 41 $167,448 4 $191,710 APPLICATIONS APPROVED, NOT ACCEPTED 7 $145,149 6 $147,392 2 $124,900 APPLICATIONS DENIED 1 $177,000 0 $0 0 $0 APPLICATIONS WITHDRAWN 3 $163,893 2 $190,500 0 $0 FILES CLOSED FOR INCOMPLETENESS 0 $0 0 $0 0 $0
Aggregated Statistics For Year 2006(Based on 2 full tracts) A) Conventional B) Refinancings C) Non-occupant Loans on Number Average Value Number Average Value Number Average Value
LOANS ORIGINATED 62 $151,552 20 $157,666 2 $158,870 APPLICATIONS APPROVED, NOT ACCEPTED 11 $99,913 7 $206,506 0 $0 APPLICATIONS DENIED 1 $75,000 0 $0 0 $0 APPLICATIONS WITHDRAWN 5 $169,400 1 $157,720 1 $145,000 FILES CLOSED FOR INCOMPLETENESS 0 $0 0 $0 0 $0
Aggregated Statistics For Year 2005(Based on 2 full tracts) A) Conventional B) Refinancings C) Non-occupant Loans on Number Average Value Number Average Value Number Average Value
LOANS ORIGINATED 63 $148,312 34 $169,398 4 $139,150 APPLICATIONS APPROVED, NOT ACCEPTED 10 $142,504 6 $165,232 0 $0 APPLICATIONS DENIED 0 $0 1 $136,160 0 $0 APPLICATIONS WITHDRAWN 3 $139,000 3 $183,333 0 $0 FILES CLOSED FOR INCOMPLETENESS 1 $78,370 1 $105,000 0 $0
Aggregated Statistics For Year 2004(Based on 2 full tracts) A) Conventional B) Refinancings C) Non-occupant Loans on Number Average Value Number Average Value Number Average Value
LOANS ORIGINATED 49 $137,286 46 $141,289 2 $138,570 APPLICATIONS APPROVED, NOT ACCEPTED 21 $139,851 18 $149,304 3 $106,803 APPLICATIONS DENIED 0 $0 0 $0 0 $0 APPLICATIONS WITHDRAWN 4 $135,000 3 $133,217 1 $145,000 FILES CLOSED FOR INCOMPLETENESS 1 $108,000 1 $96,980 0 $0
Aggregated Statistics For Year 2003(Based on 2 full tracts) A) Conventional B) Refinancings C) Non-occupant Loans on Number Average Value Number Average Value Number Average Value
LOANS ORIGINATED 128 $129,807 115 $136,297 1 $126,000 APPLICATIONS APPROVED, NOT ACCEPTED 23 $134,039 24 $137,233 0 $0 APPLICATIONS DENIED 1 $71,000 1 $121,000 0 $0 APPLICATIONS WITHDRAWN 3 $142,000 4 $171,750 0 $0 FILES CLOSED FOR INCOMPLETENESS 0 $0 1 $133,230 0 $0
Aggregated Statistics For Year 2002(Based on 2 full tracts) A) Conventional B) Refinancings C) Non-occupant Loans on Number Average Value Number Average Value Number Average Value
LOANS ORIGINATED 108 $125,586 89 $137,543 6 $125,755 APPLICATIONS APPROVED, NOT ACCEPTED 18 $143,344 12 $142,022 2 $184,000 APPLICATIONS DENIED 3 $104,987 5 $135,424 1 $186,120 APPLICATIONS WITHDRAWN 7 $138,294 4 $124,995 0 $0 FILES CLOSED FOR INCOMPLETENESS 0 $0 0 $0 0 $0
Aggregated Statistics For Year 2001(Based on 2 full tracts) A) Conventional B) Refinancings C) Non-occupant Loans on Number Average Value Number Average Value Number Average Value
LOANS ORIGINATED 118 $124,830 82 $131,355 0 $0 APPLICATIONS APPROVED, NOT ACCEPTED 22 $113,904 15 $150,535 2 $117,480 APPLICATIONS DENIED 2 $127,500 3 $156,633 1 $100,900 APPLICATIONS WITHDRAWN 4 $128,220 4 $174,082 0 $0 FILES CLOSED FOR INCOMPLETENESS 1 $127,000 0 $0 0 $0
Aggregated Statistics For Year 2000(Based on 2 full tracts) A) Conventional B) Refinancings C) Non-occupant Loans on Number Average Value Number Average Value Number Average Value
LOANS ORIGINATED 80 $109,803 27 $140,598 3 $87,333 APPLICATIONS APPROVED, NOT ACCEPTED 4 $101,902 5 $130,028 1 $137,140 APPLICATIONS DENIED 3 $122,333 0 $0 0 $0 APPLICATIONS WITHDRAWN 9 $106,508 1 $211,000 1 $48,000 FILES CLOSED FOR INCOMPLETENESS 1 $156,000 0 $0 0 $0
Aggregated Statistics For Year 1999(Based on 1 full and 1 partial tracts) A) Conventional B) Refinancings C) Non-occupant Loans on Number Average Value Number Average Value Number Average Value
LOANS ORIGINATED 87 $120,009 29 $124,452 0 $0 APPLICATIONS APPROVED, NOT ACCEPTED 8 $93,740 8 $114,111 1 $113,700 APPLICATIONS DENIED 3 $124,107 0 $0 0 $0 APPLICATIONS WITHDRAWN 2 $83,780 3 $135,183 0 $0 FILES CLOSED FOR INCOMPLETENESS 0 $0 0 $0 0 $0
Detailed PMIC statistics for the following Tracts:
0205.01
, 0205.02 Howard compared to Wisconsin state average:
Unemployed percentage significantly below state average. Hispanic race population percentage below state average. Median age below state average. Foreign-born population percentage below state average. Length of stay since moving in above state average. House age significantly below state average. Percentage of population with a bachelor's degree or higher above state average.


 Recent articles from our blog. Our writers, many of them Ph.D. graduates or candidates, create easy-to-read articles on a wide variety of topics.


 (4.7 miles
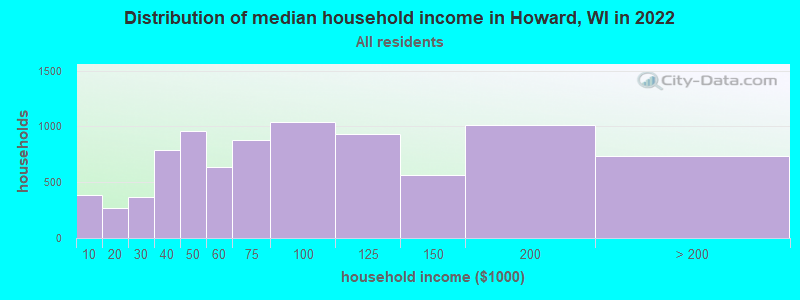


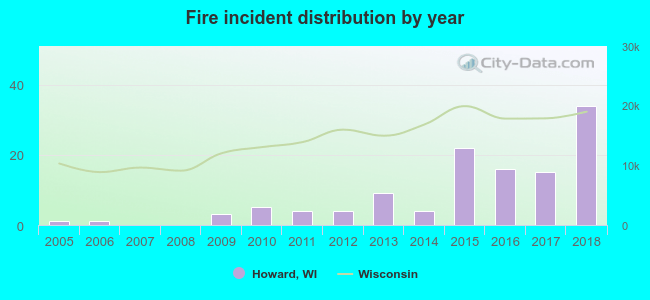 According to the data from the years 2005 - 2018 the average number of fires per year is 8. The highest number of fires - 34 took place in 2018, and the least - 0 in 2007. The data has a rising trend.
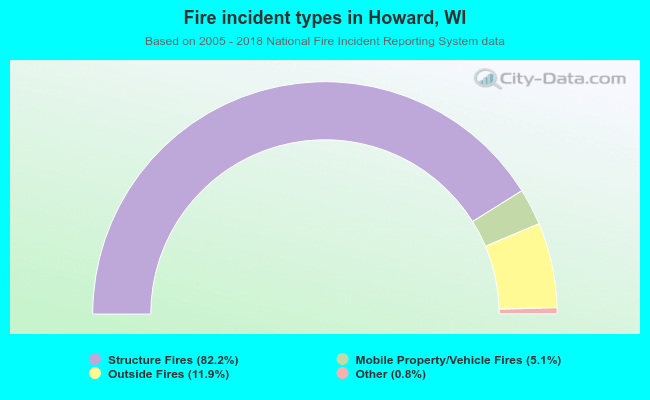 When looking into fire subcategories, the most incidents belonged to: Structure Fires (82.2%), and Outside Fires (11.9%).