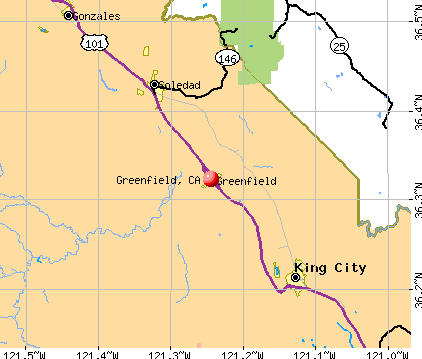
Greenfield, California
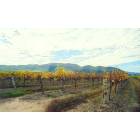
Greenfield: Wine-Mountians
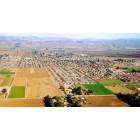
Greenfield: Greenfield View
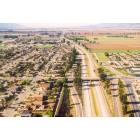
Greenfield: Highway View
![Greenfield: El Camino Real [Street]](//pics2.city-data.com/picthumb/thumb1503.jpg)
Greenfield: El Camino Real [Street]
- add
your


![Greenfield: El Camino Real [Street]](http://pics2.city-data.com/picthumb/thumb1503.jpg)
Submit your own pictures of this city and show them to the world
- OSM Map
- General Map
- Google Map
- MSN Map
Population change since 2000: +53.9%
| Males: 9,302 | |
| Females: 10,057 |
| Median resident age: | 27.8 years |
| California median age: | 37.9 years |
Zip codes: 93927.
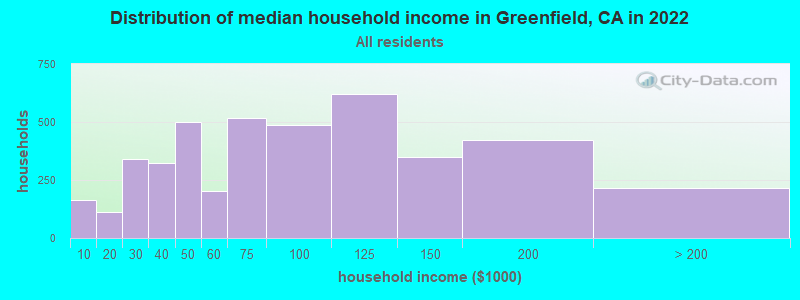
| Greenfield: | $75,363 |
| CA: | $91,551 |
Estimated per capita income in 2022: $19,375 (it was $9,226 in 2000)
Greenfield city income, earnings, and wages data
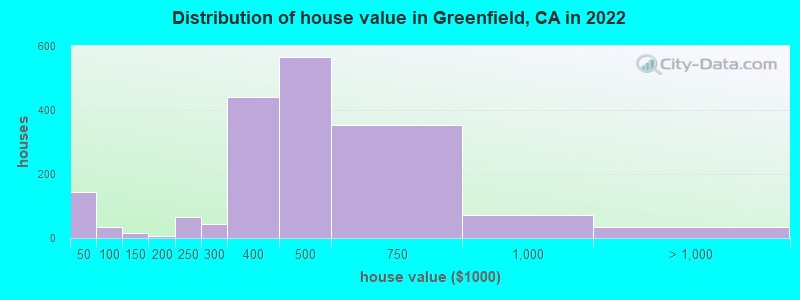
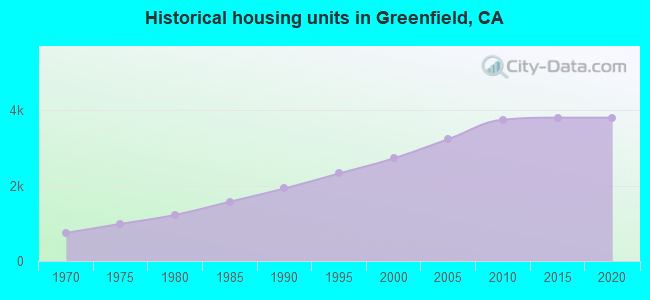
Estimated median house or condo value in 2022: $453,299 (it was $125,200 in 2000)
| Greenfield: | $453,299 |
| CA: | $715,900 |
Mean prices in 2022: all housing units: $955,620; detached houses: over $1,000,000; townhouses or other attached units: $741,452; in 2-unit structures: $782,213; in 3-to-4-unit structures: $910,101; in 5-or-more-unit structures: $502,903; mobile homes: $231,372; occupied boats, rvs, vans, etc.: $667,482
Median gross rent in 2022: $1,658.
(8.2% for White Non-Hispanic residents, 4.9% for Black residents, 12.3% for Hispanic or Latino residents, 12.1% for other race residents, 1.8% for two or more races residents)
Detailed information about poverty and poor residents in Greenfield, CA
Compare current foreclosures near Greenfield, CA:
| Photo | Address | Area | Beds / Baths | Price | Details |
|---|---|---|---|---|---|

|
#1
Primavera Ct
Greenfield, CA 93927
|
871 sq. feet
|
1 baths 2 beds |
show details | |

|
#2
10th St
Greenfield, CA 93927
|
1,486 sq. feet
|
2 baths 3 beds |
show details | |

|
#3
Paloma Dr
Greenfield, CA 93927
|
1,146 sq. feet
|
2 baths 3 beds |
show details | |

|
#4
Carmel Valley Rd
Greenfield, CA 93927
|
- sq. feet
|
2 baths 4 beds |
show details | |

|
#5
Spark St
Greenfield, CA 93927
|
- sq. feet
|
2 baths 4 beds |
show details | |

|
#6
Apple Ave
Greenfield, CA 93927
|
- sq. feet
|
3 baths 4 beds |
show details | |

|
#7
Tawny Port Way
Greenfield, CA 93927
|
- sq. feet
|
2 baths 3 beds |
show details | |

|
#8
Saint Matthews St
Greenfield, CA 93927
|
- sq. feet
|
2 baths 3 beds |
show details | |

|
#9
Borzini Cir
Greenfield, CA 93927
|
- sq. feet
|
3 baths 5 beds |
show details | |

|
#10
Avina Ave
Greenfield, CA 93927
|
- sq. feet
|
- baths - beds |
show details |
| Photo | Address | Area | Beds / Baths | Price | Details |
|---|---|---|---|---|---|

|
#11
10th St Apt 3
Greenfield, CA 93927
|
- sq. feet
|
- baths - beds |
show details | |

|
#12
13th St
Greenfield, CA 93927
|
- sq. feet
|
- baths - beds |
show details | |

|
#13
Pinnacles Ave
Greenfield, CA 93927
|
- sq. feet
|
- baths - beds |
show details | |

|
#14
Cardona Cir
Greenfield, CA 93927
|
- sq. feet
|
- baths - beds |
show details | |

|
#15
Elm Ave Apt 20a
Greenfield, CA 93927
|
- sq. feet
|
- baths - beds |
show details | |

|
#16
Oak Ave
Greenfield, CA 93927
|
- sq. feet
|
- baths - beds |
show details | |

|
#17
Elm Ave
Greenfield, CA 93927
|
- sq. feet
|
- baths - beds |
show details | |

|
#18
Pinnacles Ave
Greenfield, CA 93927
|
- sq. feet
|
- baths - beds |
show details | |

|
#19
10th St
Greenfield, CA 93927
|
- sq. feet
|
- baths - beds |
show details | |

|
#20
S 2nd St
King City, CA 93930
|
1,578 sq. feet
|
1 baths 3 beds |
$28,750
|
show details |
| Photo | Address | Area | Beds / Baths | Price | Details |
|---|---|---|---|---|---|

|
#21
3rd St
Soledad, CA 93960
|
1,165 sq. feet
|
2 baths 4 beds |
show details | |

|
#22
Sussex Way
King City, CA 93930
|
1,235 sq. feet
|
2 baths 4 beds |
show details | |

|
#23
N Mildred Ave
King City, CA 93930
|
1,866 sq. feet
|
2 baths 4 beds |
show details | |

|
#24
Pearl St
King City, CA 93930
|
1,380 sq. feet
|
1 baths 3 beds |
show details | |

|
#25
Pine Meadow Dr
King City, CA 93930
|
1,574 sq. feet
|
2 baths 3 beds |
show details | |

|
#26
San Vicente Rd
Soledad, CA 93960
|
2,780 sq. feet
|
2 baths 4 beds |
show details | |

|
#27
Merritt Street
King City, CA 93930
|
- sq. feet
|
- baths - beds |
$7,700
|
show details |

|
#28
Pine Canyon Rd
King City, CA 93930
|
2,301 sq. feet
|
2 baths 3 beds |
show details | |

|
#29
Sentinel St
Soledad, CA 93960
|
1,396 sq. feet
|
2 baths 3 beds |
show details | |

|
#30
N Mildred Ave
King City, CA 93930
|
1,757 sq. feet
|
2 baths 4 beds |
show details |
| Photo | Address | Area | Beds / Baths | Price | Details |
|---|---|---|---|---|---|

|
#31
Granada St
Soledad, CA 93960
|
2,743 sq. feet
|
3 baths 3 beds |
show details | |

|
#32
Munras St
Soledad, CA 93960
|
1,233 sq. feet
|
2 baths 3 beds |
show details | |

|
#33
Munras St
Soledad, CA 93960
|
1,233 sq. feet
|
2 baths 3 beds |
show details | |

|
#34
Granada St
Soledad, CA 93960
|
1,397 sq. feet
|
2 baths 3 beds |
show details | |

|
#35
San Antonio
Soledad, CA 93960
|
- sq. feet
|
2 baths 5 beds |
show details | |

|
#36
Spreckels Rd
King City, CA 93930
|
- sq. feet
|
2 baths 5 beds |
show details | |

|
#37
Charolais Dr
Gonzales, CA 93926
|
- sq. feet
|
2 baths 4 beds |
show details | |

|
#38
Madrid St
Soledad, CA 93960
|
- sq. feet
|
2 baths 6 beds |
show details | |

|
#39
La Colina St
Soledad, CA 93960
|
- sq. feet
|
2 baths 4 beds |
show details | |

|
#40
Holstein Way
Gonzales, CA 93926
|
- sq. feet
|
2 baths 4 beds |
show details |
| Photo | Address | Area | Beds / Baths | Price | Details |
|---|---|---|---|---|---|

|
#41
Head St
Soledad, CA 93960
|
- sq. feet
|
2 baths 4 beds |
show details | |

|
#42
Soberanes St
King City, CA 93930
|
- sq. feet
|
- baths - beds |
show details | |

|
#43
Front St Spc 57
Soledad, CA 93960
|
- sq. feet
|
- baths - beds |
show details | |

|
#44
Lewis St
King City, CA 93930
|
- sq. feet
|
- baths - beds |
show details | |

|
#45
Airline Hwy
King City, CA 93930
|
- sq. feet
|
- baths - beds |
show details | |

|
#46
Franscioni St
Soledad, CA 93960
|
- sq. feet
|
- baths - beds |
show details | |

|
#47
Little Creek Ct
King City, CA 93930
|
- sq. feet
|
- baths - beds |
show details | |

|
#48
Brumwell St
King City, CA 93930
|
- sq. feet
|
- baths - beds |
show details | |

|
#49
Luna Way
Soledad, CA 93960
|
- sq. feet
|
- baths - beds |
show details | |

|
Check over 1 million property listings on Foreclosure.com!
|
browse all offers | |||


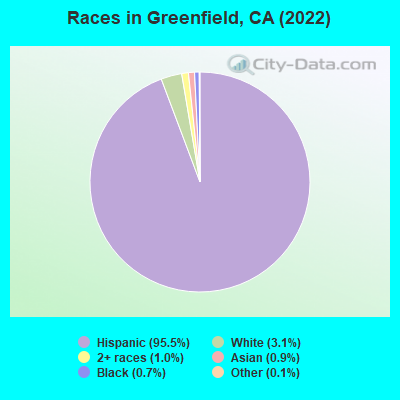
- 17,95195.5%Hispanic
- 5823.1%White alone
- 1941.0%Two or more races
- 1780.9%Asian alone
- 1250.7%Black alone
- 210.1%Other race alone
According to our research of California and other state lists, there were 24 registered sex offenders living in Greenfield, California as of May 09, 2024.
The ratio of all residents to sex offenders in Greenfield is 716 to 1.
The ratio of registered sex offenders to all residents in this city is near the state average.
Type |
2009 |
2010 |
2011 |
2012 |
2013 |
2014 |
2015 |
2016 |
2017 |
2018 |
2019 |
2020 |
2021 |
2022 |
|---|---|---|---|---|---|---|---|---|---|---|---|---|---|---|
| Murders (per 100,000) | 6 (38.7) | 3 (18.4) | 5 (30.3) | 5 (29.8) | 1 (5.9) | 6 (35.3) | 2 (11.7) | 3 (17.3) | 2 (11.4) | 3 (17.0) | 1 (5.6) | 3 (17.0) | 0 (0.0) | 1 (5.2) |
| Rapes (per 100,000) | 3 (19.3) | 3 (18.4) | 4 (24.2) | 1 (6.0) | 1 (5.9) | 5 (29.4) | 3 (17.6) | 3 (17.3) | 7 (39.8) | 4 (22.6) | 9 (50.5) | 3 (17.0) | 11 (61.9) | 12 (62.6) |
| Robberies (per 100,000) | 58 (373.9) | 41 (251.1) | 29 (175.5) | 32 (190.9) | 31 (183.2) | 19 (111.9) | 26 (152.4) | 21 (121.1) | 18 (102.3) | 14 (79.2) | 9 (50.5) | 13 (73.7) | 13 (73.1) | 11 (57.4) |
| Assaults (per 100,000) | 80 (515.8) | 57 (349.1) | 44 (266.3) | 82 (489.1) | 56 (330.9) | 61 (359.1) | 70 (410.3) | 29 (167.2) | 75 (426.1) | 76 (429.9) | 35 (196.5) | 25 (141.7) | 57 (320.6) | 58 (302.8) |
| Burglaries (per 100,000) | 106 (683.4) | 85 (520.5) | 87 (526.6) | 102 (608.4) | 62 (366.4) | 100 (588.7) | 88 (515.8) | 55 (317.1) | 49 (278.4) | 41 (231.9) | 31 (174.1) | 15 (85.0) | 12 (67.5) | 34 (177.5) |
| Thefts (per 100,000) | 205 (1,322) | 229 (1,402) | 168 (1,017) | 165 (984.2) | 141 (833.2) | 150 (883.1) | 144 (844.0) | 168 (968.7) | 86 (488.6) | 108 (610.9) | 98 (550.3) | 84 (476.1) | 134 (753.8) | 119 (621.2) |
| Auto thefts (per 100,000) | 49 (315.9) | 30 (183.7) | 51 (308.7) | 39 (232.6) | 56 (330.9) | 69 (406.2) | 92 (539.2) | 74 (426.7) | 79 (448.8) | 44 (248.9) | 36 (202.1) | 37 (209.7) | 24 (135.0) | 35 (182.7) |
| Arson (per 100,000) | 4 (25.8) | 7 (42.9) | 8 (48.4) | 4 (23.9) | 3 (17.7) | 9 (53.0) | 5 (29.3) | 7 (40.4) | 14 (79.5) | 3 (17.0) | 12 (67.4) | 5 (28.3) | 3 (16.9) | 8 (41.8) |
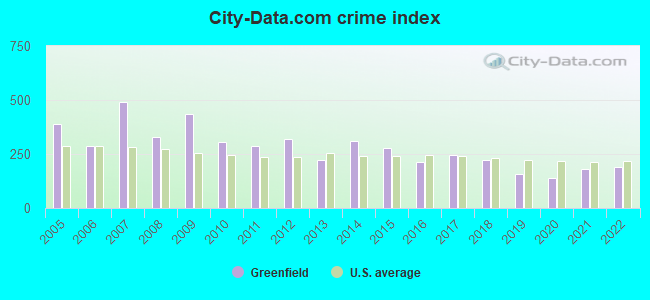
| City-Data.com crime index | 434.1 | 303.8 | 288.0 | 320.1 | 223.1 | 308.6 | 278.3 | 213.3 | 245.4 | 222.3 | 156.5 | 139.8 | 181.2 | 190.2 |
The City-Data.com crime index weighs serious crimes and violent crimes more heavily. Higher means more crime, U.S. average is 246.1. It adjusts for the number of visitors and daily workers commuting into cities.
Crime rate in Greenfield detailed stats: murders, rapes, robberies, assaults, burglaries, thefts, arson
Full-time law enforcement employees in 2021, including police officers: 28 (22 officers - 21 male; 1 female).
| Officers per 1,000 residents here: | 1.24 |
| California average: | 2.30 |
 Recent articles from our blog. Our writers, many of them Ph.D. graduates or candidates, create easy-to-read articles on a wide variety of topics.


 | Questions: Moving to slo county (32 replies) |
| Greenfield, CA (8 replies) |
| Is Monterey Conservative? (18 replies) |
| Can we afford Monterey Country? (11 replies) |
| Snow near Monterey, CA (23 replies) |
| Pros vs. Cons of moving to Salinas. Help Please (55 replies) |
Latest news from Greenfield, CA collected exclusively by city-data.com from local newspapers, TV, and radio stations
Current Local Time: PST time zone
Elevation: 280 feet
Land area: 1.70 square miles.
Population density: 11,408 people per square mile (high).
7,773 residents are foreign born (40.0% Latin America).
| This city: | 41.4% |
| California: | 26.5% |
Median real estate property taxes paid for housing units with mortgages in 2022: $2,975 (0.7%)
Median real estate property taxes paid for housing units with no mortgage in 2022: $3,635 (0.8%)
Nearest city with pop. 50,000+: Salinas, CA  (33.4 miles , pop. 151,060).
Nearest city with pop. 200,000+: San Jose, CA (76.2 miles , pop. 894,943).
Nearest city with pop. 1,000,000+: Los Angeles, CA (224.1 miles , pop. 3,694,820).
Nearest cities:
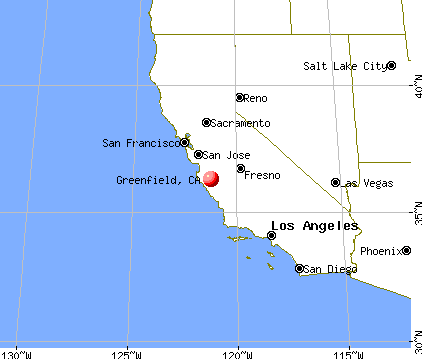
), ), ), ), ), )Latitude: 36.32 N, Longitude: 121.24 W
Daytime population change due to commuting: -4,401 (-23.4%)
Workers who live and work in this city: 1,621 (23.0%)
Area code commonly used in this area: 831
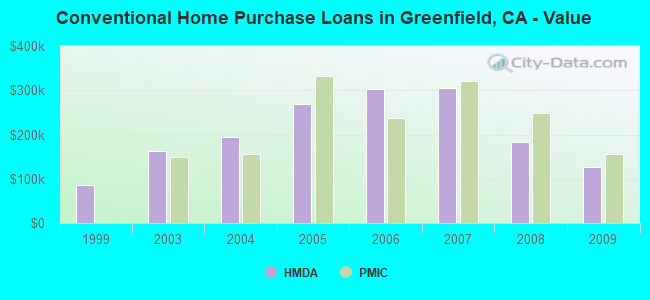
Property values in Greenfield, CA

Greenfield, California accommodation & food services, waste management - Economy and Business Data
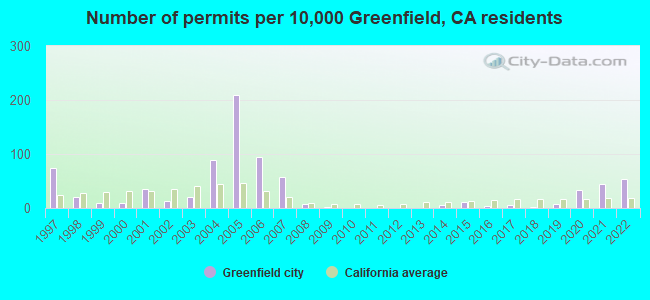
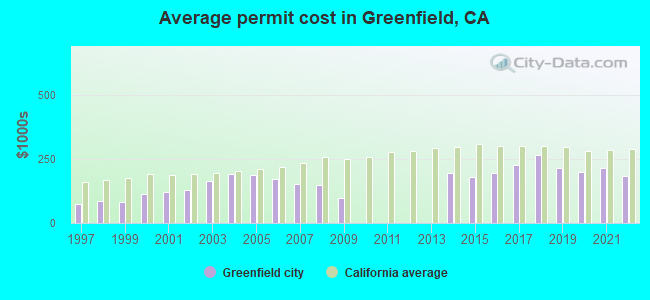
Single-family new house construction building permits:
- 2022: 68 buildings, average cost: $183,800
- 2021: 55 buildings, average cost: $213,700
- 2020: 42 buildings, average cost: $200,300
- 2019: 10 buildings, average cost: $214,100
- 2018: 3 buildings, average cost: $266,800
- 2017: 6 buildings, average cost: $226,100
- 2016: 5 buildings, average cost: $196,200
- 2015: 15 buildings, average cost: $182,400
- 2014: 8 buildings, average cost: $195,700
- 2009: 1 building, cost: $98,400
- 2008: 10 buildings, average cost: $147,700
- 2007: 73 buildings, average cost: $151,700
- 2006: 120 buildings, average cost: $173,900
- 2005: 263 buildings, average cost: $187,200
- 2004: 112 buildings, average cost: $190,100
- 2003: 26 buildings, average cost: $164,900
- 2002: 16 buildings, average cost: $129,800
- 2001: 45 buildings, average cost: $119,900
- 2000: 13 buildings, average cost: $113,400
- 1999: 12 buildings, average cost: $83,300
- 1998: 26 buildings, average cost: $86,100
- 1997: 95 buildings, average cost: $76,200
| Here: | 8.6% |
| California: | 5.1% |
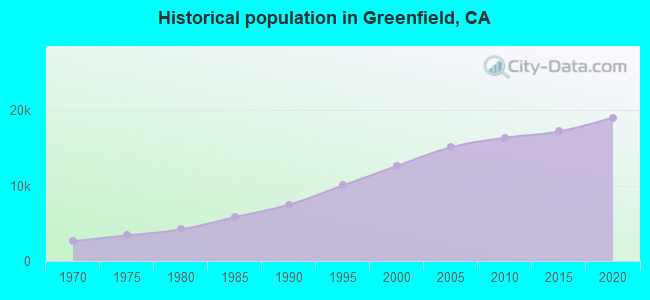
Population change in the 1990s: +4,915 (+64.1%).
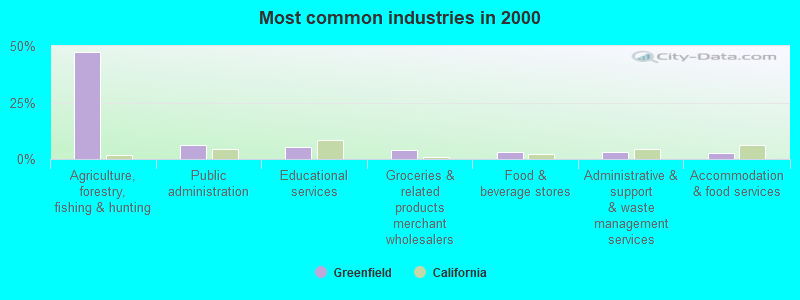
- Agriculture, forestry, fishing & hunting (47.5%)
- Public administration (6.3%)
- Educational services (5.4%)
- Groceries & related products merchant wholesalers (4.0%)
- Food & beverage stores (3.0%)
- Administrative & support & waste management services (2.9%)
- Accommodation & food services (2.6%)
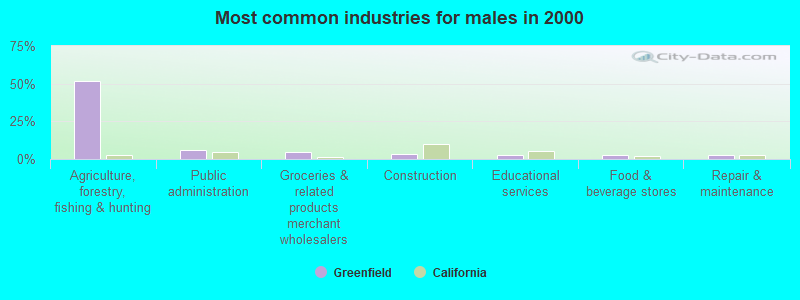
- Agriculture, forestry, fishing & hunting (51.9%)
- Public administration (5.8%)
- Groceries & related products merchant wholesalers (4.8%)
- Construction (3.6%)
- Educational services (3.0%)
- Food & beverage stores (3.0%)
- Repair & maintenance (2.9%)
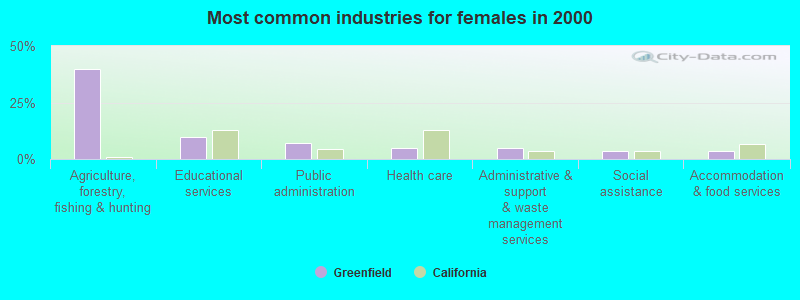
- Agriculture, forestry, fishing & hunting (39.7%)
- Educational services (9.6%)
- Public administration (7.1%)
- Health care (4.8%)
- Administrative & support & waste management services (4.7%)
- Social assistance (3.8%)
- Accommodation & food services (3.7%)
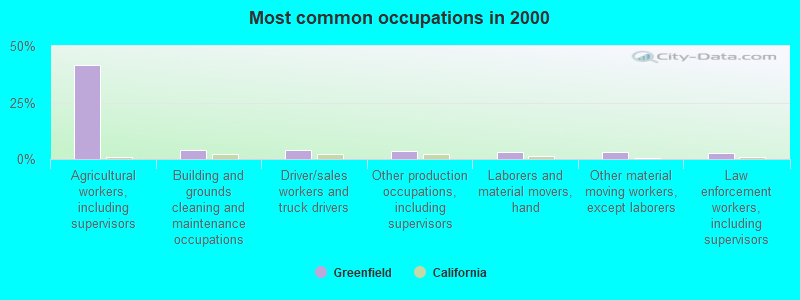
- Agricultural workers, including supervisors (41.6%)
- Building and grounds cleaning and maintenance occupations (4.0%)
- Driver/sales workers and truck drivers (4.0%)
- Other production occupations, including supervisors (3.6%)
- Laborers and material movers, hand (3.3%)
- Other material moving workers, except laborers (3.0%)
- Law enforcement workers, including supervisors (2.7%)
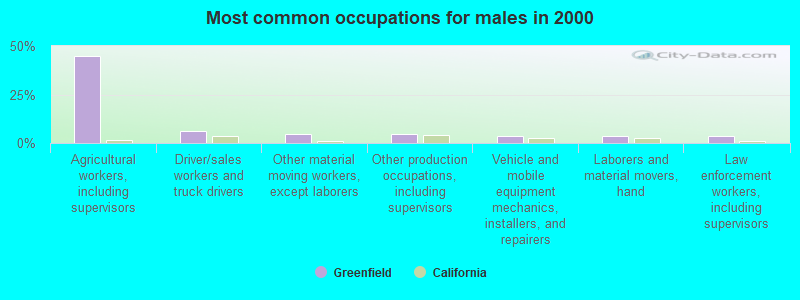
- Agricultural workers, including supervisors (44.7%)
- Driver/sales workers and truck drivers (6.2%)
- Other material moving workers, except laborers (4.8%)
- Other production occupations, including supervisors (4.6%)
- Vehicle and mobile equipment mechanics, installers, and repairers (3.9%)
- Laborers and material movers, hand (3.8%)
- Law enforcement workers, including supervisors (3.7%)
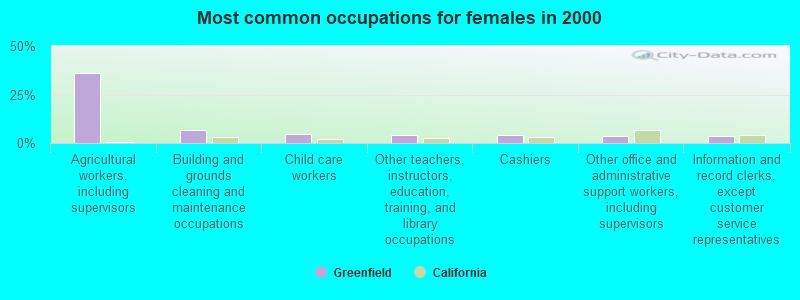
- Agricultural workers, including supervisors (36.3%)
- Building and grounds cleaning and maintenance occupations (6.6%)
- Child care workers (4.7%)
- Other teachers, instructors, education, training, and library occupations (4.0%)
- Cashiers (3.9%)
- Other office and administrative support workers, including supervisors (3.6%)
- Information and record clerks, except customer service representatives (3.5%)
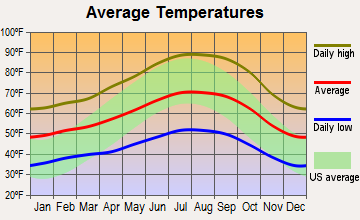
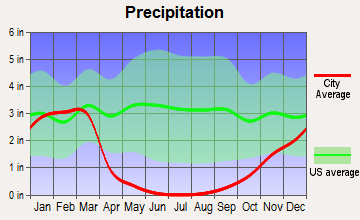
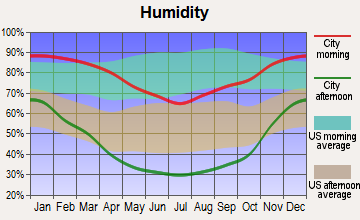
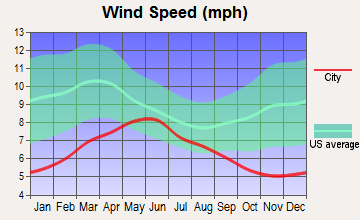
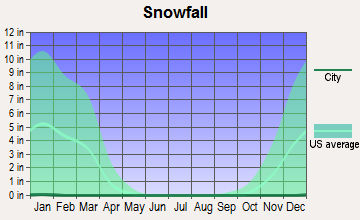
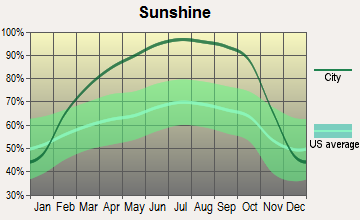
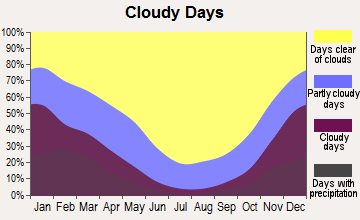
Average climate in Greenfield, California
Based on data reported by over 4,000 weather stations
|
|


(lower is better)
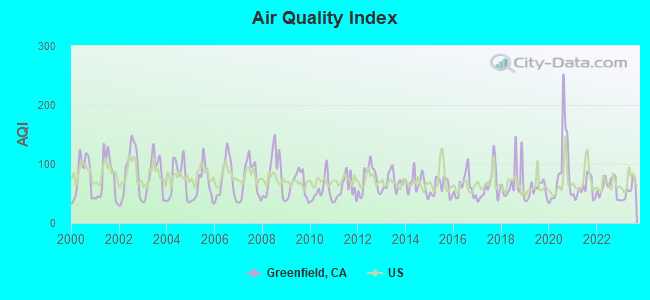
Air Quality Index (AQI) level in 2023 was 54.9. This is better than average.
| City: | 54.9 |
| U.S.: | 72.6 |
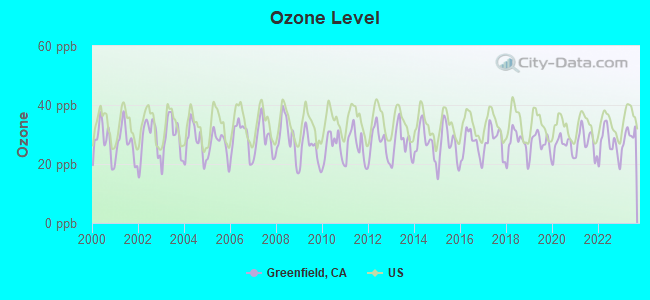
Ozone [ppb] level in 2023 was 29.5. This is about average. Closest monitor was 9.7 miles away from the city center.
| City: | 29.5 |
| U.S.: | 33.3 |
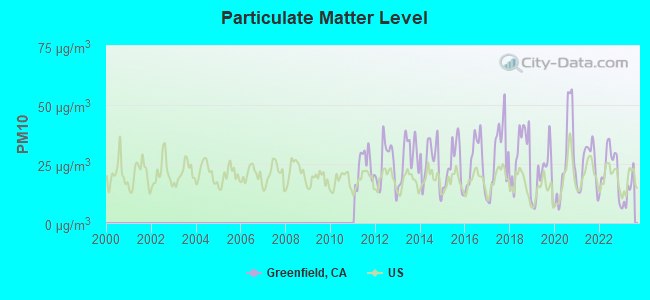
Particulate Matter (PM10) [µg/m3] level in 2023 was 13.5. This is significantly better than average. Closest monitor was 9.7 miles away from the city center.
| City: | 13.5 |
| U.S.: | 19.2 |
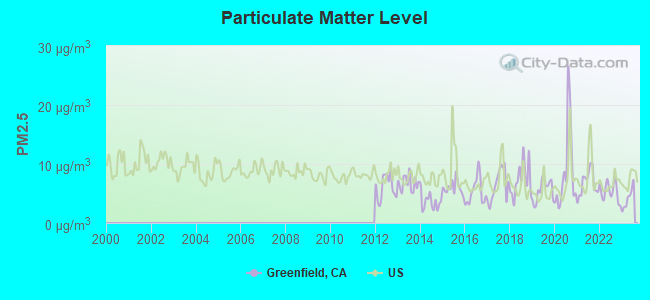
Particulate Matter (PM2.5) [µg/m3] level in 2023 was 4.18. This is significantly better than average. Closest monitor was 10.3 miles away from the city center.
| City: | 4.18 |
| U.S.: | 8.11 |
Earthquake activity:
Greenfield-area historical earthquake activity is significantly above California state average. It is 7740% greater than the overall U.S. average.On 4/18/1906 at 13:12:21, a magnitude 7.9 (7.9 UK, Class: Major, Intensity: VIII - XII) earthquake occurred 151.0 miles away from the city center, causing $524,000,000 total damage
On 11/4/1927 at 13:51:53, a magnitude 7.5 (7.5 UK) earthquake occurred 98.1 miles away from Greenfield center
On 7/21/1952 at 11:52:14, a magnitude 7.7 (7.7 UK) earthquake occurred 155.8 miles away from Greenfield center, causing $50,000,000 total damage
On 10/18/1989 at 00:04:15, a magnitude 7.1 (6.5 MB, 7.1 MS, 6.9 MW, 7.0 ML) earthquake occurred 61.7 miles away from the city center, causing 62 deaths (62 shaking deaths) and 3757 injuries, causing $1,305,032,704 total damage
On 5/2/1983 at 23:42:37, a magnitude 6.7 (6.2 MB, 6.5 MS, 6.5 MW, 6.7 ML, Class: Strong, Intensity: VII - IX) earthquake occurred 53.0 miles away from the city center, causing $31,000,000 total damage
On 12/22/2003 at 19:15:56, a magnitude 6.6 (6.1 MB, 6.4 MS, 6.6 MW, 6.4 MW) earthquake occurred 49.6 miles away from the city center, causing 2 deaths (2 shaking deaths) and 40 injuries, causing $200,000,000 total damage
Magnitude types: body-wave magnitude (MB), local magnitude (ML), surface-wave magnitude (MS), moment magnitude (MW)
Natural disasters:
The number of natural disasters in Monterey County (23) is greater than the US average (15).Major Disasters (Presidential) Declared: 14
Emergencies Declared: 3
Causes of natural disasters: Floods: 12, Winter Storms: 7, Storms: 6, Fires: 4, Landslides: 4, Mudslides: 4, Freezes: 2, Drought: 1, Earthquake: 1, Hurricane: 1, Tornado: 1, Tsunami Wave: 1, Other: 1 (Note: some incidents may be assigned to more than one category).

Hospitals and medical centers near Greenfield:
- SOLEDAD DIALYSIS CENTER (Dialysis Facility, about 8 miles away; SOLEDAD, CA)
- EDEN VALLEY CARE CENTER (Nursing Home, about 9 miles away; SOLEDAD, CA)
- MEE MEMORIAL HOSPITAL-DIALYSIS (Dialysis Facility, about 11 miles away; KING CITY, CA)
- GEORGE L MEE MEMORIAL HOSPITAL HOME HEALTH AGENCY (Home Health Center, about 11 miles away; KING CITY, CA)
- GEORGE L MEE MEMORIAL HOSPITAL Acute Care Hospitals (about 11 miles away; KING CITY, CA)
Airports located in Greenfield:
- Metz Airport (3CA7) (Runways: 1)
Amtrak stations near Greenfield:
- 9 miles: SOLEDAD (1000 FRONT ST.) - Bus Station . Services: fully wheelchair accessible, public restrooms, public payphones, snack bar, free short-term parking.
- 11 miles: KING CITY (570 CANAL ST.) - Bus Station . Services: fully wheelchair accessible, enclosed waiting area, public restrooms, public payphones, snack bar, free short-term parking.
Colleges/universities with over 2000 students nearest to Greenfield:
- Hartnell College (about 34 miles; Salinas, CA; Full-time enrollment: 5,506)
- California State University-Monterey Bay (about 39 miles; Seaside, CA; FT enrollment: 5,125)
- Naval Postgraduate School (about 40 miles; Monterey, CA; FT enrollment: 4,951)
- Monterey Peninsula College (about 41 miles; Monterey, CA; FT enrollment: 4,588)
- Gavilan College (about 49 miles; Gilroy, CA; FT enrollment: 3,327)
- Cabrillo College (about 60 miles; Aptos, CA; FT enrollment: 7,729)
- University of California-Santa Cruz (about 66 miles; Santa Cruz, CA; FT enrollment: 17,751)
Public high school in Greenfield:
- GREENFIELD HIGH (Students: 684, Location: 225 S. EL CAMINO REAL, Grades: 9-12)
Public elementary/middle schools in Greenfield:
- VISTA VERDE MIDDLE (Students: 725, Location: 1199 ELM AVE., Grades: 6-8)
- OAK AVENUE ELEMENTARY (Students: 361, Location: 1239 OAK AVE., Grades: KG-5)
- CESAR CHAVEZ ELEMENTARY (Students: 347, Location: 250 APPLE AVE., Grades: KG-5)
- MARY CHAPA ACADEMY (Location: 490 EL CAMINO REAL, Grades: KG-5)
User-submitted facts and corrections:
- The new web site for the City of Greenfield, is www.ci.greenfield.ca.us
Points of interest:
Notable locations in Greenfield: Greenfield Memorial Building (A), Greenfield City Hall (B), Greenfield Branch Monterey County Free Libraries (C), Kern County Fire Department Station 52 Greenfield (D), Greenfield Fire Protection District (E). Display/hide their locations on the map
Shopping Center: Santa Lucia Square Shopping Center (1). Display/hide its location on the map
Churches in Greenfield include: Greenfield First Southern Baptist Church (A), McKee Road Baptist Church (B), Sacred Heart Church (C), South Union Free Will Baptist Church (D). Display/hide their locations on the map
Park in Greenfield: Greenfield City Park (1). Display/hide its location on the map
Drinking water stations with addresses in Greenfield and their reported violations in the past:
ARROYO CENTER WC (Population served: 130, Surface water):Past monitoring violations:APPLE AVE WS #02 (Population served: 75, Groundwater):
- 8 routine major monitoring violations
- 2 minor monitoring violations
Past monitoring violations:APPLE AVE WS #03 (Population served: 60, Groundwater):
- Monitoring, Repeat Major (TCR) - In FEB-2010, Contaminant: Coliform (TCR). Follow-up actions: St Violation/Reminder Notice (MAR-16-2010), St Public Notif requested (MAR-16-2010)
- Monitoring, Repeat Major (TCR) - In DEC-2009, Contaminant: Coliform (TCR). Follow-up actions: St Violation/Reminder Notice (JAN-19-2010), St Public Notif requested (JAN-19-2010)
- 19 routine major monitoring violations
- 2 minor monitoring violations
Past health violations:CHEROKEE ACRES MHP WS (Population served: 36, Surface water):Past monitoring violations:
- MCL, Single Sample - Between JAN-2014 and MAR-2014, Contaminant: Nitrate
- MCL, Single Sample - Between OCT-2013 and DEC-2013, Contaminant: Nitrate. Follow-up actions: St AO (w/o penalty) issued (AUG-03-2005)
- MCL, Single Sample - Between APR-2013 and JUN-2013, Contaminant: Nitrate. Follow-up actions: St AO (w/o penalty) issued (AUG-03-2005)
- MCL, Single Sample - Between OCT-2012 and DEC-2012, Contaminant: Nitrate. Follow-up actions: St AO (w/o penalty) issued (AUG-03-2005)
- MCL, Single Sample - Between APR-2012 and JUN-2012, Contaminant: Nitrate. Follow-up actions: St AO (w/o penalty) issued (NOV-18-2008)
- MCL, Single Sample - In MAR-2005, Contaminant: Nitrate. Follow-up actions: St Public Notif requested (APR-22-2005), St Boil Water Order (APR-22-2005), St Violation/Reminder Notice (APR-22-2005)
- One routine major monitoring violation
- One minor monitoring violation
- One regular monitoring violation
Past health violations:OAK PARK WS (Population served: 29, Groundwater):Past monitoring violations:
- Failure to Filter (SWTR) - In APR-01-2013. Follow-up actions: St Public Notif requested (NOV-05-2008), St AO (w/o penalty) issued (NOV-30-2008), St Violation/Reminder Notice (SEP-15-2010), St AO (w/o penalty) issued (MAY-28-2013)
- Failure to Filter (SWTR) - In JAN-01-2013. Follow-up actions: St AO (w/o penalty) issued (NOV-30-2008), St Violation/Reminder Notice (SEP-15-2010), St AO (w/o penalty) issued (MAY-28-2013)
- Failure to Filter (SWTR) - In OCT-01-2012. Follow-up actions: St AO (w/o penalty) issued (NOV-30-2008), St Violation/Reminder Notice (SEP-15-2010)
- Failure to Filter (SWTR) - In JUL-01-2010. Follow-up actions: St AO (w/o penalty) issued (NOV-30-2008), St Violation/Reminder Notice (SEP-15-2010), St AO (w/o penalty) issued (MAY-28-2013)
- Monitoring of Treatment (SWTR-Unfilt/GWR) - In JUL-2013. Follow-up actions: St AO (w/o penalty) issued (NOV-30-2008), St Public Notif requested (MAY-28-2013), St AO (w/o penalty) issued (MAY-28-2013), St Violation/Reminder Notice (MAY-28-2013)
- Monitoring, Repeat Major (TCR) - In FEB-2007, Contaminant: Coliform (TCR). Follow-up actions: St Violation/Reminder Notice (MAR-21-2007)
- Monitoring, Repeat Major (TCR) - In FEB-2007, Contaminant: Coliform (TCR). Follow-up actions: St Violation/Reminder Notice (MAR-21-2007)
- 4 routine major monitoring violations
- 6 minor monitoring violations
- 2 regular monitoring violations
Past monitoring violations:
- Monitoring, Repeat Major (TCR) - In DEC-2007, Contaminant: Coliform (TCR)
- Monitoring, Repeat Major (TCR) - In DEC-2007, Contaminant: Coliform (TCR). Follow-up actions: St Violation/Reminder Notice (JAN-23-2008), St Public Notif requested (JAN-23-2008)
- Monitoring, Repeat Major (TCR) - In APR-2006, Contaminant: Coliform (TCR). Follow-up actions: St Violation/Reminder Notice (MAY-22-2006)
- Monitoring, Repeat Major (TCR) - In APR-2006, Contaminant: Coliform (TCR). Follow-up actions: St Violation/Reminder Notice (MAY-22-2006)
- 4 routine major monitoring violations
- 2 minor monitoring violations
- 3 regular monitoring violations
| This city: | 4.7 people |
| California: | 2.9 people |
| This city: | 89.6% |
| Whole state: | 68.7% |
| This city: | 7.9% |
| Whole state: | 7.2% |
Likely homosexual households (counted as self-reported same-sex unmarried-partner households)
- Lesbian couples: 0.4% of all households
- Gay men: 0.3% of all households
31 people in nursing homes in 2000
Banks with branches in Greenfield (2011 data):
- Wells Fargo Bank, National Association: Santa Lucia Square Branch at 500 Walnut Avenue, branch established on 1997/02/28. Info updated 2011/04/05: Bank assets: $1,161,490.0 mil, Deposits: $905,653.0 mil, headquarters in Sioux Falls, SD, positive income, 6395 total offices, Holding Company: Wells Fargo & Company
- JPMorgan Chase Bank, National Association: 502 El Camino Real Branch at 502 El Camino Real, branch established on 1919/01/01. Info updated 2011/11/10: Bank assets: $1,811,678.0 mil, Deposits: $1,190,738.0 mil, headquarters in Columbus, OH, positive income, International Specialization, 5577 total offices, Holding Company: Jpmorgan Chase & Co.
For population 15 years and over in Greenfield:
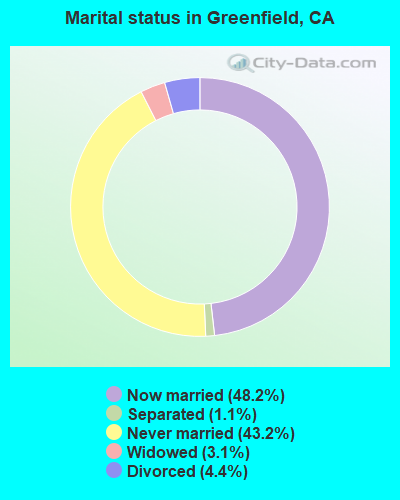
- Never married: 43.2%
- Now married: 48.2%
- Separated: 1.1%
- Widowed: 3.1%
- Divorced: 4.4%
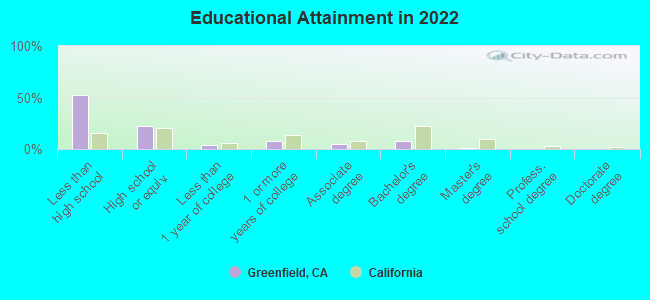
For population 25 years and over in Greenfield:
- High school or higher: 48.1%
- Bachelor's degree or higher: 8.3%
- Graduate or professional degree: 0.9%
- Unemployed: 13.4%
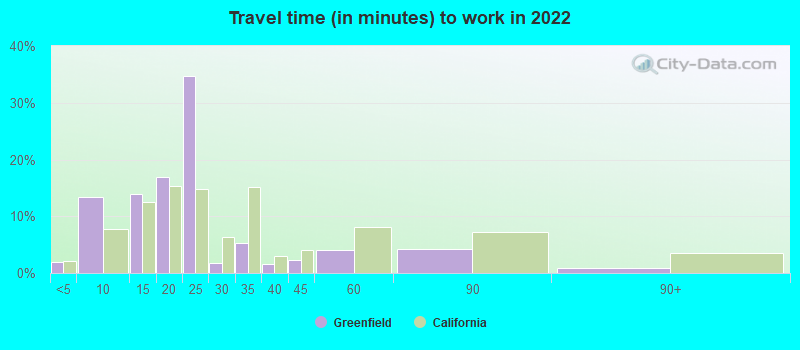
- Mean travel time to work (commute): 24.8 minutes
| Here: | 30.1 |
| California average: | 15.5 |
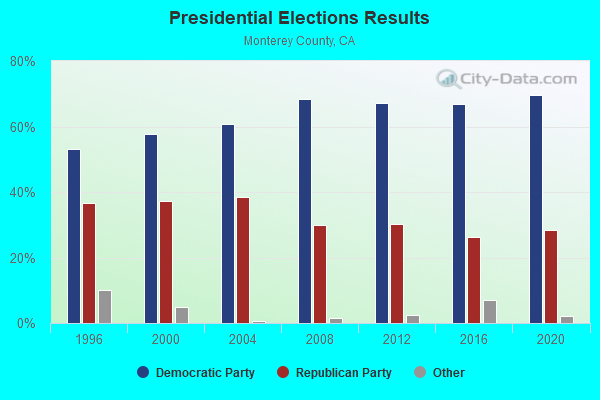
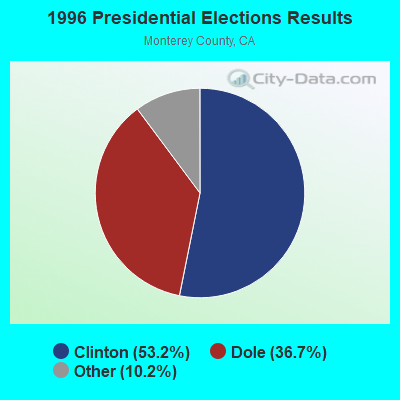
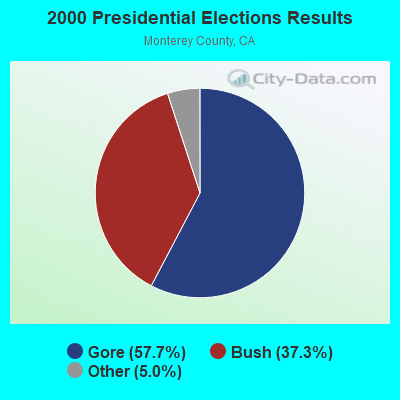
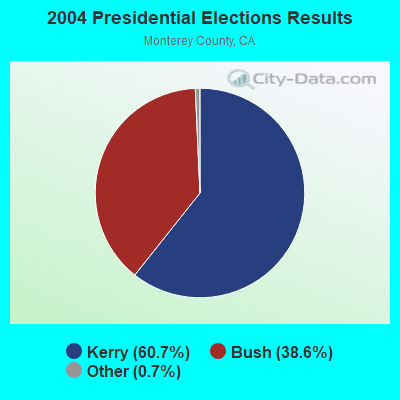
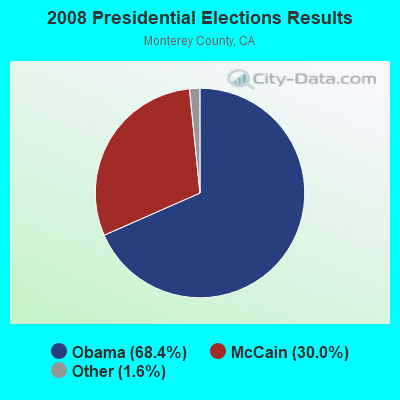
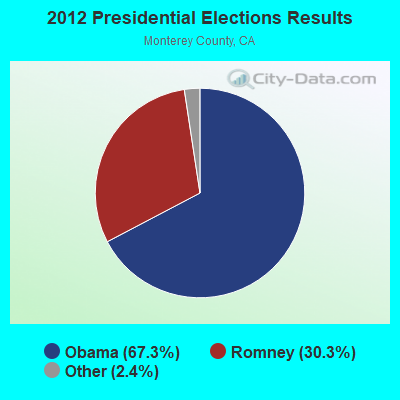
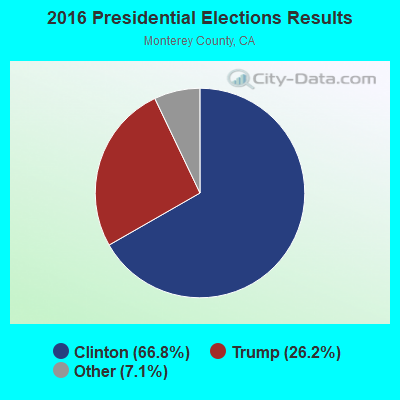
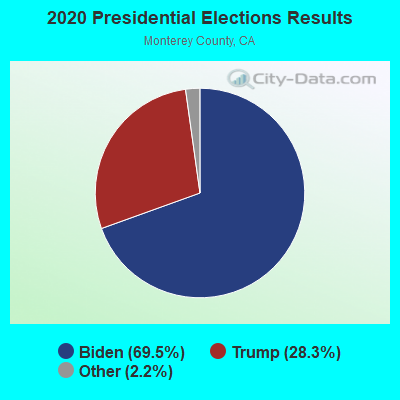
Graphs represent county-level data. Detailed 2008 Election Results
Religion statistics for Greenfield, CA (based on Monterey County data)
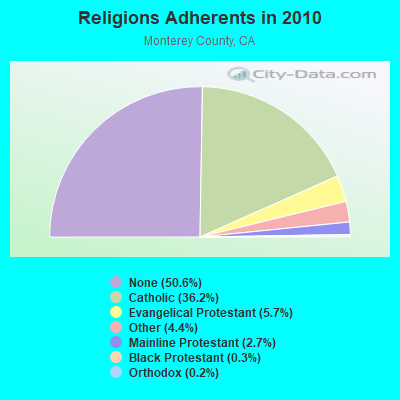
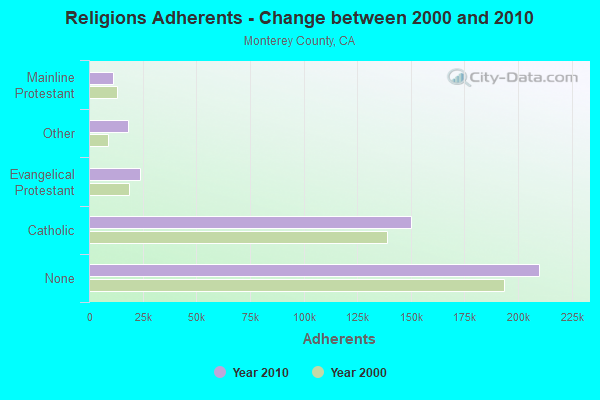
| Religion | Adherents | Congregations |
|---|---|---|
| Catholic | 150,050 | 26 |
| Evangelical Protestant | 23,624 | 154 |
| Other | 18,309 | 48 |
| Mainline Protestant | 11,244 | 48 |
| Black Protestant | 1,199 | 8 |
| Orthodox | 640 | 3 |
| None | 209,991 | - |
Food Environment Statistics:
| Monterey County: | 2.82 / 10,000 pop. |
| California: | 2.14 / 10,000 pop. |
| Here: | 0.05 / 10,000 pop. |
| California: | 0.04 / 10,000 pop. |
| Here: | 0.91 / 10,000 pop. |
| State: | 0.62 / 10,000 pop. |
| Monterey County: | 2.00 / 10,000 pop. |
| California: | 1.49 / 10,000 pop. |
| Monterey County: | 9.24 / 10,000 pop. |
| State: | 7.42 / 10,000 pop. |
| Monterey County: | 7.5% |
| State: | 7.3% |
| Monterey County: | 21.8% |
| California: | 21.3% |
| Here: | 18.4% |
| California: | 17.9% |
Health and Nutrition:
| Greenfield: | 44.4% |
| State: | 49.4% |
| Here: | 44.3% |
| California: | 48.0% |
| Greenfield: | 28.2 |
| California: | 28.1 |
| Greenfield: | 26.0% |
| State: | 20.2% |
| This city: | 9.7% |
| California: | 11.2% |
| Greenfield: | 6.7 |
| California: | 6.8 |
| This city: | 28.6% |
| California: | 31.5% |
| Greenfield: | 52.7% |
| California: | 56.4% |
| Here: | 81.7% |
| California: | 80.9% |
More about Health and Nutrition of Greenfield, CA Residents
| Local government employment and payroll (March 2022) | |||||
| Function | Full-time employees | Monthly full-time payroll | Average yearly full-time wage | Part-time employees | Monthly part-time payroll |
|---|---|---|---|---|---|
| Police Protection - Officers | 16 | $165,854 | $124,391 | 0 | $0 |
| Water Supply | 7 | $35,913 | $61,565 | 0 | $0 |
| Sewerage | 5 | $29,700 | $71,280 | 0 | $0 |
| Other Government Administration | 5 | $33,685 | $80,844 | 1 | $1,130 |
| Police - Other | 4 | $20,092 | $60,276 | 0 | $0 |
| Financial Administration | 4 | $25,426 | $76,278 | 0 | $0 |
| Other and Unallocable | 3 | $19,289 | $77,156 | 0 | $0 |
| Housing and Community Development (Local) | 3 | $24,166 | $96,664 | 0 | $0 |
| Transit | 2 | $8,768 | $52,608 | 0 | $0 |
| Parks and Recreation | 0 | $0 | 1 | $6,208 | |
| Totals for Government | 49 | $362,893 | $88,872 | 2 | $7,338 |
Greenfield government finances - Expenditure in 2018 (per resident):
- Construction - Central Staff Services: $565,000 ($29.19)
Water Utilities: $501,000 ($25.88)
Sewerage: $290,000 ($14.98)
Parks and Recreation: $212,000 ($10.95)
Housing and Community Development: $210,000 ($10.85)
Regular Highways: $120,000 ($6.20)
- Current Operations - Police Protection: $4,397,000 ($227.13)
Central Staff Services: $2,920,000 ($150.83)
Solid Waste Management: $1,715,000 ($88.59)
Sewerage: $1,172,000 ($60.54)
Regular Highways: $839,000 ($43.34)
Water Utilities: $677,000 ($34.97)
Parks and Recreation: $615,000 ($31.77)
Local Fire Protection: $200,000 ($10.33)
Health - Other: $160,000 ($8.26)
Protective Inspection and Regulation - Other: $63,000 ($3.25)
Housing and Community Development: $55,000 ($2.84)
- General - Interest on Debt: $362,000 ($18.70)
- Other Capital Outlay - Police Protection: $470,000 ($24.28)
Financial Administration: $410,000 ($21.18)
Regular Highways: $98,000 ($5.06)
Parks and Recreation: $39,000 ($2.01)
Housing and Community Development: $32,000 ($1.65)
- Water Utilities - Interest on Debt: $137,000 ($7.08)
Greenfield government finances - Revenue in 2018 (per resident):
- Charges - Solid Waste Management: $2,299,000 ($118.76)
Sewerage: $1,511,000 ($78.05)
Other: $743,000 ($38.38)
Parks and Recreation: $23,000 ($1.19)
Housing and Community Development: $12,000 ($0.62)
- Federal Intergovernmental - Housing and Community Development: $636,000 ($32.85)
- Local Intergovernmental - Other: $76,000 ($3.93)
- Miscellaneous - Special Assessments: $805,000 ($41.58)
General Revenue - Other: $568,000 ($29.34)
Fines and Forfeits: $235,000 ($12.14)
Rents: $57,000 ($2.94)
Interest Earnings: $51,000 ($2.63)
- Revenue - Water Utilities: $2,033,000 ($105.02)
- State Intergovernmental - Other: $3,683,000 ($190.25)
Highways: $478,000 ($24.69)
General Local Government Support: $77,000 ($3.98)
- Tax - Property: $2,066,000 ($106.72)
General Sales and Gross Receipts: $1,030,000 ($53.21)
Public Utilities Sales: $412,000 ($21.28)
Other License: $232,000 ($11.98)
Occupation and Business License - Other: $36,000 ($1.86)
Documentary and Stock Transfer: $34,000 ($1.76)
Other Selective Sales: $25,000 ($1.29)
Greenfield government finances - Debt in 2018 (per resident):
- Long Term Debt - Beginning Outstanding - Unspecified Public Purpose: $12,574,000 ($649.52)
Outstanding Unspecified Public Purpose: $11,454,000 ($591.66)
Retired Unspecified Public Purpose: $1,120,000 ($57.85)
Greenfield government finances - Cash and Securities in 2018 (per resident):
- Bond Funds - Cash and Securities: $2,912,000 ($150.42)
- Other Funds - Cash and Securities: $21,663,000 ($1119.01)
4.96% of this county's 2021 resident taxpayers lived in other counties in 2020 ($91,945 average adjusted gross income)
| Here: | 4.96% |
| California average: | 5.19% |
0.08% of residents moved from foreign countries ($1,276 average AGI)
Monterey County: 0.08% California average: 0.03%
Top counties from which taxpayers relocated into this county between 2020 and 2021:
| from Santa Cruz County, CA | |
| from Santa Clara County, CA | |
| from Los Angeles County, CA |
6.17% of this county's 2020 resident taxpayers moved to other counties in 2021 ($76,219 average adjusted gross income)
| Here: | 6.17% |
| California average: | 6.14% |
0.08% of residents moved to foreign countries ($1,055 average AGI)
Monterey County: 0.08% California average: 0.02%
Top counties to which taxpayers relocated from this county between 2020 and 2021:
| to Santa Cruz County, CA | |
| to Santa Clara County, CA | |
| to Los Angeles County, CA |
| Businesses in Greenfield, CA | ||||
| Name | Count | Name | Count | |
|---|---|---|---|---|
| Burger King | 1 | RadioShack | 1 | |
| FedEx | 1 | Rite Aid | 1 | |
| GNC | 1 | True Value | 1 | |
| H&R Block | 1 | U-Haul | 2 | |
| Little Caesars Pizza | 1 | UPS | 1 | |
Strongest AM radio stations in Greenfield:
- KMBX (700 AM; 10 kW; SOLEDAD, CA; Owner: ENTRAVISION HOLDINGS, LLC)
- KKMC (880 AM; 10 kW; GONZALES, CA; Owner: MONTEREY COUNTY BROADCASTERS, INC.)
- KYAA (1200 AM; 25 kW; SOQUEL, CA; Owner: PEOPLE'S RADIO, INC.)
- KSRK (540 AM; 10 kW; CARMEL VALLEY, CA; Owner: PEOPLE'S RADIO, INC.)
- KDBV (980 AM; 10 kW; SALINAS, CA; Owner: WOLFHOUSE RADIO GROUP, INC.)
- KRKC (1490 AM; 1 kW; KING CITY, CA; Owner: RADIO DEL REY INCORPORATED)
- KLOK (1170 AM; 50 kW; SAN JOSE, CA; Owner: ENTRAVISION HOLDINGS, LLC)
- KNBR (680 AM; 50 kW; SAN FRANCISCO, CA; Owner: KNBR LICO, INC.)
- KMJ (580 AM; 50 kW; FRESNO, CA; Owner: INFINITY RADIO OPERATIONS INC.)
- KGO (810 AM; 50 kW; SAN FRANCISCO, CA; Owner: KGO-AM RADIO, INC.)
- KION (1460 AM; 10 kW; SALINAS, CA)
- KCBC (770 AM; 50 kW; RIVERBANK, CA; Owner: KIERTRON, INC.)
- KGDP (660 AM; 50 kW; ORCUTT, CA; Owner: RADIO REPRESENTATIVES, INC.)
Strongest FM radio stations in Greenfield:
- KHDV (93.9 FM; KING CITY, CA; Owner: WOLFHOUSE RADIO GROUP, INC.)
- KMJV (106.3 FM; SOLEDAD, CA; Owner: WOLFHOUSE RADIO GROUP, INC.)
- KSEA (107.9 FM; GREENFIELD, CA; Owner: FARMWORKER EDU'AL RADIO NETWORK, INC)
- K240AK (95.9 FM; SOLEDAD, CA; Owner: CALVARY CHAPEL OF TWIN FALLS, INC.)
- K265DK (100.9 FM; GREENFIELD, CA; Owner: CLEAR CHANNEL BROADCASTING LICENSES, INC.)
- KFRS (89.9 FM; SOLEDAD, CA; Owner: FAMILY STATIONS, INC.)
- K260AA (99.9 FM; CARMEL VALLEY, CA; Owner: ENTRAVISION HOLDINGS, LLC)
- KUSP (88.9 FM; SANTA CRUZ, CA; Owner: PATAPHYSICAL B/CING. FOUNDATION,INC.)
- KWAV (96.9 FM; MONTEREY, CA; Owner: BUCKLEY BROADCASTING OF MONTEREY)
- KTOM-FM (100.7 FM; SALINAS, CA; Owner: CLEAR CHANNEL BROADCASTING LICENSES, INC.)
- K291AE (106.1 FM; SEASIDE, CA; Owner: MAPELTON COMMUNICATIONS, LLC)
- KLOK-FM (99.5 FM; GREENFIELD, CA; Owner: ENTRAVISION HOLDINGS, LLC)
- KRKC-FM (102.1 FM; KING CITY, CA; Owner: KING CITY COMMUNICATIONS CORPORATION)
- KDON-FM (102.5 FM; SALINAS, CA; Owner: CLEAR CHANNEL BROADCASTING LICENSES, INC.)
- K202DU (88.3 FM; SAN JUAN BAUTISTA, CA; Owner: CALVARY CHAPEL OF TWIN FALLS, INC.)
- KDKL (88.3 FM; COALINGA, CA; Owner: EDUCATIONAL MEDIA FOUNDATION)
- KBTU (93.5 FM; HOLLISTER, CA; Owner: MAPLETON COMMUNICATIONS, L.L.C.)
- KBDH (91.7 FM; SAN ARDO, CA; Owner: PATAPHYSICAL BROADCASTING FOUNDATION)
- K206CC (89.1 FM; LOCKWOOD, CA; Owner: PRUNEDALE EDUC. F'DATION/CENTRAL CA)
- KLVM (89.7 FM; PRUNEDALE, CA; Owner: PRUNEDALE EDUCATIONAL ASSOCIATION)
TV broadcast stations around Greenfield:
- KMMD-CA (Channel 3; SALINAS, CA; Owner: CABALLERO TELEVISION TEXAS, L.L.C.)
- National Bridge Inventory (NBI) Statistics
- 15Number of bridges
- 220ft / 67.5mTotal length
- 238,733Total average daily traffic
- 25,211Total average daily truck traffic
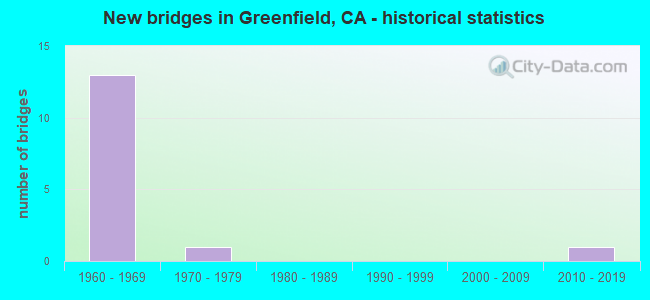
- New bridges - historical statistics
- 131960-1969
- 11970-1979
- 12010-2019
FCC Registered Cell Phone Towers:
1 (See the full list of FCC Registered Cell Phone Towers in Greenfield)FCC Registered Antenna Towers:
23 (See the full list of FCC Registered Antenna Towers)FCC Registered Commercial Land Mobile Towers:
2 (See the full list of FCC Registered Commercial Land Mobile Towers in Greenfield, CA)FCC Registered Private Land Mobile Towers:
2 (See the full list of FCC Registered Private Land Mobile Towers)FCC Registered Broadcast Land Mobile Towers:
15 (See the full list of FCC Registered Broadcast Land Mobile Towers)FCC Registered Microwave Towers:
16 (See the full list of FCC Registered Microwave Towers in this town)FCC Registered Amateur Radio Licenses:
8 (See the full list of FCC Registered Amateur Radio Licenses in Greenfield)FAA Registered Aircraft:
1- Aircraft: CESSNA 182K (Category: Land, Seats: 4, Weight: Up to 12,499 Pounds, Speed: 119 mph), Engine: CONT MOTOR O-470 SERIES (230 HP) (Reciprocating)
N-Number: 2685Q, N2685Q, N-2685Q, Serial Number: 18257885, Year manufactured: 1966, Airworthiness Date: 01/13/1967, Certificate Issue Date: 12/04/1979
Registrant (Co-Owned): J W Mcelmoyl, Po Box 305, Greenfield, CA 93927, Other Owners: Billie M Mcelmoyl
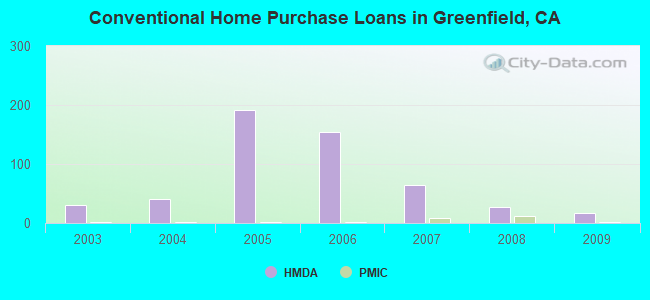
| Home Mortgage Disclosure Act Aggregated Statistics For Year 2009 (Based on 1 partial tract) | ||||||||||
| A) FHA, FSA/RHS & VA Home Purchase Loans | B) Conventional Home Purchase Loans | C) Refinancings | D) Home Improvement Loans | F) Non-occupant Loans on < 5 Family Dwellings (A B C & D) | ||||||
|---|---|---|---|---|---|---|---|---|---|---|
| Number | Average Value | Number | Average Value | Number | Average Value | Number | Average Value | Number | Average Value | |
| LOANS ORIGINATED | 44 | $183,905 | 17 | $127,443 | 9 | $192,269 | 2 | $32,795 | 10 | $105,147 |
| APPLICATIONS APPROVED, NOT ACCEPTED | 4 | $164,980 | 1 | $152,710 | 1 | $120,170 | 0 | $0 | 1 | $66,590 |
| APPLICATIONS DENIED | 8 | $164,168 | 9 | $148,263 | 9 | $182,533 | 1 | $45,060 | 3 | $111,490 |
| APPLICATIONS WITHDRAWN | 5 | $173,944 | 3 | $80,113 | 5 | $164,130 | 0 | $0 | 2 | $131,185 |
| FILES CLOSED FOR INCOMPLETENESS | 2 | $120,920 | 1 | $32,040 | 2 | $257,860 | 0 | $0 | 1 | $32,040 |
Detailed HMDA statistics for the following Tracts: 0112.02
| Private Mortgage Insurance Companies Aggregated Statistics For Year 2009 (Based on 1 partial tract) | ||||
| A) Conventional Home Purchase Loans | B) Refinancings | |||
|---|---|---|---|---|
| Number | Average Value | Number | Average Value | |
| LOANS ORIGINATED | 2 | $156,720 | 0 | $0 |
| APPLICATIONS APPROVED, NOT ACCEPTED | 2 | $153,215 | 1 | $70,100 |
| APPLICATIONS DENIED | 1 | $223,310 | 0 | $0 |
| APPLICATIONS WITHDRAWN | 3 | $95,133 | 0 | $0 |
| FILES CLOSED FOR INCOMPLETENESS | 0 | $0 | 0 | $0 |
Detailed PMIC statistics for the following Tracts: 0112.02
2004 - 2018 National Fire Incident Reporting System (NFIRS) incidents
- Fire incident types reported to NFIRS in Greenfield, CA
- 39442.2%Outside Fires
- 33335.7%Structure Fires
- 17218.4%Mobile Property/Vehicle Fires
- 343.6%Other
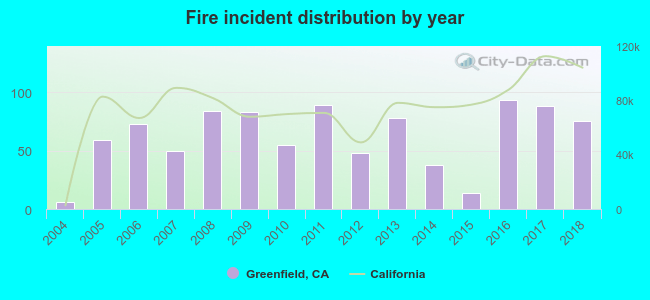 According to the data from the years 2004 - 2018 the average number of fires per year is 62. The highest number of reported fire incidents - 93 took place in 2016, and the least - 6 in 2004. The data has a rising trend.
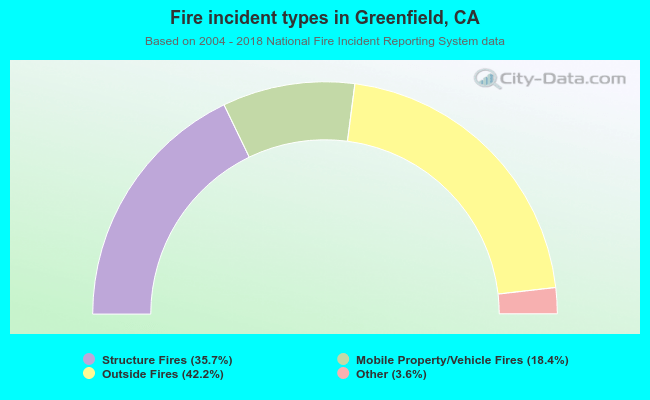 When looking into fire subcategories, the most incidents belonged to: Outside Fires (42.2%), and Structure Fires (35.7%).
| Most common first names in Greenfield, CA among deceased individuals | ||
| Name | Count | Lived (average) |
|---|---|---|
| Jose | 28 | 63.3 years |
| Maria | 26 | 71.7 years |
| John | 20 | 73.7 years |
| Mary | 18 | 81.3 years |
| William | 17 | 73.2 years |
| Robert | 16 | 70.0 years |
| Charles | 13 | 78.5 years |
| Francisco | 12 | 63.2 years |
| James | 11 | 73.8 years |
| Henry | 10 | 74.5 years |
| Most common last names in Greenfield, CA among deceased individuals | ||
| Last name | Count | Lived (average) |
|---|---|---|
| Hernandez | 16 | 68.2 years |
| Garcia | 11 | 70.6 years |
| Perez | 11 | 59.7 years |
| Martinez | 10 | 61.2 years |
| Williams | 9 | 75.5 years |
| Smith | 9 | 76.5 years |
| Pura | 8 | 78.7 years |
| Sanchez | 8 | 72.3 years |
| Lopez | 7 | 70.7 years |
| Brown | 7 | 77.3 years |
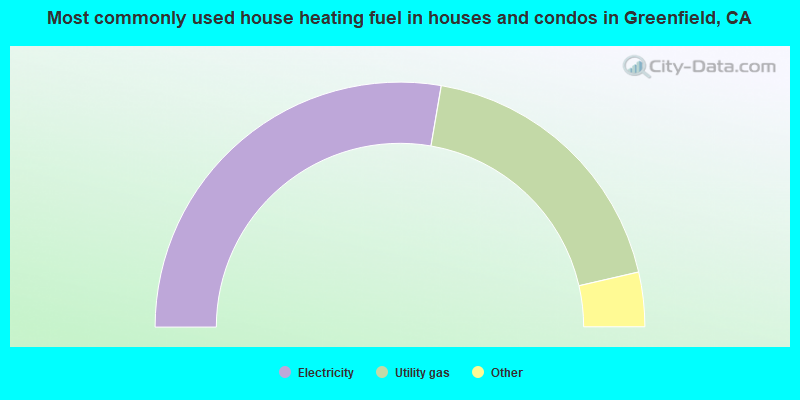
- 55.4%Electricity
- 37.4%Utility gas
- 3.4%Bottled, tank, or LP gas
- 2.2%Solar energy
- 1.2%No fuel used
- 0.4%Other fuel
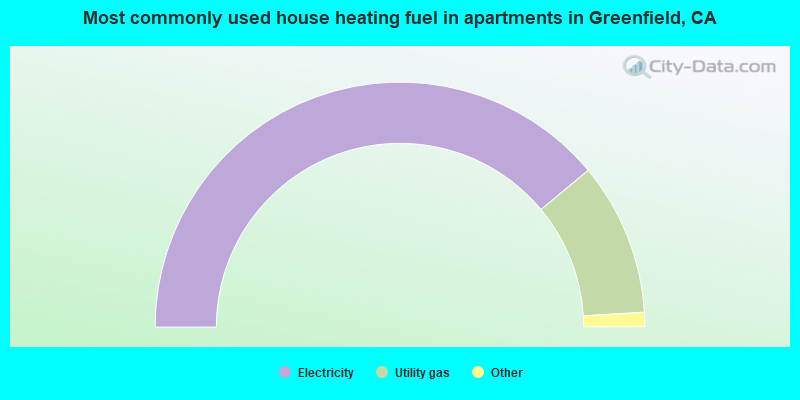
- 77.9%Electricity
- 20.2%Utility gas
- 1.5%Bottled, tank, or LP gas
- 0.4%Solar energy
Greenfield compared to California state average:
- Median house value below state average.
- Black race population percentage significantly below state average.
- Hispanic race population percentage significantly above state average.
- Median age below state average.
- Foreign-born population percentage significantly above state average.
- House age below state average.
- Percentage of population with a bachelor's degree or higher significantly below state average.
Greenfield on our top lists:
- #13 on the list of "Top 101 cities with largest percentage of females in industries: agriculture, forestry, fishing and hunting (population 5,000+)"
- #15 on the list of "Top 101 cities with largest percentage of females in occupations: farming, fishing, and forestry occupations (population 5,000+)"
- #21 on the list of "Top 101 cities with largest percentage of males in industries: agriculture, forestry, fishing and hunting (population 5,000+)"
- #25 on the list of "Top 101 cities with largest percentage of males in occupations: farming, fishing, and forestry occupations (population 5,000+)"
- #43 on the list of "Top 101 cities with the highest percentage of family households, population 10,000+"
- #57 on the list of "Top 101 cities with the lowest percentage of English-only speaking households, population 5,000+"
- #58 on the list of "Top 101 cities with the largest city-data.com crime index per police officer (population 5,000+)"
- #65 on the list of "Top 101 cities with the highest number of murders per 100,000 residents, excludes tourist destinations and others with a lot of outsiders visiting based on city industries data (population 5,000+)"
- #66 on the list of "Top 100 least-educated cities (pop. 5,000+)"
- #67 on the list of "Top 101 cities with the smallest percentage of divorced people (15+ years)(population 5,000+)"
- #76 on the list of "Top 101 cities with the lowest number of police officers per 1000 residents (population 5,000+)"
- #79 on the list of "Top 101 cities with largest percentage of females in occupations: material moving occupations (population 5,000+)"
- #100 on the list of "Top 101 cities with the least people having Master's or Doctorate degrees (population 5,000+)"
- #30 (93927) on the list of "Top 101 zip codes with the largest percentage of Scotch-Irish first ancestries (pop 5,000+)"
- #32 (93927) on the list of "Top 101 zip codes with the largest percentage of taxpayers using paid preparers for 2012 taxes (pop 5,000+)"
- #48 (93927) on the list of "Top 101 zip codes with the smallest percentage of taxpayers reporting profit/loss from business in 2012 (pop 5,000+)"
- #64 (93927) on the list of "Top 101 zip codes with the largest percentage of returns reporting salary or wage in 2012 (pop 5,000+)"
- #75 (93927) on the list of "Top 101 zip codes with the smallest percentage of taxpayers reporting net capital gain/loss in 2012 (pop 5,000+)"
- #15 on the list of "Top 101 counties with the highest Nitrogen Dioxide air pollution readings in 2012 (ppm)"
- #20 on the list of "Top 101 counties with the lowest surface withdrawal of fresh water for public supply (pop. 50,000+)"
- #33 on the list of "Top 101 counties with the highest number of births per 1000 residents 2007-2013"
- #44 on the list of "Top 101 counties with the lowest Particulate Matter (PM2.5) Annual air pollution readings in 2012 (µg/m3)"
- #54 on the list of "Top 101 counties with the highest Particulate Matter (PM10) Annual air pollution readings in 2012 (µg/m3)"

|
Total of 5 patent applications in 2008-2024.