Godfrey, Illinois Submit your own pictures of this village and show them to the world
OSM Map
General Map
Google Map
MSN Map
OSM Map
General Map
Google Map
MSN Map
OSM Map
General Map
Google Map
MSN Map
OSM Map
General Map
Google Map
MSN Map
Please wait while loading the map...
Population in 2022: 17,688 (87% urban, 13% rural). Population change since 2000: +8.6%Males: 8,661 Females: 9,027
March 2022 cost of living index in Godfrey: 95.2 (less than average, U.S. average is 100) Percentage of residents living in poverty in 2022: 6.7%for White Non-Hispanic residents , 8.5% for Black residents , 7.3% for Hispanic or Latino residents , 10.9% for two or more races residents )Business Search - 14 Million verified businesses
Data:
Median household income ($)
Median household income (% change since 2000)
Household income diversity
Ratio of average income to average house value (%)
Ratio of average income to average rent
Median household income ($) - White
Median household income ($) - Black or African American
Median household income ($) - Asian
Median household income ($) - Hispanic or Latino
Median household income ($) - American Indian and Alaska Native
Median household income ($) - Multirace
Median household income ($) - Other Race
Median household income for houses/condos with a mortgage ($)
Median household income for apartments without a mortgage ($)
Races - White alone (%)
Races - White alone (% change since 2000)
Races - Black alone (%)
Races - Black alone (% change since 2000)
Races - American Indian alone (%)
Races - American Indian alone (% change since 2000)
Races - Asian alone (%)
Races - Asian alone (% change since 2000)
Races - Hispanic (%)
Races - Hispanic (% change since 2000)
Races - Native Hawaiian and Other Pacific Islander alone (%)
Races - Native Hawaiian and Other Pacific Islander alone (% change since 2000)
Races - Two or more races (%)
Races - Two or more races (% change since 2000)
Races - Other race alone (%)
Races - Other race alone (% change since 2000)
Racial diversity
Unemployment (%)
Unemployment (% change since 2000)
Unemployment (%) - White
Unemployment (%) - Black or African American
Unemployment (%) - Asian
Unemployment (%) - Hispanic or Latino
Unemployment (%) - American Indian and Alaska Native
Unemployment (%) - Multirace
Unemployment (%) - Other Race
Population density (people per square mile)
Population - Males (%)
Population - Females (%)
Population - Males (%) - White
Population - Males (%) - Black or African American
Population - Males (%) - Asian
Population - Males (%) - Hispanic or Latino
Population - Males (%) - American Indian and Alaska Native
Population - Males (%) - Multirace
Population - Males (%) - Other Race
Population - Females (%) - White
Population - Females (%) - Black or African American
Population - Females (%) - Asian
Population - Females (%) - Hispanic or Latino
Population - Females (%) - American Indian and Alaska Native
Population - Females (%) - Multirace
Population - Females (%) - Other Race
Coronavirus confirmed cases (Jul 04, 2024)
Deaths caused by coronavirus (Jul 04, 2024)
Coronavirus confirmed cases (per 100k population) (Jul 04, 2024)
Deaths caused by coronavirus (per 100k population) (Jul 04, 2024)
Daily increase in number of cases (Jul 04, 2024)
Weekly increase in number of cases (Jul 04, 2024)
Cases doubled (in days) (Jul 04, 2024)
Hospitalized patients (Apr 18, 2022)
Negative test results (Apr 18, 2022)
Total test results (Apr 18, 2022)
COVID Vaccine doses distributed (per 100k population) (Sep 19, 2023)
COVID Vaccine doses administered (per 100k population) (Sep 19, 2023)
COVID Vaccine doses distributed (Sep 19, 2023)
COVID Vaccine doses administered (Sep 19, 2023)
Likely homosexual households (%)
Likely homosexual households (% change since 2000)
Likely homosexual households - Lesbian couples (%)
Likely homosexual households - Lesbian couples (% change since 2000)
Likely homosexual households - Gay men (%)
Likely homosexual households - Gay men (% change since 2000)
Cost of living index
Median gross rent ($)
Median contract rent ($)
Median monthly housing costs ($)
Median house or condo value ($)
Median house or condo value ($ change since 2000)
Mean house or condo value by units in structure - 1, detached ($)
Mean house or condo value by units in structure - 1, attached ($)
Mean house or condo value by units in structure - 2 ($)
Mean house or condo value by units in structure by units in structure - 3 or 4 ($)
Mean house or condo value by units in structure - 5 or more ($)
Mean house or condo value by units in structure - Boat, RV, van, etc. ($)
Mean house or condo value by units in structure - Mobile home ($)
Median house or condo value ($) - White
Median house or condo value ($) - Black or African American
Median house or condo value ($) - Asian
Median house or condo value ($) - Hispanic or Latino
Median house or condo value ($) - American Indian and Alaska Native
Median house or condo value ($) - Multirace
Median house or condo value ($) - Other Race
Median resident age
Resident age diversity
Median resident age - Males
Median resident age - Females
Median resident age - White
Median resident age - Black or African American
Median resident age - Asian
Median resident age - Hispanic or Latino
Median resident age - American Indian and Alaska Native
Median resident age - Multirace
Median resident age - Other Race
Median resident age - Males - White
Median resident age - Males - Black or African American
Median resident age - Males - Asian
Median resident age - Males - Hispanic or Latino
Median resident age - Males - American Indian and Alaska Native
Median resident age - Males - Multirace
Median resident age - Males - Other Race
Median resident age - Females - White
Median resident age - Females - Black or African American
Median resident age - Females - Asian
Median resident age - Females - Hispanic or Latino
Median resident age - Females - American Indian and Alaska Native
Median resident age - Females - Multirace
Median resident age - Females - Other Race
Commute - mean travel time to work (minutes)
Travel time to work - Less than 5 minutes (%)
Travel time to work - Less than 5 minutes (% change since 2000)
Travel time to work - 5 to 9 minutes (%)
Travel time to work - 5 to 9 minutes (% change since 2000)
Travel time to work - 10 to 19 minutes (%)
Travel time to work - 10 to 19 minutes (% change since 2000)
Travel time to work - 20 to 29 minutes (%)
Travel time to work - 20 to 29 minutes (% change since 2000)
Travel time to work - 30 to 39 minutes (%)
Travel time to work - 30 to 39 minutes (% change since 2000)
Travel time to work - 40 to 59 minutes (%)
Travel time to work - 40 to 59 minutes (% change since 2000)
Travel time to work - 60 to 89 minutes (%)
Travel time to work - 60 to 89 minutes (% change since 2000)
Travel time to work - 90 or more minutes (%)
Travel time to work - 90 or more minutes (% change since 2000)
Marital status - Never married (%)
Marital status - Now married (%)
Marital status - Separated (%)
Marital status - Widowed (%)
Marital status - Divorced (%)
Median family income ($)
Median family income (% change since 2000)
Median non-family income ($)
Median non-family income (% change since 2000)
Median per capita income ($)
Median per capita income (% change since 2000)
Median family income ($) - White
Median family income ($) - Black or African American
Median family income ($) - Asian
Median family income ($) - Hispanic or Latino
Median family income ($) - American Indian and Alaska Native
Median family income ($) - Multirace
Median family income ($) - Other Race
Median year house/condo built
Median year apartment built
Year house built - Built 2005 or later (%)
Year house built - Built 2000 to 2004 (%)
Year house built - Built 1990 to 1999 (%)
Year house built - Built 1980 to 1989 (%)
Year house built - Built 1970 to 1979 (%)
Year house built - Built 1960 to 1969 (%)
Year house built - Built 1950 to 1959 (%)
Year house built - Built 1940 to 1949 (%)
Year house built - Built 1939 or earlier (%)
Average household size
Household density (households per square mile)
Average household size - White
Average household size - Black or African American
Average household size - Asian
Average household size - Hispanic or Latino
Average household size - American Indian and Alaska Native
Average household size - Multirace
Average household size - Other Race
Occupied housing units (%)
Vacant housing units (%)
Owner occupied housing units (%)
Renter occupied housing units (%)
Vacancy status - For rent (%)
Vacancy status - For sale only (%)
Vacancy status - Rented or sold, not occupied (%)
Vacancy status - For seasonal, recreational, or occasional use (%)
Vacancy status - For migrant workers (%)
Vacancy status - Other vacant (%)
Residents with income below the poverty level (%)
Residents with income below 50% of the poverty level (%)
Children below poverty level (%)
Poor families by family type - Married-couple family (%)
Poor families by family type - Male, no wife present (%)
Poor families by family type - Female, no husband present (%)
Poverty status for native-born residents (%)
Poverty status for foreign-born residents (%)
Poverty among high school graduates not in families (%)
Poverty among people who did not graduate high school not in families (%)
Residents with income below the poverty level (%) - White
Residents with income below the poverty level (%) - Black or African American
Residents with income below the poverty level (%) - Asian
Residents with income below the poverty level (%) - Hispanic or Latino
Residents with income below the poverty level (%) - American Indian and Alaska Native
Residents with income below the poverty level (%) - Multirace
Residents with income below the poverty level (%) - Other Race
Air pollution - Air Quality Index (AQI)
Air pollution - CO
Air pollution - NO2
Air pollution - SO2
Air pollution - Ozone
Air pollution - PM10
Air pollution - PM25
Air pollution - Pb
Crime - Murders per 100,000 population
Crime - Rapes per 100,000 population
Crime - Robberies per 100,000 population
Crime - Assaults per 100,000 population
Crime - Burglaries per 100,000 population
Crime - Thefts per 100,000 population
Crime - Auto thefts per 100,000 population
Crime - Arson per 100,000 population
Crime - City-data.com crime index
Crime - Violent crime index
Crime - Property crime index
Crime - Murders per 100,000 population (5 year average)
Crime - Rapes per 100,000 population (5 year average)
Crime - Robberies per 100,000 population (5 year average)
Crime - Assaults per 100,000 population (5 year average)
Crime - Burglaries per 100,000 population (5 year average)
Crime - Thefts per 100,000 population (5 year average)
Crime - Auto thefts per 100,000 population (5 year average)
Crime - Arson per 100,000 population (5 year average)
Crime - City-data.com crime index (5 year average)
Crime - Violent crime index (5 year average)
Crime - Property crime index (5 year average)
1996 Presidential Elections Results (%) - Democratic Party (Clinton)
1996 Presidential Elections Results (%) - Republican Party (Dole)
1996 Presidential Elections Results (%) - Other
2000 Presidential Elections Results (%) - Democratic Party (Gore)
2000 Presidential Elections Results (%) - Republican Party (Bush)
2000 Presidential Elections Results (%) - Other
2004 Presidential Elections Results (%) - Democratic Party (Kerry)
2004 Presidential Elections Results (%) - Republican Party (Bush)
2004 Presidential Elections Results (%) - Other
2008 Presidential Elections Results (%) - Democratic Party (Obama)
2008 Presidential Elections Results (%) - Republican Party (McCain)
2008 Presidential Elections Results (%) - Other
2012 Presidential Elections Results (%) - Democratic Party (Obama)
2012 Presidential Elections Results (%) - Republican Party (Romney)
2012 Presidential Elections Results (%) - Other
2016 Presidential Elections Results (%) - Democratic Party (Clinton)
2016 Presidential Elections Results (%) - Republican Party (Trump)
2016 Presidential Elections Results (%) - Other
2020 Presidential Elections Results (%) - Democratic Party (Biden)
2020 Presidential Elections Results (%) - Republican Party (Trump)
2020 Presidential Elections Results (%) - Other
Ancestries Reported - Arab (%)
Ancestries Reported - Czech (%)
Ancestries Reported - Danish (%)
Ancestries Reported - Dutch (%)
Ancestries Reported - English (%)
Ancestries Reported - French (%)
Ancestries Reported - French Canadian (%)
Ancestries Reported - German (%)
Ancestries Reported - Greek (%)
Ancestries Reported - Hungarian (%)
Ancestries Reported - Irish (%)
Ancestries Reported - Italian (%)
Ancestries Reported - Lithuanian (%)
Ancestries Reported - Norwegian (%)
Ancestries Reported - Polish (%)
Ancestries Reported - Portuguese (%)
Ancestries Reported - Russian (%)
Ancestries Reported - Scotch-Irish (%)
Ancestries Reported - Scottish (%)
Ancestries Reported - Slovak (%)
Ancestries Reported - Subsaharan African (%)
Ancestries Reported - Swedish (%)
Ancestries Reported - Swiss (%)
Ancestries Reported - Ukrainian (%)
Ancestries Reported - United States (%)
Ancestries Reported - Welsh (%)
Ancestries Reported - West Indian (%)
Ancestries Reported - Other (%)
Educational Attainment - No schooling completed (%)
Educational Attainment - Less than high school (%)
Educational Attainment - High school or equivalent (%)
Educational Attainment - Less than 1 year of college (%)
Educational Attainment - 1 or more years of college (%)
Educational Attainment - Associate degree (%)
Educational Attainment - Bachelor's degree (%)
Educational Attainment - Master's degree (%)
Educational Attainment - Professional school degree (%)
Educational Attainment - Doctorate degree (%)
School Enrollment - Nursery, preschool (%)
School Enrollment - Kindergarten (%)
School Enrollment - Grade 1 to 4 (%)
School Enrollment - Grade 5 to 8 (%)
School Enrollment - Grade 9 to 12 (%)
School Enrollment - College undergrad (%)
School Enrollment - Graduate or professional (%)
School Enrollment - Not enrolled in school (%)
School enrollment - Public schools (%)
School enrollment - Private schools (%)
School enrollment - Not enrolled (%)
Median number of rooms in houses and condos
Median number of rooms in apartments
Housing units lacking complete plumbing facilities (%)
Housing units lacking complete kitchen facilities (%)
Density of houses
Urban houses (%)
Rural houses (%)
Households with people 60 years and over (%)
Households with people 65 years and over (%)
Households with people 75 years and over (%)
Households with one or more nonrelatives (%)
Households with no nonrelatives (%)
Population in households (%)
Family households (%)
Nonfamily households (%)
Population in families (%)
Family households with own children (%)
Median number of bedrooms in owner occupied houses
Mean number of bedrooms in owner occupied houses
Median number of bedrooms in renter occupied houses
Mean number of bedrooms in renter occupied houses
Median number of vehichles in owner occupied houses
Mean number of vehichles in owner occupied houses
Median number of vehichles in renter occupied houses
Mean number of vehichles in renter occupied houses
Mortgage status - with mortgage (%)
Mortgage status - with second mortgage (%)
Mortgage status - with home equity loan (%)
Mortgage status - with both second mortgage and home equity loan (%)
Mortgage status - without a mortgage (%)
Average family size
Average family size - White
Average family size - Black or African American
Average family size - Asian
Average family size - Hispanic or Latino
Average family size - American Indian and Alaska Native
Average family size - Multirace
Average family size - Other Race
Geographical mobility - Same house 1 year ago (%)
Geographical mobility - Moved within same county (%)
Geographical mobility - Moved from different county within same state (%)
Geographical mobility - Moved from different state (%)
Geographical mobility - Moved from abroad (%)
Place of birth - Born in state of residence (%)
Place of birth - Born in other state (%)
Place of birth - Native, outside of US (%)
Place of birth - Foreign born (%)
Housing units in structures - 1, detached (%)
Housing units in structures - 1, attached (%)
Housing units in structures - 2 (%)
Housing units in structures - 3 or 4 (%)
Housing units in structures - 5 to 9 (%)
Housing units in structures - 10 to 19 (%)
Housing units in structures - 20 to 49 (%)
Housing units in structures - 50 or more (%)
Housing units in structures - Mobile home (%)
Housing units in structures - Boat, RV, van, etc. (%)
House/condo owner moved in on average (years ago)
Renter moved in on average (years ago)
Year householder moved into unit - Moved in 1999 to March 2000 (%)
Year householder moved into unit - Moved in 1995 to 1998 (%)
Year householder moved into unit - Moved in 1990 to 1994 (%)
Year householder moved into unit - Moved in 1980 to 1989 (%)
Year householder moved into unit - Moved in 1970 to 1979 (%)
Year householder moved into unit - Moved in 1969 or earlier (%)
Means of transportation to work - Drove car alone (%)
Means of transportation to work - Carpooled (%)
Means of transportation to work - Public transportation (%)
Means of transportation to work - Bus or trolley bus (%)
Means of transportation to work - Streetcar or trolley car (%)
Means of transportation to work - Subway or elevated (%)
Means of transportation to work - Railroad (%)
Means of transportation to work - Ferryboat (%)
Means of transportation to work - Taxicab (%)
Means of transportation to work - Motorcycle (%)
Means of transportation to work - Bicycle (%)
Means of transportation to work - Walked (%)
Means of transportation to work - Other means (%)
Working at home (%)
Industry diversity
Most Common Industries - Agriculture, forestry, fishing and hunting, and mining (%)
Most Common Industries - Agriculture, forestry, fishing and hunting (%)
Most Common Industries - Mining, quarrying, and oil and gas extraction (%)
Most Common Industries - Construction (%)
Most Common Industries - Manufacturing (%)
Most Common Industries - Wholesale trade (%)
Most Common Industries - Retail trade (%)
Most Common Industries - Transportation and warehousing, and utilities (%)
Most Common Industries - Transportation and warehousing (%)
Most Common Industries - Utilities (%)
Most Common Industries - Information (%)
Most Common Industries - Finance and insurance, and real estate and rental and leasing (%)
Most Common Industries - Finance and insurance (%)
Most Common Industries - Real estate and rental and leasing (%)
Most Common Industries - Professional, scientific, and management, and administrative and waste management services (%)
Most Common Industries - Professional, scientific, and technical services (%)
Most Common Industries - Management of companies and enterprises (%)
Most Common Industries - Administrative and support and waste management services (%)
Most Common Industries - Educational services, and health care and social assistance (%)
Most Common Industries - Educational services (%)
Most Common Industries - Health care and social assistance (%)
Most Common Industries - Arts, entertainment, and recreation, and accommodation and food services (%)
Most Common Industries - Arts, entertainment, and recreation (%)
Most Common Industries - Accommodation and food services (%)
Most Common Industries - Other services, except public administration (%)
Most Common Industries - Public administration (%)
Occupation diversity
Most Common Occupations - Management, business, science, and arts occupations (%)
Most Common Occupations - Management, business, and financial occupations (%)
Most Common Occupations - Management occupations (%)
Most Common Occupations - Business and financial operations occupations (%)
Most Common Occupations - Computer, engineering, and science occupations (%)
Most Common Occupations - Computer and mathematical occupations (%)
Most Common Occupations - Architecture and engineering occupations (%)
Most Common Occupations - Life, physical, and social science occupations (%)
Most Common Occupations - Education, legal, community service, arts, and media occupations (%)
Most Common Occupations - Community and social service occupations (%)
Most Common Occupations - Legal occupations (%)
Most Common Occupations - Education, training, and library occupations (%)
Most Common Occupations - Arts, design, entertainment, sports, and media occupations (%)
Most Common Occupations - Healthcare practitioners and technical occupations (%)
Most Common Occupations - Health diagnosing and treating practitioners and other technical occupations (%)
Most Common Occupations - Health technologists and technicians (%)
Most Common Occupations - Service occupations (%)
Most Common Occupations - Healthcare support occupations (%)
Most Common Occupations - Protective service occupations (%)
Most Common Occupations - Fire fighting and prevention, and other protective service workers including supervisors (%)
Most Common Occupations - Law enforcement workers including supervisors (%)
Most Common Occupations - Food preparation and serving related occupations (%)
Most Common Occupations - Building and grounds cleaning and maintenance occupations (%)
Most Common Occupations - Personal care and service occupations (%)
Most Common Occupations - Sales and office occupations (%)
Most Common Occupations - Sales and related occupations (%)
Most Common Occupations - Office and administrative support occupations (%)
Most Common Occupations - Natural resources, construction, and maintenance occupations (%)
Most Common Occupations - Farming, fishing, and forestry occupations (%)
Most Common Occupations - Construction and extraction occupations (%)
Most Common Occupations - Installation, maintenance, and repair occupations (%)
Most Common Occupations - Production, transportation, and material moving occupations (%)
Most Common Occupations - Production occupations (%)
Most Common Occupations - Transportation occupations (%)
Most Common Occupations - Material moving occupations (%)
People in Group quarters - Institutionalized population (%)
People in Group quarters - Correctional institutions (%)
People in Group quarters - Federal prisons and detention centers (%)
People in Group quarters - Halfway houses (%)
People in Group quarters - Local jails and other confinement facilities (including police lockups) (%)
People in Group quarters - Military disciplinary barracks (%)
People in Group quarters - State prisons (%)
People in Group quarters - Other types of correctional institutions (%)
People in Group quarters - Nursing homes (%)
People in Group quarters - Hospitals/wards, hospices, and schools for the handicapped (%)
People in Group quarters - Hospitals/wards and hospices for chronically ill (%)
People in Group quarters - Hospices or homes for chronically ill (%)
People in Group quarters - Military hospitals or wards for chronically ill (%)
People in Group quarters - Other hospitals or wards for chronically ill (%)
People in Group quarters - Hospitals or wards for drug/alcohol abuse (%)
People in Group quarters - Mental (Psychiatric) hospitals or wards (%)
People in Group quarters - Schools, hospitals, or wards for the mentally retarded (%)
People in Group quarters - Schools, hospitals, or wards for the physically handicapped (%)
People in Group quarters - Institutions for the deaf (%)
People in Group quarters - Institutions for the blind (%)
People in Group quarters - Orthopedic wards and institutions for the physically handicapped (%)
People in Group quarters - Wards in general hospitals for patients who have no usual home elsewhere (%)
People in Group quarters - Wards in military hospitals for patients who have no usual home elsewhere (%)
People in Group quarters - Juvenile institutions (%)
People in Group quarters - Long-term care (%)
People in Group quarters - Homes for abused, dependent, and neglected children (%)
People in Group quarters - Residential treatment centers for emotionally disturbed children (%)
People in Group quarters - Training schools for juvenile delinquents (%)
People in Group quarters - Short-term care, detention or diagnostic centers for delinquent children (%)
People in Group quarters - Type of juvenile institution unknown (%)
People in Group quarters - Noninstitutionalized population (%)
People in Group quarters - College dormitories (includes college quarters off campus) (%)
People in Group quarters - Military quarters (%)
People in Group quarters - On base (%)
People in Group quarters - Barracks, unaccompanied personnel housing (UPH), (Enlisted/Officer), ;and similar group living quarters for military personnel (%)
People in Group quarters - Transient quarters for temporary residents (%)
People in Group quarters - Military ships (%)
People in Group quarters - Group homes (%)
People in Group quarters - Homes or halfway houses for drug/alcohol abuse (%)
People in Group quarters - Homes for the mentally ill (%)
People in Group quarters - Homes for the mentally retarded (%)
People in Group quarters - Homes for the physically handicapped (%)
People in Group quarters - Other group homes (%)
People in Group quarters - Religious group quarters (%)
People in Group quarters - Dormitories (%)
People in Group quarters - Agriculture workers' dormitories on farms (%)
People in Group quarters - Job Corps and vocational training facilities (%)
People in Group quarters - Other workers' dormitories (%)
People in Group quarters - Crews of maritime vessels (%)
People in Group quarters - Other nonhousehold living situations (%)
People in Group quarters - Other noninstitutional group quarters (%)
Residents speaking English at home (%)
Residents speaking English at home - Born in the United States (%)
Residents speaking English at home - Native, born elsewhere (%)
Residents speaking English at home - Foreign born (%)
Residents speaking Spanish at home (%)
Residents speaking Spanish at home - Born in the United States (%)
Residents speaking Spanish at home - Native, born elsewhere (%)
Residents speaking Spanish at home - Foreign born (%)
Residents speaking other language at home (%)
Residents speaking other language at home - Born in the United States (%)
Residents speaking other language at home - Native, born elsewhere (%)
Residents speaking other language at home - Foreign born (%)
Class of Workers - Employee of private company (%)
Class of Workers - Self-employed in own incorporated business (%)
Class of Workers - Private not-for-profit wage and salary workers (%)
Class of Workers - Local government workers (%)
Class of Workers - State government workers (%)
Class of Workers - Federal government workers (%)
Class of Workers - Self-employed workers in own not incorporated business and Unpaid family workers (%)
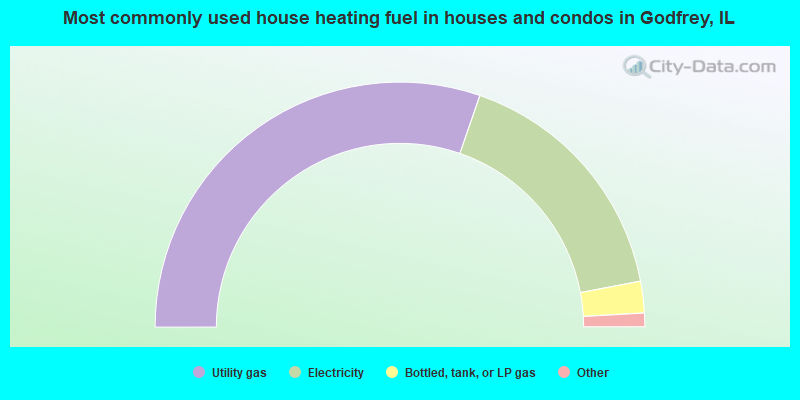
House heating fuel used in houses and condos - Utility gas (%)
House heating fuel used in houses and condos - Bottled, tank, or LP gas (%)
House heating fuel used in houses and condos - Electricity (%)
House heating fuel used in houses and condos - Fuel oil, kerosene, etc. (%)
House heating fuel used in houses and condos - Coal or coke (%)
House heating fuel used in houses and condos - Wood (%)
House heating fuel used in houses and condos - Solar energy (%)
House heating fuel used in houses and condos - Other fuel (%)
House heating fuel used in houses and condos - No fuel used (%)
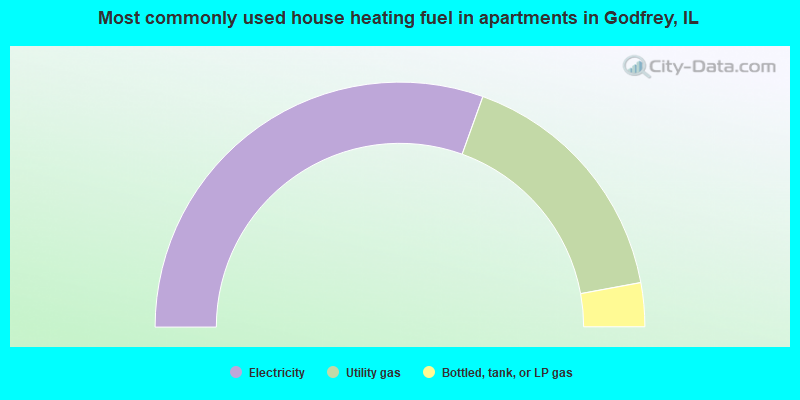
House heating fuel used in apartments - Utility gas (%)
House heating fuel used in apartments - Bottled, tank, or LP gas (%)
House heating fuel used in apartments - Electricity (%)
House heating fuel used in apartments - Fuel oil, kerosene, etc. (%)
House heating fuel used in apartments - Coal or coke (%)
House heating fuel used in apartments - Wood (%)
House heating fuel used in apartments - Solar energy (%)
House heating fuel used in apartments - Other fuel (%)
House heating fuel used in apartments - No fuel used (%)
Armed forces status - In Armed Forces (%)
Armed forces status - Civilian (%)
Armed forces status - Civilian - Veteran (%)
Armed forces status - Civilian - Nonveteran (%)
Fatal accidents locations in years 2005-2021
Fatal accidents locations in 2005
Fatal accidents locations in 2006
Fatal accidents locations in 2007
Fatal accidents locations in 2008
Fatal accidents locations in 2009
Fatal accidents locations in 2010
Fatal accidents locations in 2011
Fatal accidents locations in 2012
Fatal accidents locations in 2013
Fatal accidents locations in 2014
Fatal accidents locations in 2015
Fatal accidents locations in 2016
Fatal accidents locations in 2017
Fatal accidents locations in 2018
Fatal accidents locations in 2019
Fatal accidents locations in 2020
Fatal accidents locations in 2021
Alcohol use - People drinking some alcohol every month (%)
Alcohol use - People not drinking at all (%)
Alcohol use - Average days/month drinking alcohol
Alcohol use - Average drinks/week
Alcohol use - Average days/year people drink much
Audiometry - Average condition of hearing (%)
Audiometry - People that can hear a whisper from across a quiet room (%)
Audiometry - People that can hear normal voice from across a quiet room (%)
Audiometry - Ears ringing, roaring, buzzing (%)
Audiometry - Had a job exposure to loud noise (%)
Audiometry - Had off-work exposure to loud noise (%)
Blood Pressure & Cholesterol - Has high blood pressure (%)
Blood Pressure & Cholesterol - Checking blood pressure at home (%)
Blood Pressure & Cholesterol - Frequently checking blood cholesterol (%)
Blood Pressure & Cholesterol - Has high cholesterol level (%)
Consumer Behavior - Money monthly spent on food at supermarket/grocery store
Consumer Behavior - Money monthly spent on food at other stores
Consumer Behavior - Money monthly spent on eating out
Consumer Behavior - Money monthly spent on carryout/delivered foods
Consumer Behavior - Income spent on food at supermarket/grocery store (%)
Consumer Behavior - Income spent on food at other stores (%)
Consumer Behavior - Income spent on eating out (%)
Consumer Behavior - Income spent on carryout/delivered foods (%)
Current Health Status - General health condition (%)
Current Health Status - Blood donors (%)
Current Health Status - Has blood ever tested for HIV virus (%)
Current Health Status - Left-handed people (%)
Dermatology - People using sunscreen (%)
Diabetes - Diabetics (%)
Diabetes - Had a blood test for high blood sugar (%)
Diabetes - People taking insulin (%)
Diet Behavior & Nutrition - Diet health (%)
Diet Behavior & Nutrition - Milk product consumption (# of products/month)
Diet Behavior & Nutrition - Meals not home prepared (#/week)
Diet Behavior & Nutrition - Meals from fast food or pizza place (#/week)
Diet Behavior & Nutrition - Ready-to-eat foods (#/month)
Diet Behavior & Nutrition - Frozen meals/pizza (#/month)
Drug Use - People that ever used marijuana or hashish (%)
Drug Use - Ever used hard drugs (%)
Drug Use - Ever used any form of cocaine (%)
Drug Use - Ever used heroin (%)
Drug Use - Ever used methamphetamine (%)
Health Insurance - People covered by health insurance (%)
Kidney Conditions-Urology - Avg. # of times urinating at night
Medical Conditions - People with asthma (%)
Medical Conditions - People with anemia (%)
Medical Conditions - People with psoriasis (%)
Medical Conditions - People with overweight (%)
Medical Conditions - Elderly people having difficulties in thinking or remembering (%)
Medical Conditions - People who ever received blood transfusion (%)
Medical Conditions - People having trouble seeing even with glass/contacts (%)
Medical Conditions - People with arthritis (%)
Medical Conditions - People with gout (%)
Medical Conditions - People with congestive heart failure (%)
Medical Conditions - People with coronary heart disease (%)
Medical Conditions - People with angina pectoris (%)
Medical Conditions - People who ever had heart attack (%)
Medical Conditions - People who ever had stroke (%)
Medical Conditions - People with emphysema (%)
Medical Conditions - People with thyroid problem (%)
Medical Conditions - People with chronic bronchitis (%)
Medical Conditions - People with any liver condition (%)
Medical Conditions - People who ever had cancer or malignancy (%)
Mental Health - People who have little interest in doing things (%)
Mental Health - People feeling down, depressed, or hopeless (%)
Mental Health - People who have trouble sleeping or sleeping too much (%)
Mental Health - People feeling tired or having little energy (%)
Mental Health - People with poor appetite or overeating (%)
Mental Health - People feeling bad about themself (%)
Mental Health - People who have trouble concentrating on things (%)
Mental Health - People moving or speaking slowly or too fast (%)
Mental Health - People having thoughts they would be better off dead (%)
Oral Health - Average years since last visit a dentist
Oral Health - People embarrassed because of mouth (%)
Oral Health - People with gum disease (%)
Oral Health - General health of teeth and gums (%)
Oral Health - Average days a week using dental floss/device
Oral Health - Average days a week using mouthwash for dental problem
Oral Health - Average number of teeth
Pesticide Use - Households using pesticides to control insects (%)
Pesticide Use - Households using pesticides to kill weeds (%)
Physical Activity - People doing vigorous-intensity work activities (%)
Physical Activity - People doing moderate-intensity work activities (%)
Physical Activity - People walking or bicycling (%)
Physical Activity - People doing vigorous-intensity recreational activities (%)
Physical Activity - People doing moderate-intensity recreational activities (%)
Physical Activity - Average hours a day doing sedentary activities
Physical Activity - Average hours a day watching TV or videos
Physical Activity - Average hours a day using computer
Physical Functioning - People having limitations keeping them from working (%)
Physical Functioning - People limited in amount of work they can do (%)
Physical Functioning - People that need special equipment to walk (%)
Physical Functioning - People experiencing confusion/memory problems (%)
Physical Functioning - People requiring special healthcare equipment (%)
Prescription Medications - Average number of prescription medicines taking
Preventive Aspirin Use - Adults 40+ taking low-dose aspirin (%)
Reproductive Health - Vaginal deliveries (%)
Reproductive Health - Cesarean deliveries (%)
Reproductive Health - Deliveries resulted in a live birth (%)
Reproductive Health - Pregnancies resulted in a delivery (%)
Reproductive Health - Women breastfeeding newborns (%)
Reproductive Health - Women that had a hysterectomy (%)
Reproductive Health - Women that had both ovaries removed (%)
Reproductive Health - Women that have ever taken birth control pills (%)
Reproductive Health - Women taking birth control pills (%)
Reproductive Health - Women that have ever used Depo-Provera or injectables (%)
Reproductive Health - Women that have ever used female hormones (%)
Sexual Behavior - People 18+ that ever had sex (vaginal, anal, or oral) (%)
Sexual Behavior - Males 18+ that ever had vaginal sex with a woman (%)
Sexual Behavior - Males 18+ that ever performed oral sex on a woman (%)
Sexual Behavior - Males 18+ that ever had anal sex with a woman (%)
Sexual Behavior - Males 18+ that ever had any sex with a man (%)
Sexual Behavior - Females 18+ that ever had vaginal sex with a man (%)
Sexual Behavior - Females 18+ that ever performed oral sex on a man (%)
Sexual Behavior - Females 18+ that ever had anal sex with a man (%)
Sexual Behavior - Females 18+ that ever had any kind of sex with a woman (%)
Sexual Behavior - Average age people first had sex
Sexual Behavior - Average number of female sex partners in lifetime (males 18+)
Sexual Behavior - Average number of female vaginal sex partners in lifetime (males 18+)
Sexual Behavior - Average age people first performed oral sex on a woman (18+)
Sexual Behavior - Average number of woman performed oral sex on in lifetime (18+)
Sexual Behavior - Average number of male sex partners in lifetime (males 18+)
Sexual Behavior - Average number of male anal sex partners in lifetime (males 18+)
Sexual Behavior - Average age people first performed oral sex on a man (18+)
Sexual Behavior - Average number of male oral sex partners in lifetime (18+)
Sexual Behavior - People using protection when performing oral sex (%)
Sexual Behavior - Average number of times people have vaginal or anal sex a year
Sexual Behavior - People having sex without condom (%)
Sexual Behavior - Average number of male sex partners in lifetime (females 18+)
Sexual Behavior - Average number of male vaginal sex partners in lifetime (females 18+)
Sexual Behavior - Average number of female sex partners in lifetime (females 18+)
Sexual Behavior - Circumcised males 18+ (%)
Sleep Disorders - Average hours sleeping at night
Sleep Disorders - People that has trouble sleeping (%)
Smoking-Cigarette Use - People smoking cigarettes (%)
Taste & Smell - People 40+ having problems with smell (%)
Taste & Smell - People 40+ having problems with taste (%)
Taste & Smell - People 40+ that ever had wisdom teeth removed (%)
Taste & Smell - People 40+ that ever had tonsils teeth removed (%)
Taste & Smell - People 40+ that ever had a loss of consciousness because of a head injury (%)
Taste & Smell - People 40+ that ever had a broken nose or other serious injury to face or skull (%)
Taste & Smell - People 40+ that ever had two or more sinus infections (%)
Weight - Average height (inches)
Weight - Average weight (pounds)
Weight - Average BMI
Weight - People that are obese (%)
Weight - People that ever were obese (%)
Weight - People trying to lose weight (%)
According to our research of Illinois and other state lists, there were 16 registered sex offenders living in Godfrey, Illinois as of July 04, 2024 . The ratio of all residents to sex offenders in Godfrey is 1,109 to 1.The ratio of registered sex offenders to all residents in this city is lower than the state average.
Latest news from Godfrey, IL collected exclusively by city-data.com from local newspapers, TV, and radio stations
Ancestries: German (22.7%), American (13.8%), English (10.4%), Irish (10.2%), European (3.9%), Italian (2.9%).
Current Local Time:
Incorporated on 04/24/1991
Land area: 34.5 square miles.
Population density: 513 people per square mile (low).
158 residents are foreign born
This village:
0.9%Illinois:
14.1%
Median real estate property taxes paid for housing units with mortgages in 2022: $3,713 (2.0%)Median real estate property taxes paid for housing units with no mortgage in 2022: $3,393 (1.8%)
Nearest city with pop. 50,000+: Florissant, MO
Nearest city with pop. 200,000+: St. Louis, MO
Nearest city with pop. 1,000,000+: Chicago, IL
Nearest cities:
Latitude: 38.95 N, Longitude: 90.20 W
Daytime population change due to commuting: -3,857 (-21.8%)Workers who live and work in this village: 2,056 (22.9%)
Area code commonly used in this area: 618
Single-family new house construction building permits:
2022: 17 buildings , average cost: $309,9002021: 20 buildings , average cost: $269,0002020: 37 buildings , average cost: $208,4002019: 29 buildings , average cost: $227,1002018: 15 buildings , average cost: $215,8002017: 17 buildings , average cost: $199,7002016: 14 buildings , average cost: $238,9002015: 19 buildings , average cost: $222,2002014: 5 buildings , average cost: $329,6002013: 6 buildings , average cost: $188,6002012: 10 buildings , average cost: $243,5002011: 14 buildings , average cost: $237,2002010: 28 buildings , average cost: $204,9002009: 30 buildings , average cost: $149,8002008: 59 buildings , average cost: $192,6002007: 73 buildings , average cost: $208,9002006: 73 buildings , average cost: $197,0002005: 69 buildings , average cost: $195,3002004: 83 buildings , average cost: $170,4002003: 99 buildings , average cost: $172,1002002: 63 buildings , average cost: $194,6002001: 74 buildings , average cost: $173,2002000: 61 buildings , average cost: $156,0001999: 78 buildings , average cost: $119,3001998: 54 buildings , average cost: $134,400Unemployment in December 2023: Population change in the 1990s: +592 (+3.8%).
Most common occupations in Godfrey, IL (%)
Both Males Females
Other sales and related occupations, including supervisors (4.5%)
Other management occupations, except farmers and farm managers (4.0%)
Preschool, kindergarten, elementary, and middle school teachers (3.6%)
Other production occupations, including supervisors (3.6%)
Sales representatives, services, wholesale and manufacturing (3.5%)
Secretaries and administrative assistants (3.3%)
Retail sales workers, except cashiers (3.3%)
Electrical equipment mechanics and other installation, maintenance, and repair workers, including supervisors (5.4%)
Metal workers and plastic workers (5.1%)
Sales representatives, services, wholesale and manufacturing (4.8%)
Other sales and related occupations, including supervisors (4.7%)
Other production occupations, including supervisors (4.7%)
Other management occupations, except farmers and farm managers (4.5%)
Material recording, scheduling, dispatching, and distributing workers (4.0%)
Preschool, kindergarten, elementary, and middle school teachers (7.0%)
Secretaries and administrative assistants (6.9%)
Registered nurses (6.2%)
Other office and administrative support workers, including supervisors (4.8%)
Health technologists and technicians (4.4%)
Other sales and related occupations, including supervisors (4.2%)
Retail sales workers, except cashiers (3.4%)
Tornado activity:
Godfrey-area historical tornado activity is near Illinois state average. It is 77% greater than the overall U.S. average.
On 1/24/1967, a category F4 (max. wind speeds 207-260 mph) tornado 9.9 miles away from the Godfrey village center killed 3 people and injured 216 people and caused between $5,000,000 and $50,000,000 in damages.
On 4/3/1981, a category F4 tornado 16.2 miles away from the village center injured 32 people and caused between $5,000,000 and $50,000,000 in damages.
Earthquake activity:
Godfrey-area historical earthquake activity is significantly above Illinois state average. It is 290% greater than the overall U.S. average. On 4/18/2008 at 09:36:59, a magnitude 5.4 (5.1 MB, 4.8 MS, 5.4 MW, 5.2 MW, Class: Moderate, Intensity: VI - VII) earthquake occurred 129.7 miles away from the city center On 4/18/2008 at 09:36:59, a magnitude 5.2 (5.2 MW, Depth: 8.9 mi) earthquake occurred 129.7 miles away from Godfrey center On 6/10/1987 at 23:48:54, a magnitude 5.1 (4.9 MB, 4.4 MS, 4.6 MS, 5.1 LG) earthquake occurred 125.1 miles away from the city center On 9/26/1990 at 13:18:51, a magnitude 5.0 (4.7 MB, 4.8 LG, 5.0 LG, Depth: 7.7 mi) earthquake occurred 128.5 miles away from Godfrey center On 6/18/2002 at 17:37:15, a magnitude 5.0 (4.3 MB, 4.6 MW, 5.0 LG) earthquake occurred 147.1 miles away from the city center On 5/4/1991 at 01:18:54, a magnitude 5.0 (4.4 MB, 4.6 LG, 5.0 LG, Depth: 3.1 mi) earthquake occurred 166.2 miles away from Godfrey center Magnitude types: regional Lg-wave magnitude (LG), body-wave magnitude (MB), surface-wave magnitude (MS), moment magnitude (MW) Natural disasters: The number of natural disasters in Madison County (14) is near the US average (15).Major Disasters (Presidential) Declared: 11Emergencies Declared: 1Floods: 11, Storms: 10, Tornadoes: 3, Heavy Rain: 1, Hurricane: 1, Winter Storm: 1, Other: 1 (Note: some incidents may be assigned to more than one category). Hospitals and medical centers in Godfrey: BEVERLY FARM FOUNDATION (6301 HUMBERT ROAD) GROUP HOME #2 (224 BACHMAN LANE) PIASA MANOR (110 NORTH ALBY COURT) TWIN RIVERS ESTATE (4710 PIERCE LANE) BLU-FOUNTAIN MANOR (1623 29 WEST DELMAR)
D'ADRIAN CONVALESCENT CENTER (1313 D'ADRIAN PROFESSIONAL PRK)
Amtrak station near Godfrey: 5 miles: ALTON (3400 COLLEGE AVE.) Services: ticket office, fully wheelchair accessible, public payphones, vending machines, free short-term parking, free long-term parking, call for taxi service.
Colleges/Universities in Godfrey: Lewis and Clark Community College Full-time enrollment: 4,189; Location: 5800 Godfrey Rd; Public; Website: www.lc.edu)
Alvareitas College of Cosmetology-Godfrey Full-time enrollment: 86; Location: 3048 Godfrey Rd; Private, for-profit; Website: www.alvareita.com)
Other colleges/universities with over 2000 students near Godfrey:
Southern Illinois University-Edwardsville (about 16 miles; Edwardsville, IL ; Full-time enrollment: 11,933)
University of Missouri-St Louis (about 18 miles; Saint Louis, MO ; FT enrollment: 10,322)
Lindenwood University (about 20 miles; Saint Charles, MO ; FT enrollment: 11,117)
Ranken Technical College (about 21 miles; Saint Louis, MO ; FT enrollment: 2,134)
Washington University in St Louis (about 22 miles; Saint Louis, MO ; FT enrollment: 10,823)
Saint Louis University (about 22 miles; Saint Louis, MO ; FT enrollment: 11,606)
Saint Louis Community College (about 23 miles; Saint Louis, MO ; FT enrollment: 18,019)
Public elementary/middle schools in Godfrey:
Private elementary/middle schools in Godfrey: EVANGELICAL SCHOOL Students: 498, Location: 1212 W HOMER M ADAMS PKWY, Grades: PK-8)
ST AMBROSE CATHOLIC SCHOOL Students: 241, Location: 822 W HOMER ADAMS PKWY, Grades: PK-8)
MONTESSORI CHILDREN'S HOUSE Students: 73, Location: 5800 GODFREY RD, Grades: PK-6)
See full list of schools located in Godfrey
Notable locations in Godfrey: (A) , Godfrey Main Sewage Treatment Plant (B) , Alden Hall (C) , Baldwin Hall (D) , Caldwell Hall (E) , Erickson Hall (F) , Fobes Hall (G) , Gilman Hall (H) , Haskell Hall (I) , Hatheway Hall (J) , Reid Hall (K) , Trimpe Hall (L) , Wade Hall (M) , Godfrey Fire Protection District Station 2 (N) , Godfrey Fire Protection District Station 1 (O) . Display/hide their locations on the map
Churches in Godfrey include: (A) , Bethany Church (B) , Rocky Fork Church (C) , Melville Church (D) . Display/hide their locations on the map
Cemeteries: (1) , Greenwood Cemetery (2) , Godfrey City Cemetery (3) , Valhalla Memorial Cemetery (4) . Display/hide their locations on the map
Reservoirs: (A) , Wilkinson Pond (B) , Alton-Woodriver Sportsmens Reservoir (C) , Warren Levis Lake (D) . Display/hide their locations on the map
Streams, rivers, and creeks: (A) , Little Piasa Creek (B) . Display/hide their locations on the map
Parks in Godfrey include: (1) , Adams Park (2) . Display/hide their locations on the map
Tourist attraction: (1) . Display/hide its approximate location on the map
Hotel: (1) . Display/hide its approximate location on the map
Birthplace of: Ellis Wainwright - Businessman and art collector.
Madison County has a predicted average indoor radon screening level between 2 and 4 pCi/L (pico curies per liter) - Moderate Potential Average household size: This village:
2.4 peopleIllinois:
2.6 people
Percentage of family households: This village:
69.8%Whole state:
65.8%
Percentage of households with unmarried partners: This village:
5.4%Whole state:
6.3%
Likely homosexual households (counted as self-reported same-sex unmarried-partner households)
Lesbian couples: 0.3% of all households Gay men: 0.2% of all households
People in group quarters in Godfrey in 2010:
287 people in residential treatment centers for adults
127 people in group homes intended for adults
52 people in nursing facilities/skilled-nursing facilities
6 people in other noninstitutional facilities
People in group quarters in Godfrey in 2000:
258 people in other nonhousehold living situations
185 people in nursing homes
15 people in homes for the mentally retarded
15 people in homes for the physically handicapped
Banks with branches in Godfrey (2011 data):
Liberty Bank: Godfrey Branch at 2711 Godfrey Road, branch established on 1997/10/17; Godfrey Rt 67 Branch at 3112 Godfrey Road, branch established on 1997/05/09. Info updated 2007/08/29: Bank assets: $285.2 mil, Deposits: $234.1 mil, headquarters in Alton, IL, positive income , Commercial Lending Specialization, 4 total offices , Holding Company: Liberty Bancshares, Inc.
Regions Bank: Godfrey Branch at 821 Homer Adams Parkway, branch established on 1989/11/09. Info updated 2011/02/24: Bank assets: $123,368.2 mil, Deposits: $98,301.3 mil, headquarters in Birmingham, AL, positive income , Commercial Lending Specialization, 1778 total offices , Holding Company: Regions Financial Corporation
Woodforest National Bank: Il Godfrey Walmart Branch at 6660 Godfrey Road, branch established on 2011/01/26. Info updated 2011/05/10: Bank assets: $3,488.9 mil, Deposits: $3,097.6 mil, headquarters in Houston, TX, positive income , Commercial Lending Specialization, 766 total offices , Holding Company: Woodforest Financial Group Employee Stock Ownership Plan (With 401(K) Provisions)
Carrollton Bank: Godfrey Branch at 136 Northport Drive, branch established on 2000/02/07. Info updated 2006/11/03: Bank assets: $1,013.8 mil, Deposits: $856.6 mil, headquarters in Carrollton, IL, positive income , Commercial Lending Specialization, 9 total offices , Holding Company: Cbx Corporation
Reliance Bank: -il Branch at 2810 Godfrey Road, branch established on 1999/06/17. Info updated 2010/11/22: Bank assets: $980.2 mil, Deposits: $824.0 mil, headquarters in Des Peres, MO, negative income in the last year , Commercial Lending Specialization, 20 total offices , Holding Company: Reliance Bancshares, Inc.
For population 15 years and over in Godfrey:
Never married: 24.6%Now married: 55.0%Separated: 0.5%Widowed: 7.7%Divorced: 12.1% For population 25 years and over in Godfrey:
High school or higher: 95.9%Bachelor's degree or higher: 31.6%Graduate or professional degree: 11.4%Unemployed: 4.7%Mean travel time to work (commute): 21.2 minutes
Education Gini index (Inequality in education) Here:
9.0Illinois average:
12.5
Religion statistics for Godfrey, IL (based on Madison County data)
Religion Adherents Congregations Evangelical Protestant 59,455 212 Catholic 37,243 21 Mainline Protestant 24,545 79 Other 5,330 20 Black Protestant 3,942 21 Orthodox 590 4 None 138,177 -
Source: Clifford Grammich, Kirk Hadaway, Richard Houseal, Dale E.Jones, Alexei Krindatch, Richie Stanley and Richard H.Taylor. 2012. 2010 U.S.Religion Census: Religious Congregations & Membership Study. Association of Statisticians of American Religious Bodies. Jones, Dale E., et al. 2002. Congregations and Membership in the United States 2000. Nashville, TN: Glenmary Research Center. Graphs represent county-level data
Food Environment Statistics: Number of grocery stores : 48This county :
1.80 / 10,000 pop.Illinois :
2.24 / 10,000 pop.
Number of supercenters and club stores : 1Here :
0.04 / 10,000 pop.Illinois :
0.08 / 10,000 pop.
Number of convenience stores (no gas) : 18Here :
0.67 / 10,000 pop.Illinois :
0.75 / 10,000 pop.
Number of convenience stores (with gas) : 100Madison County :
3.74 / 10,000 pop.Illinois :
2.61 / 10,000 pop.
Number of full-service restaurants : 190Here :
7.11 / 10,000 pop.Illinois :
6.86 / 10,000 pop.
Adult diabetes rate : Madison County :
9.2%Illinois :
8.3%
Low-income preschool obesity rate : Madison County :
9.6%Illinois :
14.5%
Health and Nutrition: Healthy diet rate : This city:
51.0%Illinois:
49.5%
Average overall health of teeth and gums : This city:
47.9%Illinois:
47.2%
Average BMI : Godfrey:
29.2Illinois:
28.6
People feeling badly about themselves : Godfrey:
21.4%Illinois:
20.5%
People not drinking alcohol at all : Average hours sleeping at night : Overweight people : This city:
37.3%State:
33.4%
General health condition : Godfrey:
56.7%Illinois:
56.4%
Average condition of hearing : Godfrey:
76.9%Illinois:
79.9%
More about Health and Nutrition of Godfrey, IL Residents
Local government employment and payroll (March 2022)
Function
Full-time employees
Monthly full-time payroll
Average yearly full-time wage
Part-time employees
Monthly part-time payroll
Other Government Administration
12 $43,421 $43,421 4 $723 Streets and Highways
11 $62,546 $68,232 0 $0 Parks and Recreation
5 $20,234 $48,562 6 $3,542 Financial Administration
2 $9,185 $55,110 0 $0
Totals for Government
30 $135,386 $54,154 10 $4,265
Godfrey government finances - Expenditure in 2017 (per resident):
Construction - Regular Highways: $596,000 ($33.70)
Solid Waste Management: $511,000 ($28.89)Parks and Recreation: $126,000 ($7.12)Current Operations - Police Protection: $2,469,000 ($139.59)
Regular Highways: $1,775,000 ($100.35)General - Other: $1,716,000 ($97.01)Parks and Recreation: $1,007,000 ($56.93)Central Staff Services: $467,000 ($26.40)Financial Administration: $230,000 ($13.00)Protective Inspection and Regulation - Other: $229,000 ($12.95)General Public Buildings: $46,000 ($2.60)General - Interest on Debt: $23,000 ($1.30)
Other Capital Outlay - Regular Highways: $337,000 ($19.05)
Parks and Recreation: $163,000 ($9.22)Solid Waste Management: $82,000 ($4.64)Central Staff Services: $30,000 ($1.70)Total Salaries and Wages: $1,321,000 ($74.68)
Godfrey government finances - Revenue in 2017 (per resident):
Charges - Sewerage: $2,467,000 ($139.47)
Parks and Recreation: $219,000 ($12.38)Miscellaneous - General Revenue - Other: $92,000 ($5.20)
Interest Earnings: $89,000 ($5.03)Fines and Forfeits: $64,000 ($3.62)State Intergovernmental - General Local Government Support: $5,002,000 ($282.79)
Highways: $457,000 ($25.84)Other: $128,000 ($7.24)Tax - Public Utilities Sales: $662,000 ($37.43)
Property: $597,000 ($33.75)Other License: $13,000 ($0.73)Other Selective Sales: $10,000 ($0.57)
Godfrey government finances - Debt in 2017 (per resident):
Long Term Debt - Beginning Outstanding - Unspecified Public Purpose: $852,000 ($48.17)
Outstanding Unspecified Public Purpose: $774,000 ($43.76)Retired Unspecified Public Purpose: $78,000 ($4.41)
Godfrey government finances - Cash and Securities in 2017 (per resident):
Other Funds - Cash and Securities: $16,499,000 ($932.78)
Businesses in Godfrey, IL
Name Count Name Count
Arby's 1 Little Caesars Pizza 1 Curves 1 McDonald's 1 Dairy Queen 1 Pizza Hut 1 Domino's Pizza 1 SONIC Drive-In 1 FedEx 2 U-Haul 1 Hardee's 1 UPS 2 KFC 1
Strongest AM radio stations in Godfrey:
WBGZ (1570 AM; 1 kW; ALTON, IL)
KXEN (1010 AM; 50 kW; FESTUS-ST. LOUIS, MO; Owner: BDJ RADIO ENTERPRISES, LLC)
KMOX (1120 AM; 50 kW; ST. LOUIS, MO; Owner: INFINITY BROADCASTING OPERATIONS, INC.)
KFNS (590 AM; 1 kW; WOOD RIVER, IL; Owner: MISSOURI SPORTS RADIO, LLC)
KRFT (1190 AM; 10 kW; DE SOTO, MO; Owner: ALL SPORTS RADIO, LLC)
KTRS (550 AM; 5 kW; ST. LOUIS, MO; Owner: KTRS-AM LICENSE, L.L.C.)
KJSL (630 AM; 5 kW; ST. LOUIS, MO; Owner: WMUZ RADIO, INC.)
KIRL (1460 AM; 5 kW; ST. CHARLES, MO; Owner: BRONCO BROADCASTING CO., INC.)
WSDZ (1260 AM; 20 kW; BELLEVILLE, IL)
KFUO (850 AM; 5 kW; CLAYTON, MO; Owner: LUTHERAN CHURCH-MISSOURI SYNOD)
KATZ (1600 AM; 5 kW; ST. LOUIS, MO; Owner: CITICASTERS LICENSES, L.P.)
KSIV (1320 AM; 5 kW; CLAYTON, MO; Owner: BOTT COMMUNICATIONS, INC.)
WRTH (1430 AM; 5 kW; ST. LOUIS, MO)
Strongest FM radio stations in Godfrey:
WLCA (89.9 FM; GODFREY, IL; Owner: LEWIS & CLARK COMMUNITY COLLEGE)
KATZ-FM (100.3 FM; ALTON, IL; Owner: CITICASTERS LICENSES, L.P.)
WMLL (104.1 FM; JERSEYVILLE, IL; Owner: EMMIS RADIO LICENSE CORPORATION)
WSIE (88.7 FM; EDWARDSVILLE, IL; Owner: BOARD OF TRUSTEES, S. ILLINOIS UNIV.)
KSIV-FM (91.5 FM; ST. LOUIS, MO; Owner: COMMUNITY BROADCASTING, INC.)
WVRV (101.1 FM; EAST ST. LOUIS, IL; Owner: BONNEVILLE HOLDING COMPANY)
W288AW (105.5 FM; ALTON, IL; Owner: ILLINOIS BIBLE INSTITUTE, INC.)
KEZK-FM (102.5 FM; ST. LOUIS, MO; Owner: INFINITY RADIO SUBSIDIARY OPERATIONS INC.)
KIHT (96.3 FM; ST. LOUIS, MO; Owner: EMMIS RADIO LICENSE CORPORATION)
WFUN-FM (95.5 FM; BETHALTO, IL; Owner: RADIO ONE LICENSES, LLC)
WTPC (105.3 FM; ELSAH, IL; Owner: PRINCIPIA COLLEGE COMMUNICATIONS INC)
KSHE (94.7 FM; CRESTWOOD, MO; Owner: EMMIS RADIO LICENSE CORPORATION)
KSLZ (107.7 FM; ST. LOUIS, MO; Owner: CITICASTERS LICENSES, L.P.)
KFUO-FM (99.1 FM; CLAYTON, MO; Owner: THE LUTHERAN CHURCH-MISSOURI SYNOD)
KYKY (98.1 FM; ST. LOUIS, MO; Owner: INFINITY RADIO SUBSIDIARY OPERATIONS INC.)
WSSM (106.5 FM; GRANITE CITY, IL; Owner: BONNEVILLE HOLDING COMPANY)
KWMU (90.7 FM; ST. LOUIS, MO; Owner: THE CURATORS OF THE UNIVERSITY OF MISSOURI)
KSD (93.7 FM; ST. LOUIS, MO; Owner: CITICASTERS LICENSES, L.P.)
KLOU (103.3 FM; ST. LOUIS, MO; Owner: CITICASTERS LICENSES, L.P.)
WIL-FM (92.3 FM; ST. LOUIS, MO; Owner: BONNEVILLE HOLDING COMPANY)
TV broadcast stations around Godfrey:
W50CH (Channel 50; ALTON, IL; Owner: LIBERTY CHRISTIAN CENTER)
KSDK (Channel 5; ST. LOUIS, MO; Owner: MULTIMEDIA KSDK, INC.)
KPLR-TV (Channel 11; ST. LOUIS, MO; Owner: KPLR, INC.)
KTVI (Channel 2; ST. LOUIS, MO; Owner: KTVI LICENSE, INC.)
KDNL-TV (Channel 30; ST. LOUIS, MO; Owner: KDNL LICENSEE, LLC)
K40FF (Channel 40; ST. LOUIS, MO; Owner: EBC ST. LOUIS, INC.)
KMOV (Channel 4; ST. LOUIS, MO; Owner: KMOV-TV, INC.)
KETC (Channel 9; ST. LOUIS, MO; Owner: ST. LOUIS REGIONAL & EDUCATIONAL PUBLIC TV COMMISSION)
KPTN-LP (Channel 58; ST. LOUIS, MO; Owner: KURT J. PETERSEN)
K49FC (Channel 49; ST. LOUIS, MO; Owner: THREE ANGELS BROADCASTING NETWORK)
K64DT (Channel 64; ST. LOUIS, MO; Owner: WORD OF GOD FELLOWSHIP, INC.)
WRBU (Channel 46; EAST ST. LOUIS, IL; Owner: ROBERTS BROADCASTING COMPANY)
K18BT (Channel 18; ST. LOUIS, MO; Owner: TRINITY BROADCASTING NETWORK)
K63FW (Channel 63; JAMESTOWN, MO; Owner: ROGER E. HARDERS)
K65FN (Channel 65; BATESVILLE, AR; Owner: MS COMMUNICATIONS, LLC)
KNLC (Channel 24; ST. LOUIS, MO; Owner: NEW LIFE EVANGELISTIC CENTER, INC.)
K59GP (Channel 59; ST. CHARLES, MO; Owner: TRINITY BROADCASTING NETWORK)
K38HD (Channel 38; ST. LOUIS, MO; Owner: VENTANA TELEVISION, INC.)
National Bridge Inventory (NBI) Statistics 62 Number of bridges646ft / 197m Total length $529,142,000 Total costs314,675 Total average daily traffic26,253 Total average daily truck traffic
New bridges - historical statistics
1 1900-1909 1 1920-1929 1 1930-1939 4 1950-1959 3 1960-1969 7 1970-1979 10 1980-1989 4 1990-1999 9 2000-2009 22 2010-2019
See full National Bridge Inventory statistics for Godfrey, IL
Home Mortgage Disclosure Act Aggregated Statistics For Year 2009(Based on 2 full and 2 partial tracts) A) FHA, FSA/RHS & VA B) Conventional C) Refinancings D) Home Improvement Loans F) Non-occupant Loans on G) Loans On Manufactured Number Average Value Number Average Value Number Average Value Number Average Value Number Average Value Number Average Value
LOANS ORIGINATED 100 $120,022 100 $141,897 667 $138,290 39 $56,143 32 $130,060 1 $10,000 APPLICATIONS APPROVED, NOT ACCEPTED 3 $85,083 11 $139,715 25 $125,260 7 $7,663 1 $110,180 0 $0 APPLICATIONS DENIED 11 $117,821 16 $105,291 96 $133,109 22 $30,366 5 $87,932 0 $0 APPLICATIONS WITHDRAWN 10 $106,475 13 $133,052 78 $141,295 3 $41,423 2 $73,895 0 $0 FILES CLOSED FOR INCOMPLETENESS 1 $163,050 2 $149,940 20 $145,946 0 $0 1 $50,120 0 $0
Aggregated Statistics For Year 2008(Based on 2 full and 2 partial tracts) A) FHA, FSA/RHS & VA B) Conventional C) Refinancings D) Home Improvement Loans F) Non-occupant Loans on G) Loans On Manufactured Number Average Value Number Average Value Number Average Value Number Average Value Number Average Value Number Average Value
LOANS ORIGINATED 83 $125,981 168 $133,674 356 $130,833 41 $52,814 51 $105,730 2 $13,495 APPLICATIONS APPROVED, NOT ACCEPTED 10 $165,845 12 $142,661 33 $140,244 8 $29,518 1 $92,800 0 $0 APPLICATIONS DENIED 11 $127,904 20 $110,872 132 $134,148 30 $63,202 3 $56,520 2 $55,970 APPLICATIONS WITHDRAWN 4 $103,922 16 $129,984 50 $143,822 4 $99,360 1 $43,490 0 $0 FILES CLOSED FOR INCOMPLETENESS 1 $82,590 2 $124,950 21 $160,631 2 $28,555 1 $59,980 0 $0
Aggregated Statistics For Year 2007(Based on 2 full and 2 partial tracts) A) FHA, FSA/RHS & VA B) Conventional C) Refinancings D) Home Improvement Loans E) Loans on Dwellings For 5+ Families F) Non-occupant Loans on G) Loans On Manufactured Number Average Value Number Average Value Number Average Value Number Average Value Number Average Value Number Average Value Number Average Value
LOANS ORIGINATED 33 $106,388 271 $126,280 360 $124,981 52 $52,472 1 $1,155,350 40 $110,813 3 $43,327 APPLICATIONS APPROVED, NOT ACCEPTED 1 $74,160 24 $96,094 64 $131,986 12 $26,012 0 $0 2 $55,105 0 $0 APPLICATIONS DENIED 4 $114,982 33 $121,742 222 $127,234 44 $52,502 0 $0 6 $83,070 1 $56,050 APPLICATIONS WITHDRAWN 5 $131,880 27 $134,803 98 $132,490 7 $57,436 0 $0 8 $70,874 0 $0 FILES CLOSED FOR INCOMPLETENESS 0 $0 11 $136,531 30 $120,695 3 $38,747 0 $0 1 $78,660 0 $0
Aggregated Statistics For Year 2006(Based on 2 full and 2 partial tracts) A) FHA, FSA/RHS & VA B) Conventional C) Refinancings D) Home Improvement Loans F) Non-occupant Loans on G) Loans On Manufactured Number Average Value Number Average Value Number Average Value Number Average Value Number Average Value Number Average Value
LOANS ORIGINATED 19 $119,100 337 $111,402 360 $117,436 56 $26,221 34 $72,787 1 $20,430 APPLICATIONS APPROVED, NOT ACCEPTED 4 $94,160 33 $127,297 62 $101,009 5 $26,642 7 $117,904 0 $0 APPLICATIONS DENIED 4 $115,222 43 $86,639 215 $103,570 36 $51,852 8 $75,871 3 $69,493 APPLICATIONS WITHDRAWN 2 $81,435 26 $127,558 93 $106,415 6 $62,005 1 $27,920 1 $54,980 FILES CLOSED FOR INCOMPLETENESS 1 $85,250 8 $178,234 49 $113,883 3 $84,443 2 $100,870 0 $0
Aggregated Statistics For Year 2005(Based on 2 full and 2 partial tracts) A) FHA, FSA/RHS & VA B) Conventional C) Refinancings D) Home Improvement Loans E) Loans on Dwellings For 5+ Families F) Non-occupant Loans on G) Loans On Manufactured Number Average Value Number Average Value Number Average Value Number Average Value Number Average Value Number Average Value Number Average Value
LOANS ORIGINATED 29 $105,349 301 $111,693 386 $108,905 73 $45,292 1 $2,776,200 45 $74,944 3 $31,710 APPLICATIONS APPROVED, NOT ACCEPTED 3 $147,060 26 $100,229 53 $83,670 9 $42,976 0 $0 2 $54,845 0 $0 APPLICATIONS DENIED 5 $68,902 38 $106,857 184 $104,246 34 $34,051 0 $0 8 $85,312 9 $48,927 APPLICATIONS WITHDRAWN 0 $0 29 $109,415 140 $118,553 15 $148,255 0 $0 3 $89,407 0 $0 FILES CLOSED FOR INCOMPLETENESS 0 $0 4 $104,385 14 $112,432 3 $50,170 0 $0 3 $91,740 0 $0
Aggregated Statistics For Year 2004(Based on 2 full and 2 partial tracts) A) FHA, FSA/RHS & VA B) Conventional C) Refinancings D) Home Improvement Loans F) Non-occupant Loans on G) Loans On Manufactured Number Average Value Number Average Value Number Average Value Number Average Value Number Average Value Number Average Value
LOANS ORIGINATED 53 $99,146 285 $106,624 468 $108,456 60 $27,385 35 $88,163 2 $23,535 APPLICATIONS APPROVED, NOT ACCEPTED 6 $81,095 26 $118,147 71 $92,509 10 $23,205 1 $26,950 2 $92,500 APPLICATIONS DENIED 12 $93,821 54 $95,508 179 $96,165 38 $33,889 6 $164,142 8 $50,334 APPLICATIONS WITHDRAWN 3 $134,490 19 $135,227 133 $96,667 7 $63,519 3 $100,617 1 $76,310 FILES CLOSED FOR INCOMPLETENESS 0 $0 12 $89,281 26 $112,606 2 $21,065 1 $69,410 0 $0
Aggregated Statistics For Year 2003(Based on 2 full and 2 partial tracts) A) FHA, FSA/RHS & VA B) Conventional C) Refinancings D) Home Improvement Loans F) Non-occupant Loans on Number Average Value Number Average Value Number Average Value Number Average Value Number Average Value
LOANS ORIGINATED 46 $98,464 248 $104,729 1,194 $102,805 56 $24,192 41 $70,718 APPLICATIONS APPROVED, NOT ACCEPTED 0 $0 16 $107,601 103 $91,961 10 $26,198 3 $76,890 APPLICATIONS DENIED 4 $79,990 25 $97,820 199 $83,102 20 $24,252 7 $59,453 APPLICATIONS WITHDRAWN 2 $53,320 26 $154,814 149 $96,049 4 $56,232 2 $261,600 FILES CLOSED FOR INCOMPLETENESS 1 $69,530 5 $111,138 27 $96,890 2 $22,120 0 $0
Aggregated Statistics For Year 2002(Based on 2 partial tracts) A) FHA, FSA/RHS & VA B) Conventional C) Refinancings D) Home Improvement Loans E) Loans on Dwellings For 5+ Families F) Non-occupant Loans on Number Average Value Number Average Value Number Average Value Number Average Value Number Average Value Number Average Value
LOANS ORIGINATED 35 $87,106 76 $67,788 283 $82,756 28 $13,132 1 $1,943,340 19 $54,275 APPLICATIONS APPROVED, NOT ACCEPTED 1 $35,410 9 $82,742 30 $89,273 4 $9,065 0 $0 2 $52,845 APPLICATIONS DENIED 6 $75,152 11 $77,346 71 $84,920 15 $11,118 0 $0 4 $72,238 APPLICATIONS WITHDRAWN 1 $55,070 9 $83,439 29 $83,611 3 $13,273 0 $0 1 $48,240 FILES CLOSED FOR INCOMPLETENESS 1 $93,470 2 $64,920 6 $60,058 1 $65,730 0 $0 0 $0
Aggregated Statistics For Year 2001(Based on 2 partial tracts) A) FHA, FSA/RHS & VA B) Conventional C) Refinancings D) Home Improvement Loans F) Non-occupant Loans on Number Average Value Number Average Value Number Average Value Number Average Value Number Average Value
LOANS ORIGINATED 44 $70,881 61 $79,592 220 $79,185 22 $33,975 17 $54,082 APPLICATIONS APPROVED, NOT ACCEPTED 1 $53,670 8 $83,701 35 $81,981 2 $18,580 2 $48,610 APPLICATIONS DENIED 2 $65,410 14 $58,741 84 $71,797 13 $12,762 5 $56,358 APPLICATIONS WITHDRAWN 3 $67,940 6 $78,032 51 $72,067 1 $15,950 1 $40,220 FILES CLOSED FOR INCOMPLETENESS 1 $73,110 4 $34,062 11 $69,215 0 $0 1 $40,840
Aggregated Statistics For Year 2000(Based on 2 partial tracts) A) FHA, FSA/RHS & VA B) Conventional C) Refinancings D) Home Improvement Loans E) Loans on Dwellings For 5+ Families F) Non-occupant Loans on Number Average Value Number Average Value Number Average Value Number Average Value Number Average Value Number Average Value
LOANS ORIGINATED 34 $74,807 72 $74,784 89 $61,823 37 $15,727 1 $76,810 23 $48,612 APPLICATIONS APPROVED, NOT ACCEPTED 1 $61,580 7 $64,671 17 $51,824 7 $14,571 0 $0 1 $37,250 APPLICATIONS DENIED 4 $58,682 16 $45,080 44 $58,518 15 $17,118 0 $0 2 $46,035 APPLICATIONS WITHDRAWN 2 $95,115 6 $67,883 27 $50,803 1 $23,160 0 $0 3 $42,073 FILES CLOSED FOR INCOMPLETENESS 0 $0 4 $40,742 6 $40,565 0 $0 0 $0 1 $38,970
Aggregated Statistics For Year 1999(Based on 1 full and 2 partial tracts) A) FHA, FSA/RHS & VA B) Conventional C) Refinancings D) Home Improvement Loans E) Loans on Dwellings For 5+ Families F) Non-occupant Loans on Number Average Value Number Average Value Number Average Value Number Average Value Number Average Value Number Average Value
LOANS ORIGINATED 40 $74,653 203 $86,286 348 $78,972 101 $16,777 1 $174,510 28 $46,569 APPLICATIONS APPROVED, NOT ACCEPTED 1 $78,780 13 $87,124 65 $61,429 10 $14,852 0 $0 0 $0 APPLICATIONS DENIED 0 $0 55 $47,673 129 $65,033 26 $11,550 0 $0 5 $28,264 APPLICATIONS WITHDRAWN 1 $75,200 24 $91,818 70 $75,577 16 $69,104 0 $0 4 $53,228 FILES CLOSED FOR INCOMPLETENESS 4 $57,642 4 $55,562 18 $67,071 0 $0 0 $0 0 $0
Detailed HMDA statistics for the following Tracts:
4020.00
, 4027.01 , 4027.21 , 4027.22
Private Mortgage Insurance Companies Aggregated Statistics For Year 2009(Based on 2 full and 2 partial tracts) A) Conventional B) Refinancings C) Non-occupant Loans on Number Average Value Number Average Value Number Average Value
LOANS ORIGINATED 20 $133,382 27 $159,141 1 $96,960 APPLICATIONS APPROVED, NOT ACCEPTED 4 $125,892 5 $247,578 0 $0 APPLICATIONS DENIED 1 $135,040 1 $137,940 0 $0 APPLICATIONS WITHDRAWN 2 $120,575 4 $117,445 0 $0 FILES CLOSED FOR INCOMPLETENESS 0 $0 2 $106,420 0 $0
Aggregated Statistics For Year 2008(Based on 2 full and 2 partial tracts) A) Conventional B) Refinancings C) Non-occupant Loans on Number Average Value Number Average Value Number Average Value
LOANS ORIGINATED 58 $137,963 31 $143,750 2 $143,995 APPLICATIONS APPROVED, NOT ACCEPTED 17 $118,826 8 $142,982 2 $66,630 APPLICATIONS DENIED 2 $64,425 2 $127,460 0 $0 APPLICATIONS WITHDRAWN 2 $152,575 2 $117,730 0 $0 FILES CLOSED FOR INCOMPLETENESS 0 $0 0 $0 0 $0
Aggregated Statistics For Year 2007(Based on 2 full and 2 partial tracts) A) Conventional B) Refinancings C) Non-occupant Loans on Number Average Value Number Average Value Number Average Value
LOANS ORIGINATED 106 $118,661 49 $146,057 3 $68,880 APPLICATIONS APPROVED, NOT ACCEPTED 10 $117,226 6 $121,393 0 $0 APPLICATIONS DENIED 0 $0 1 $108,270 0 $0 APPLICATIONS WITHDRAWN 7 $103,933 0 $0 0 $0 FILES CLOSED FOR INCOMPLETENESS 0 $0 0 $0 0 $0
Aggregated Statistics For Year 2006(Based on 2 full and 2 partial tracts) A) Conventional B) Refinancings C) Non-occupant Loans on Number Average Value Number Average Value Number Average Value
LOANS ORIGINATED 81 $116,882 26 $136,943 7 $84,863 APPLICATIONS APPROVED, NOT ACCEPTED 5 $147,184 3 $139,290 1 $97,170 APPLICATIONS DENIED 0 $0 0 $0 0 $0 APPLICATIONS WITHDRAWN 2 $90,225 2 $102,720 0 $0 FILES CLOSED FOR INCOMPLETENESS 0 $0 0 $0 0 $0
Aggregated Statistics For Year 2005(Based on 2 full and 2 partial tracts) A) Conventional B) Refinancings C) Non-occupant Loans on Number Average Value Number Average Value Number Average Value
LOANS ORIGINATED 62 $113,630 49 $121,840 4 $59,438 APPLICATIONS APPROVED, NOT ACCEPTED 4 $140,308 9 $117,394 0 $0 APPLICATIONS DENIED 1 $51,820 2 $133,345 0 $0 APPLICATIONS WITHDRAWN 2 $84,650 2 $136,960 0 $0 FILES CLOSED FOR INCOMPLETENESS 0 $0 0 $0 0 $0
Aggregated Statistics For Year 2004(Based on 2 full and 2 partial tracts) A) Conventional B) Refinancings C) Non-occupant Loans on Number Average Value Number Average Value Number Average Value
LOANS ORIGINATED 56 $110,758 54 $114,815 0 $0 APPLICATIONS APPROVED, NOT ACCEPTED 6 $186,347 15 $101,712 1 $74,030 APPLICATIONS DENIED 0 $0 1 $100,960 0 $0 APPLICATIONS WITHDRAWN 4 $57,805 4 $113,012 2 $54,135 FILES CLOSED FOR INCOMPLETENESS 0 $0 0 $0 0 $0
Aggregated Statistics For Year 2003(Based on 2 full and 2 partial tracts) A) Conventional B) Refinancings C) Non-occupant Loans on Number Average Value Number Average Value Number Average Value
LOANS ORIGINATED 80 $110,786 119 $108,726 6 $47,960 APPLICATIONS APPROVED, NOT ACCEPTED 6 $80,347 28 $127,879 1 $35,990 APPLICATIONS DENIED 1 $148,990 0 $0 0 $0 APPLICATIONS WITHDRAWN 2 $71,475 10 $90,752 0 $0 FILES CLOSED FOR INCOMPLETENESS 0 $0 1 $123,080 0 $0
Aggregated Statistics For Year 2002(Based on 2 partial tracts) A) Conventional B) Refinancings C) Non-occupant Loans on Number Average Value Number Average Value Number Average Value
LOANS ORIGINATED 31 $74,663 32 $91,440 5 $58,904 APPLICATIONS APPROVED, NOT ACCEPTED 1 $62,080 4 $77,885 0 $0 APPLICATIONS DENIED 0 $0 2 $93,930 0 $0 APPLICATIONS WITHDRAWN 0 $0 4 $66,215 0 $0 FILES CLOSED FOR INCOMPLETENESS 0 $0 0 $0 0 $0
Aggregated Statistics For Year 2001(Based on 2 partial tracts) A) Conventional B) Refinancings C) Non-occupant Loans on Number Average Value Number Average Value Number Average Value
LOANS ORIGINATED 12 $97,414 29 $105,557 1 $31,650 APPLICATIONS APPROVED, NOT ACCEPTED 3 $93,807 5 $71,208 0 $0 APPLICATIONS DENIED 0 $0 2 $118,450 0 $0 APPLICATIONS WITHDRAWN 2 $69,455 1 $83,290 1 $30,630 FILES CLOSED FOR INCOMPLETENESS 0 $0 0 $0 0 $0
Aggregated Statistics For Year 2000(Based on 2 partial tracts) A) Conventional B) Refinancings Number Average Value Number Average Value
LOANS ORIGINATED 24 $86,090 4 $74,780 APPLICATIONS APPROVED, NOT ACCEPTED 3 $65,433 0 $0 APPLICATIONS DENIED 0 $0 2 $129,630 APPLICATIONS WITHDRAWN 0 $0 1 $166,570 FILES CLOSED FOR INCOMPLETENESS 0 $0 0 $0
Aggregated Statistics For Year 1999(Based on 1 full and 2 partial tracts) A) Conventional B) Refinancings C) Non-occupant Loans on Number Average Value Number Average Value Number Average Value
LOANS ORIGINATED 76 $89,311 26 $99,258 2 $53,535 APPLICATIONS APPROVED, NOT ACCEPTED 2 $114,425 5 $75,054 0 $0 APPLICATIONS DENIED 2 $71,290 1 $55,210 1 $55,210 APPLICATIONS WITHDRAWN 0 $0 1 $56,130 0 $0 FILES CLOSED FOR INCOMPLETENESS 2 $115,175 1 $55,210 0 $0
Detailed PMIC statistics for the following Tracts:
4020.00
, 4027.01 , 4027.21 , 4027.22
Most common first names in Godfrey, IL among deceased individuals Name Count Lived (average)
John 138 74.9 years Mary 129 78.3 years William 116 74.3 years Robert 90 72.9 years Charles 88 73.5 years James 83 71.9 years Helen 67 80.1 years Margaret 62 80.6 years Joseph 50 75.9 years George 47 74.3 years
Most common last names in Godfrey, IL among deceased individuals Last name Count Lived (average)
Smith 38 71.2 years Miller 31 76.6 years Brown 20 78.5 years Davis 19 76.8 years Jones 18 74.6 years Williams 18 77.1 years Roberts 17 75.3 years Elliott 15 75.0 years Foster 15 74.8 years Henderson 14 78.9 years
Godfrey compared to Illinois state average:
Unemployed percentage significantly below state average. Black race population percentage significantly below state average. Hispanic race population percentage significantly below state average. Median age above state average. Foreign-born population percentage significantly below state average. Renting percentage below state average. Length of stay since moving in above state average.
#59 on the list of "Top 101 cities with the largest percentage of people in other nonhousehold living situations (population 1,000+)"
#79 on the list of "Top 101 cities with the lowest number of police officers per 1000 residents (population 5,000+)"
#88 on the list of "Top 101 cities with the largest percentage of elementary and middle school students in private schools (1,000+ students)"
#12 on the list of "Top 101 counties with the largest decrease in the number of infant deaths per 1000 residents 2000-2006 to 2007-2013 (pop. 50,000+)"
#18 on the list of "Top 101 counties with the lowest number of infant deaths per 1000 residents 2007-2013 (pop. 50,000+)"
#26 on the list of "Top 101 counties with the highest Particulate Matter (PM2.5 ) Annual air pollution readings in 2012 (µg/m3 )"
#67 on the list of "Top 101 counties with the lowest percentage of residents relocating from foreign countries between 2010 and 2011"
Top Patent Applicants
Matthew R. Darr (10)
Martin Lee Witherbee (5)
Scott Edwin Black (3)
Jeffrey A. Stafford (3)
Kevin R. Roesch (2)
Danny Rowe (1)
Craig M. Farniok (1)
Monty James Webster (1)
Shawn C. Bloemker (1)
William Gotter (1)
Total of 41 patent applications in 2008-2024.
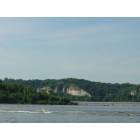
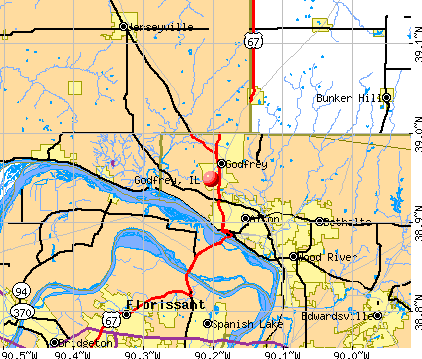


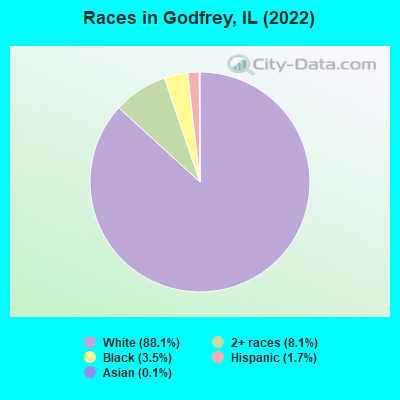
 Recent articles from our blog. Our writers, many of them Ph.D. graduates or candidates, create easy-to-read articles on a wide variety of topics.

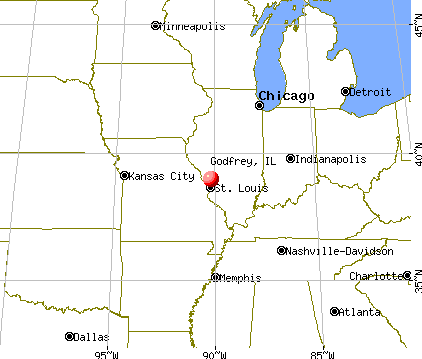
 (12.3 miles
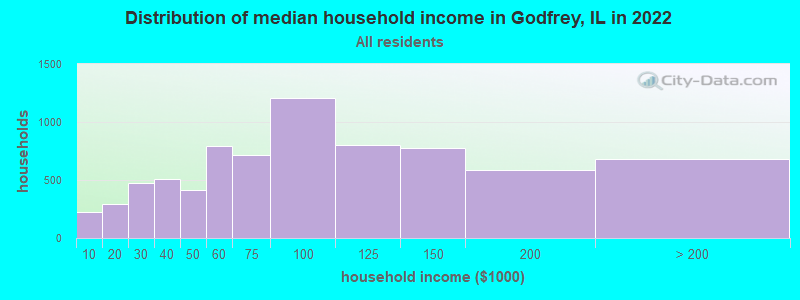
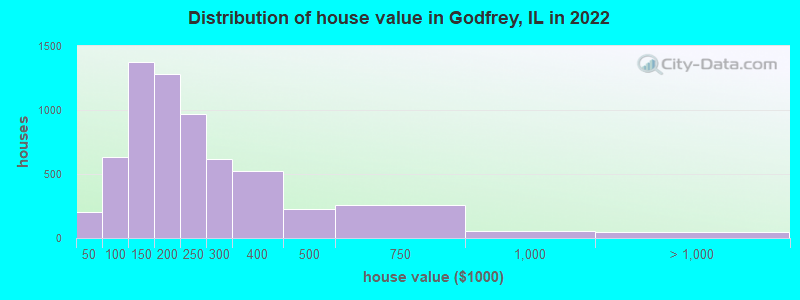

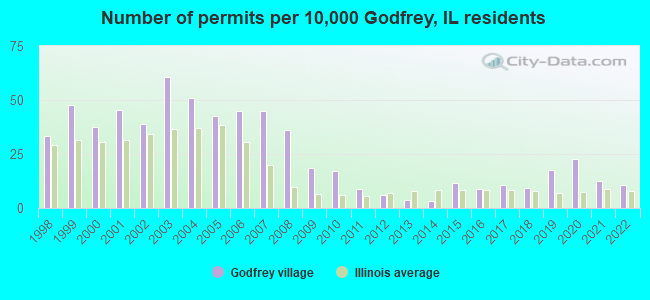
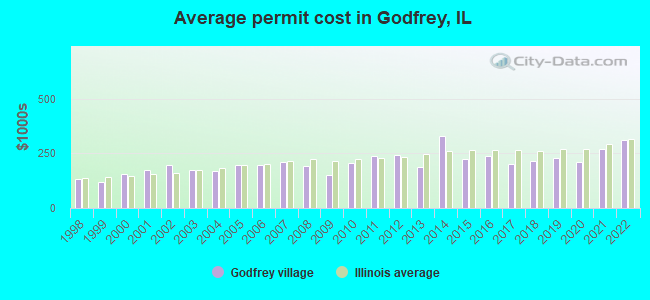
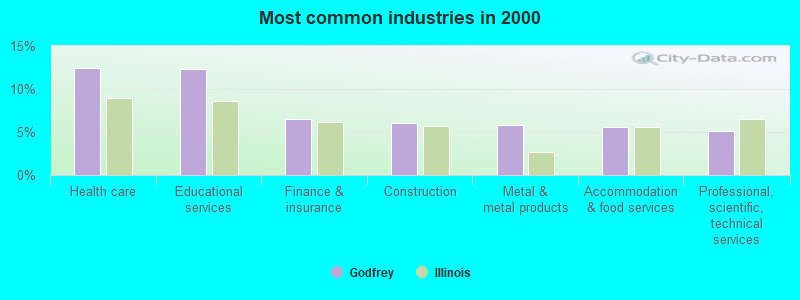
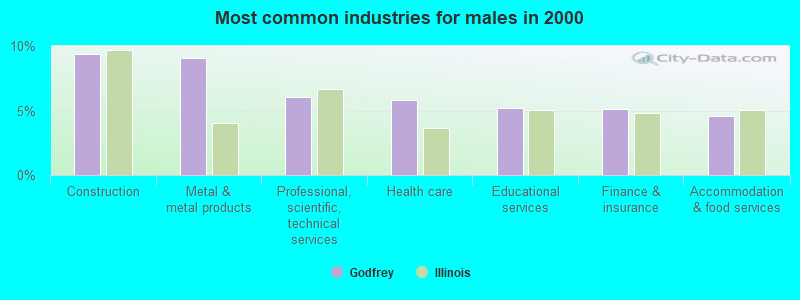
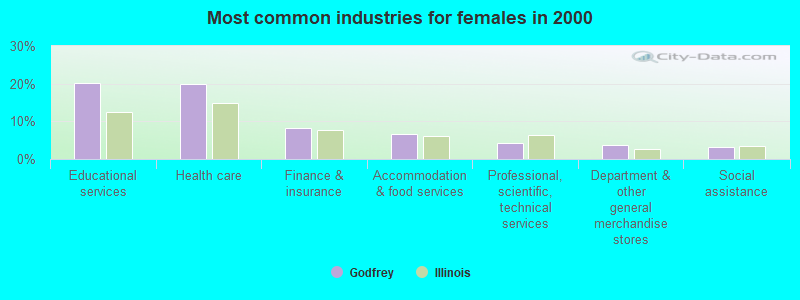
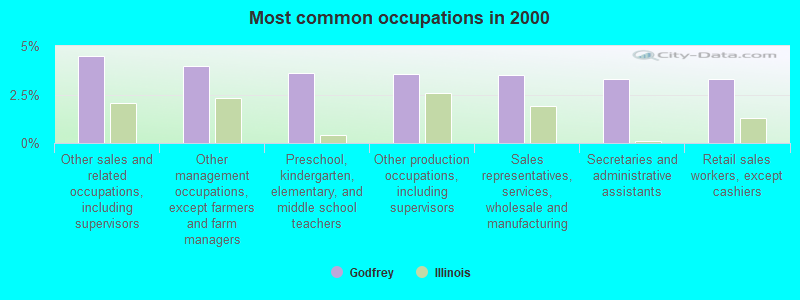
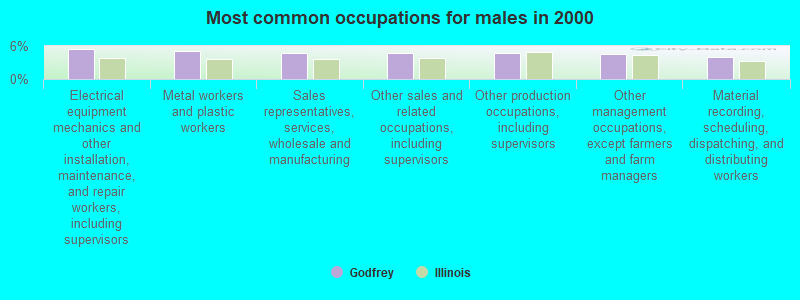
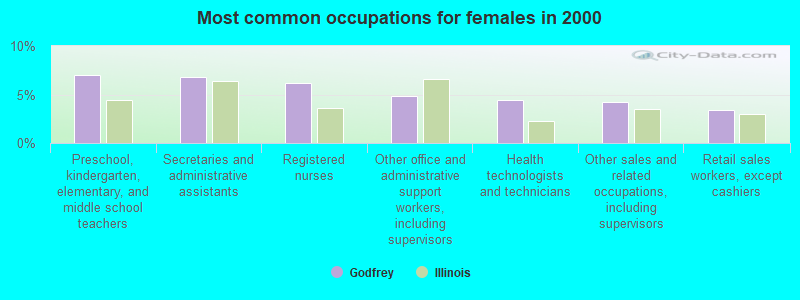


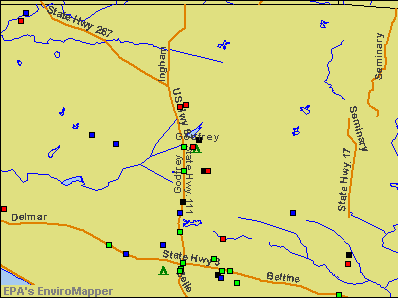

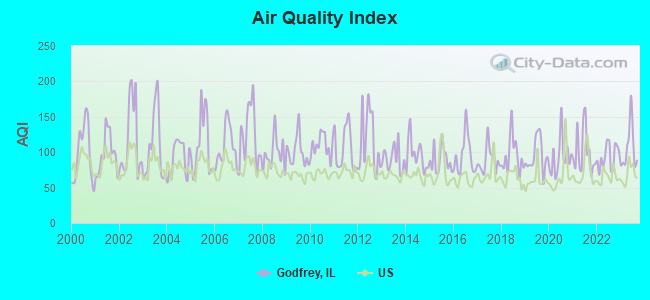
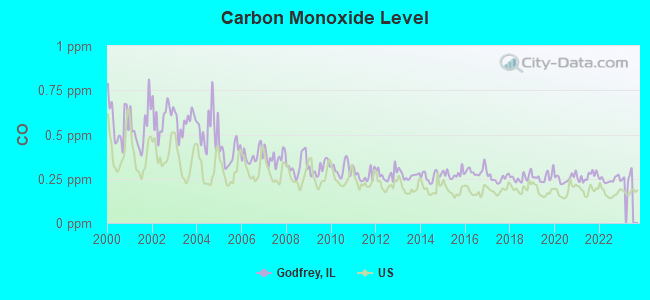
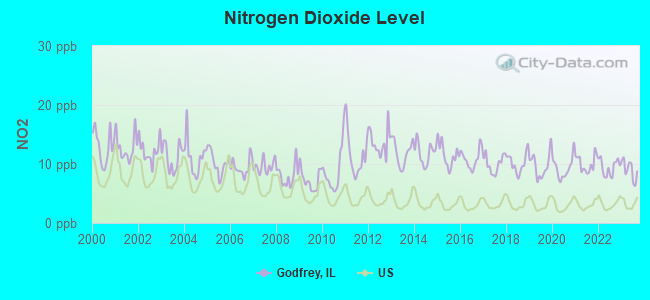
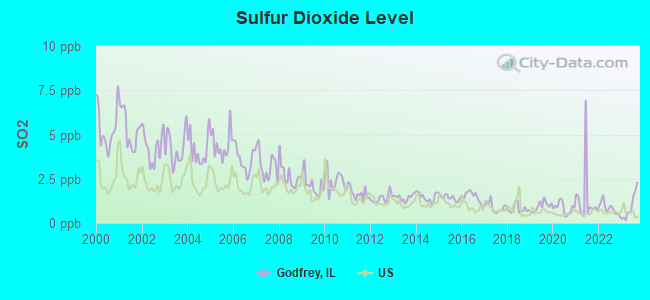
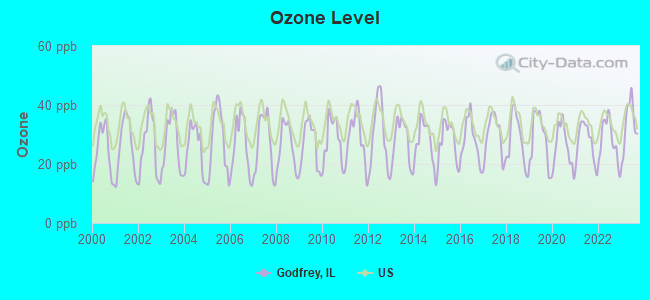

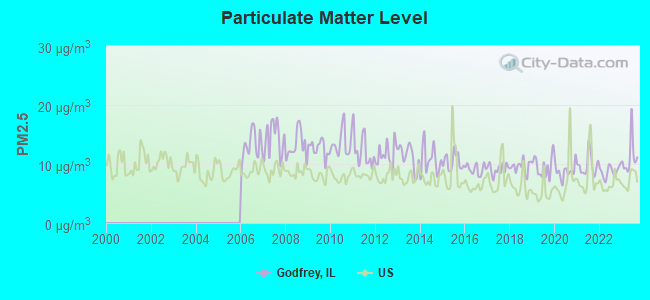
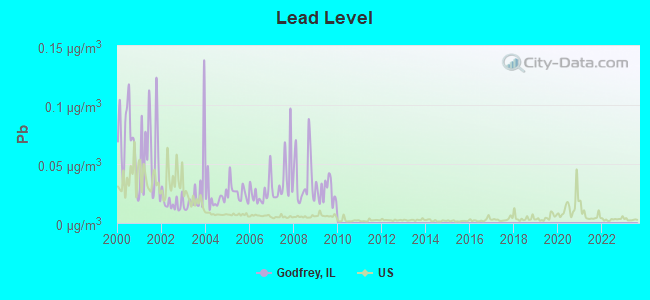
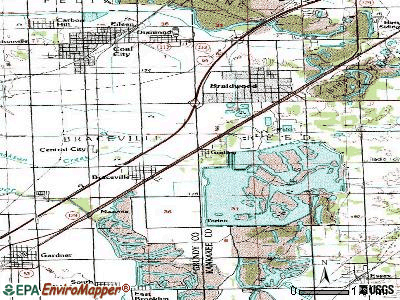
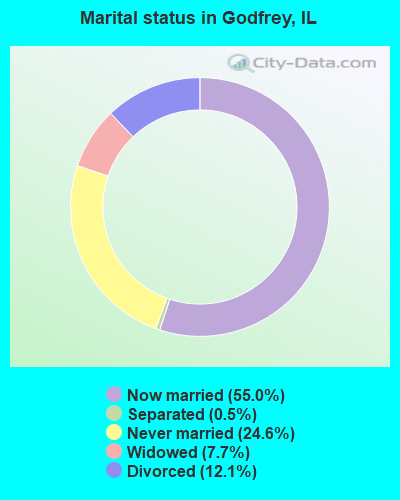
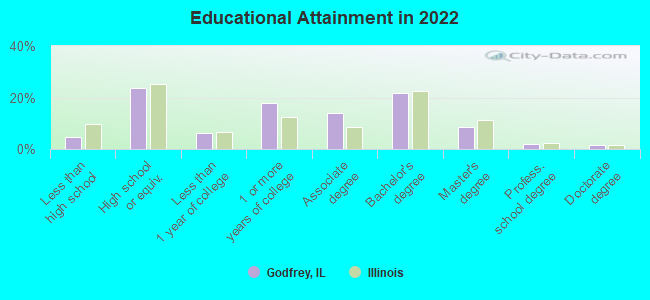
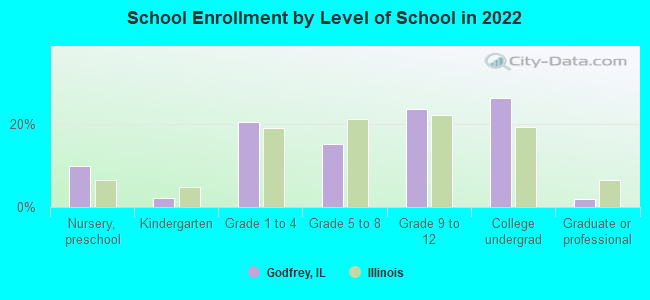
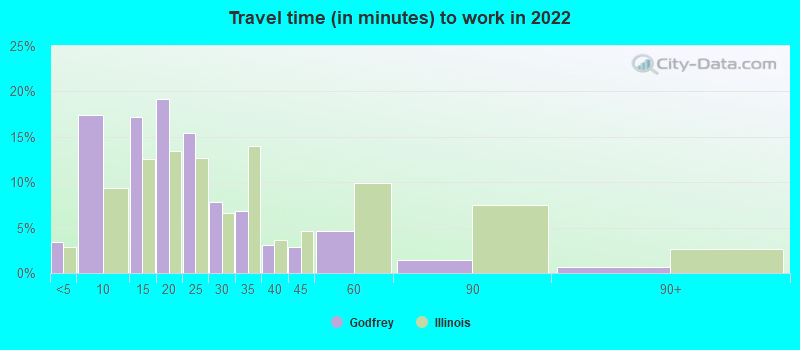
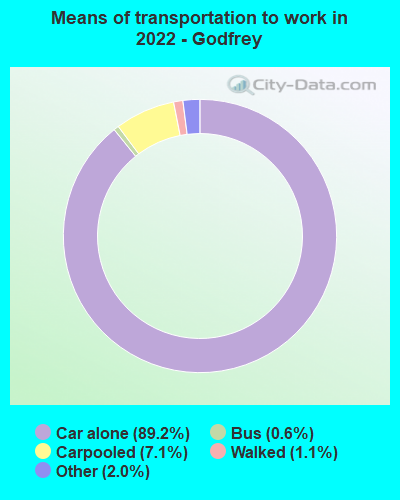
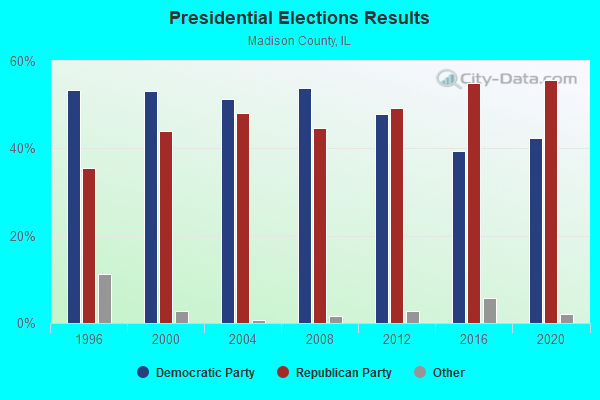
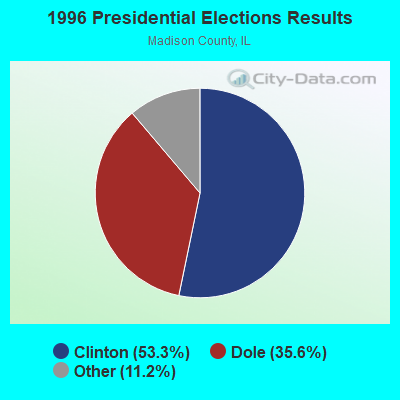
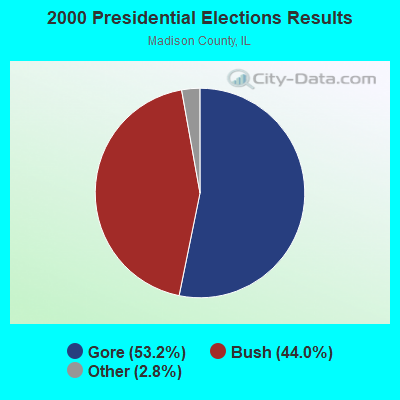
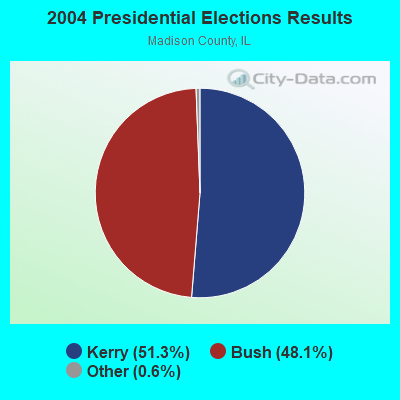
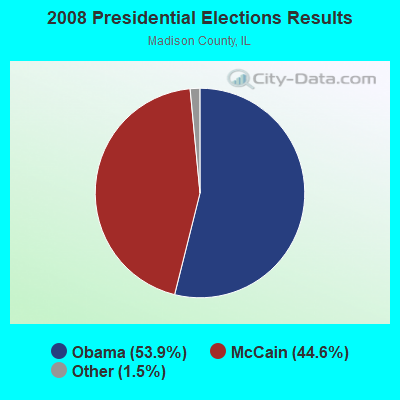
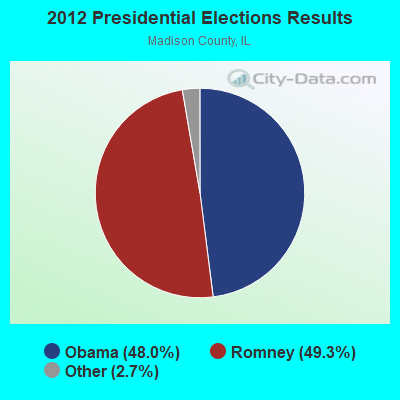
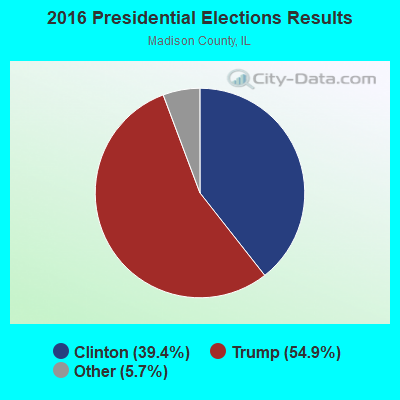
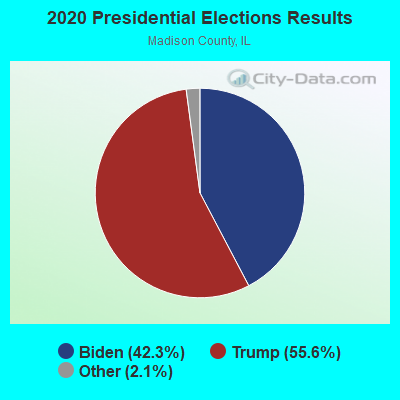
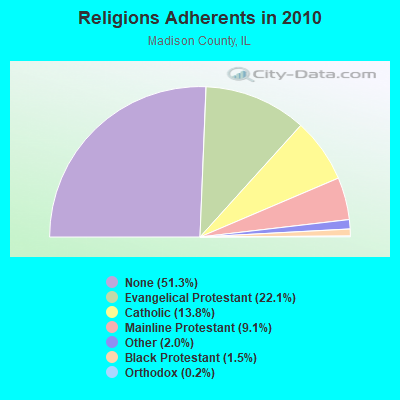
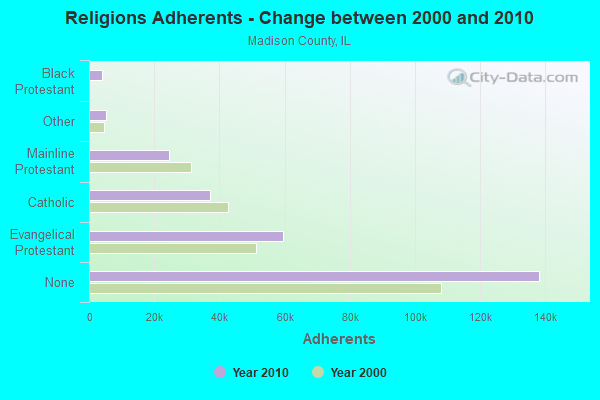
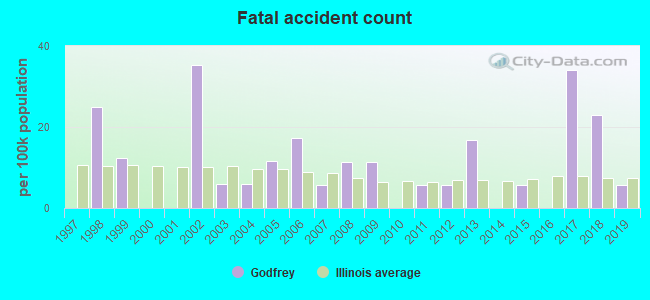
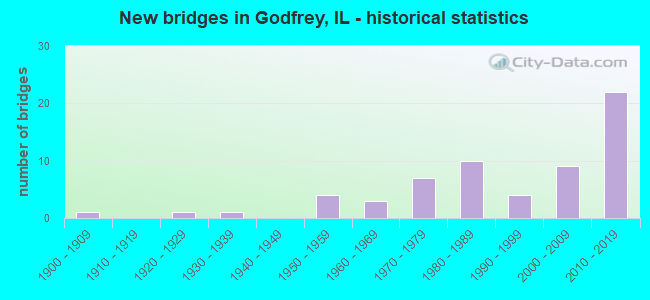
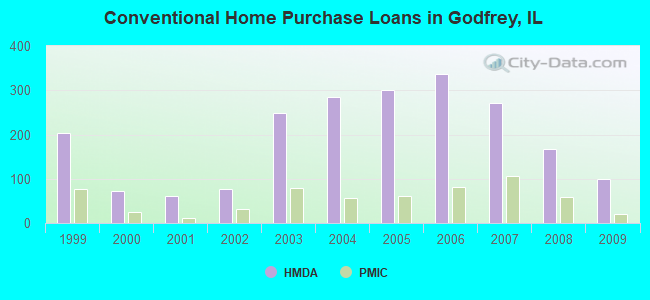
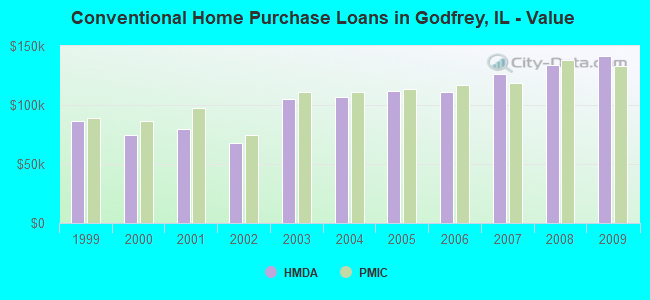
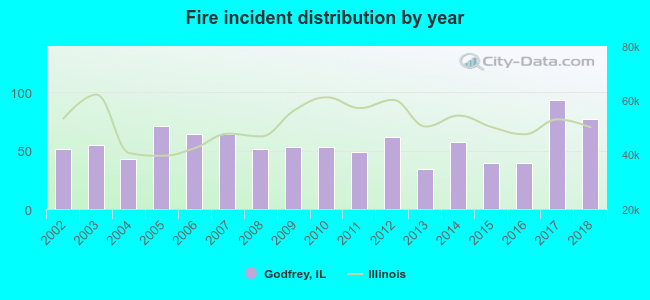 According to the data from the years 2002 - 2018 the average number of fires per year is 56. The highest number of reported fires - 93 took place in 2017, and the least - 34 in 2013. The data has a growing trend.
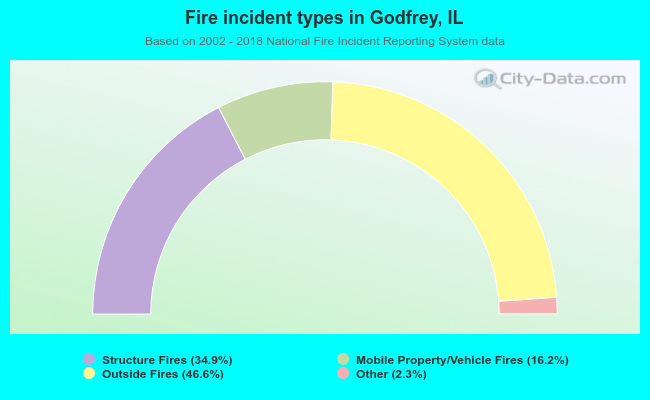 When looking into fire subcategories, the most incidents belonged to: Outside Fires (46.6%), and Structure Fires (34.9%).