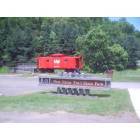
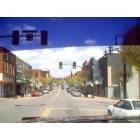
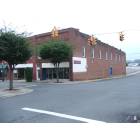
Galax, Virginia Submit your own pictures of this city and show them to the world
OSM Map
General Map
Google Map
MSN Map
OSM Map
General Map
Google Map
MSN Map
OSM Map
General Map
Google Map
MSN Map
OSM Map
General Map
Google Map
MSN Map
Please wait while loading the map...
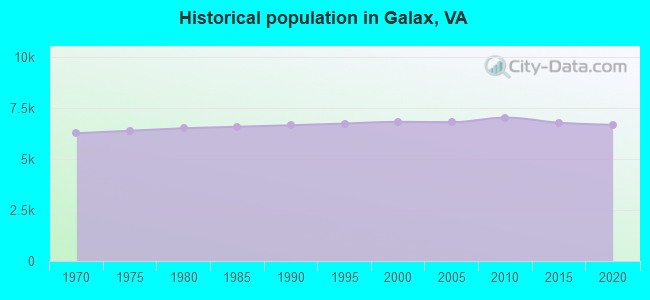
Population in 2022: 6,730 (87% urban, 13% rural). Population change since 2000: -1.6%Males: 2,996 Females: 3,734
March 2022 cost of living index in Galax: 75.5 (low, U.S. average is 100) Percentage of residents living in poverty in 2022: 22.4%for White Non-Hispanic residents , 23.4% for Black residents , 29.2% for Hispanic or Latino residents , 30.5% for two or more races residents )
Profiles of local businesses
Business Search - 14 Million verified businesses
Data:
Median household income ($)
Median household income (% change since 2000)
Household income diversity
Ratio of average income to average house value (%)
Ratio of average income to average rent
Median household income ($) - White
Median household income ($) - Black or African American
Median household income ($) - Asian
Median household income ($) - Hispanic or Latino
Median household income ($) - American Indian and Alaska Native
Median household income ($) - Multirace
Median household income ($) - Other Race
Median household income for houses/condos with a mortgage ($)
Median household income for apartments without a mortgage ($)
Races - White alone (%)
Races - White alone (% change since 2000)
Races - Black alone (%)
Races - Black alone (% change since 2000)
Races - American Indian alone (%)
Races - American Indian alone (% change since 2000)
Races - Asian alone (%)
Races - Asian alone (% change since 2000)
Races - Hispanic (%)
Races - Hispanic (% change since 2000)
Races - Native Hawaiian and Other Pacific Islander alone (%)
Races - Native Hawaiian and Other Pacific Islander alone (% change since 2000)
Races - Two or more races (%)
Races - Two or more races (% change since 2000)
Races - Other race alone (%)
Races - Other race alone (% change since 2000)
Racial diversity
Unemployment (%)
Unemployment (% change since 2000)
Unemployment (%) - White
Unemployment (%) - Black or African American
Unemployment (%) - Asian
Unemployment (%) - Hispanic or Latino
Unemployment (%) - American Indian and Alaska Native
Unemployment (%) - Multirace
Unemployment (%) - Other Race
Population density (people per square mile)
Population - Males (%)
Population - Females (%)
Population - Males (%) - White
Population - Males (%) - Black or African American
Population - Males (%) - Asian
Population - Males (%) - Hispanic or Latino
Population - Males (%) - American Indian and Alaska Native
Population - Males (%) - Multirace
Population - Males (%) - Other Race
Population - Females (%) - White
Population - Females (%) - Black or African American
Population - Females (%) - Asian
Population - Females (%) - Hispanic or Latino
Population - Females (%) - American Indian and Alaska Native
Population - Females (%) - Multirace
Population - Females (%) - Other Race
Coronavirus confirmed cases (Jul 02, 2024)
Deaths caused by coronavirus (Jul 02, 2024)
Coronavirus confirmed cases (per 100k population) (Jul 02, 2024)
Deaths caused by coronavirus (per 100k population) (Jul 02, 2024)
Daily increase in number of cases (Jul 02, 2024)
Weekly increase in number of cases (Jul 02, 2024)
Cases doubled (in days) (Jul 02, 2024)
Hospitalized patients (Apr 18, 2022)
Negative test results (Apr 18, 2022)
Total test results (Apr 18, 2022)
COVID Vaccine doses distributed (per 100k population) (Sep 19, 2023)
COVID Vaccine doses administered (per 100k population) (Sep 19, 2023)
COVID Vaccine doses distributed (Sep 19, 2023)
COVID Vaccine doses administered (Sep 19, 2023)
Likely homosexual households (%)
Likely homosexual households (% change since 2000)
Likely homosexual households - Lesbian couples (%)
Likely homosexual households - Lesbian couples (% change since 2000)
Likely homosexual households - Gay men (%)
Likely homosexual households - Gay men (% change since 2000)
Cost of living index
Median gross rent ($)
Median contract rent ($)
Median monthly housing costs ($)
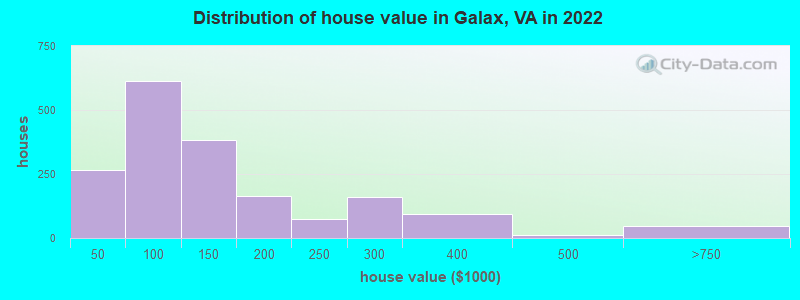
Median house or condo value ($)
Median house or condo value ($ change since 2000)
Mean house or condo value by units in structure - 1, detached ($)
Mean house or condo value by units in structure - 1, attached ($)
Mean house or condo value by units in structure - 2 ($)
Mean house or condo value by units in structure by units in structure - 3 or 4 ($)
Mean house or condo value by units in structure - 5 or more ($)
Mean house or condo value by units in structure - Boat, RV, van, etc. ($)
Mean house or condo value by units in structure - Mobile home ($)
Median house or condo value ($) - White
Median house or condo value ($) - Black or African American
Median house or condo value ($) - Asian
Median house or condo value ($) - Hispanic or Latino
Median house or condo value ($) - American Indian and Alaska Native
Median house or condo value ($) - Multirace
Median house or condo value ($) - Other Race
Median resident age
Resident age diversity
Median resident age - Males
Median resident age - Females
Median resident age - White
Median resident age - Black or African American
Median resident age - Asian
Median resident age - Hispanic or Latino
Median resident age - American Indian and Alaska Native
Median resident age - Multirace
Median resident age - Other Race
Median resident age - Males - White
Median resident age - Males - Black or African American
Median resident age - Males - Asian
Median resident age - Males - Hispanic or Latino
Median resident age - Males - American Indian and Alaska Native
Median resident age - Males - Multirace
Median resident age - Males - Other Race
Median resident age - Females - White
Median resident age - Females - Black or African American
Median resident age - Females - Asian
Median resident age - Females - Hispanic or Latino
Median resident age - Females - American Indian and Alaska Native
Median resident age - Females - Multirace
Median resident age - Females - Other Race
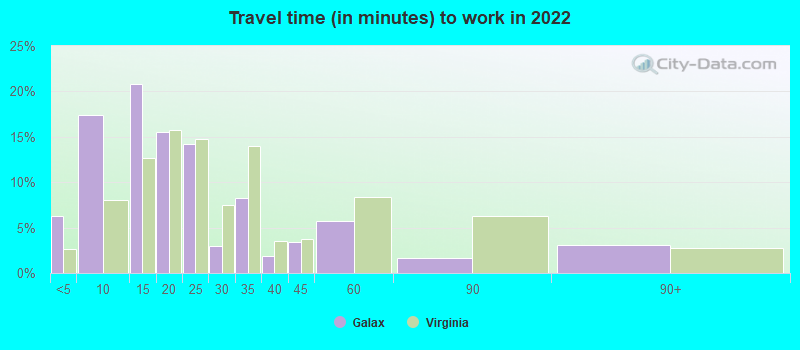
Commute - mean travel time to work (minutes)
Travel time to work - Less than 5 minutes (%)
Travel time to work - Less than 5 minutes (% change since 2000)
Travel time to work - 5 to 9 minutes (%)
Travel time to work - 5 to 9 minutes (% change since 2000)
Travel time to work - 10 to 19 minutes (%)
Travel time to work - 10 to 19 minutes (% change since 2000)
Travel time to work - 20 to 29 minutes (%)
Travel time to work - 20 to 29 minutes (% change since 2000)
Travel time to work - 30 to 39 minutes (%)
Travel time to work - 30 to 39 minutes (% change since 2000)
Travel time to work - 40 to 59 minutes (%)
Travel time to work - 40 to 59 minutes (% change since 2000)
Travel time to work - 60 to 89 minutes (%)
Travel time to work - 60 to 89 minutes (% change since 2000)
Travel time to work - 90 or more minutes (%)
Travel time to work - 90 or more minutes (% change since 2000)
Marital status - Never married (%)
Marital status - Now married (%)
Marital status - Separated (%)
Marital status - Widowed (%)
Marital status - Divorced (%)
Median family income ($)
Median family income (% change since 2000)
Median non-family income ($)
Median non-family income (% change since 2000)
Median per capita income ($)
Median per capita income (% change since 2000)
Median family income ($) - White
Median family income ($) - Black or African American
Median family income ($) - Asian
Median family income ($) - Hispanic or Latino
Median family income ($) - American Indian and Alaska Native
Median family income ($) - Multirace
Median family income ($) - Other Race
Median year house/condo built
Median year apartment built
Year house built - Built 2005 or later (%)
Year house built - Built 2000 to 2004 (%)
Year house built - Built 1990 to 1999 (%)
Year house built - Built 1980 to 1989 (%)
Year house built - Built 1970 to 1979 (%)
Year house built - Built 1960 to 1969 (%)
Year house built - Built 1950 to 1959 (%)
Year house built - Built 1940 to 1949 (%)
Year house built - Built 1939 or earlier (%)
Average household size
Household density (households per square mile)
Average household size - White
Average household size - Black or African American
Average household size - Asian
Average household size - Hispanic or Latino
Average household size - American Indian and Alaska Native
Average household size - Multirace
Average household size - Other Race
Occupied housing units (%)
Vacant housing units (%)
Owner occupied housing units (%)
Renter occupied housing units (%)
Vacancy status - For rent (%)
Vacancy status - For sale only (%)
Vacancy status - Rented or sold, not occupied (%)
Vacancy status - For seasonal, recreational, or occasional use (%)
Vacancy status - For migrant workers (%)
Vacancy status - Other vacant (%)
Residents with income below the poverty level (%)
Residents with income below 50% of the poverty level (%)
Children below poverty level (%)
Poor families by family type - Married-couple family (%)
Poor families by family type - Male, no wife present (%)
Poor families by family type - Female, no husband present (%)
Poverty status for native-born residents (%)
Poverty status for foreign-born residents (%)
Poverty among high school graduates not in families (%)
Poverty among people who did not graduate high school not in families (%)
Residents with income below the poverty level (%) - White
Residents with income below the poverty level (%) - Black or African American
Residents with income below the poverty level (%) - Asian
Residents with income below the poverty level (%) - Hispanic or Latino
Residents with income below the poverty level (%) - American Indian and Alaska Native
Residents with income below the poverty level (%) - Multirace
Residents with income below the poverty level (%) - Other Race
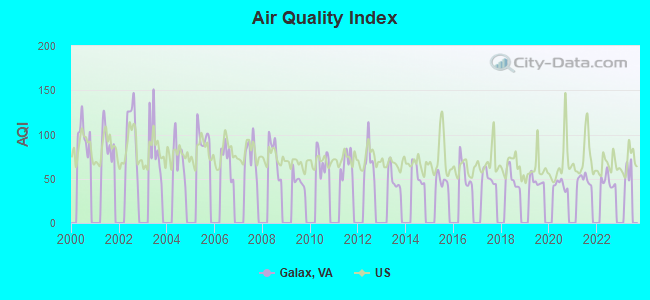
Air pollution - Air Quality Index (AQI)
Air pollution - CO
Air pollution - NO2
Air pollution - SO2
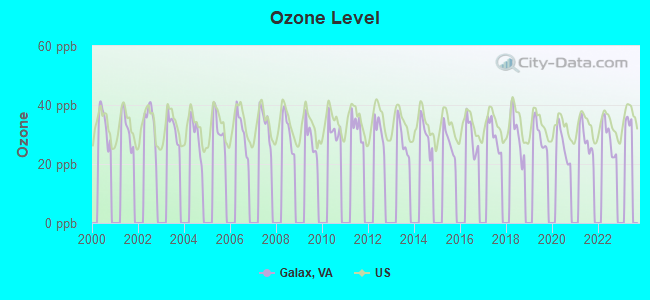
Air pollution - Ozone
Air pollution - PM10
Air pollution - PM25
Air pollution - Pb
Crime - Murders per 100,000 population
Crime - Rapes per 100,000 population
Crime - Robberies per 100,000 population
Crime - Assaults per 100,000 population
Crime - Burglaries per 100,000 population
Crime - Thefts per 100,000 population
Crime - Auto thefts per 100,000 population
Crime - Arson per 100,000 population
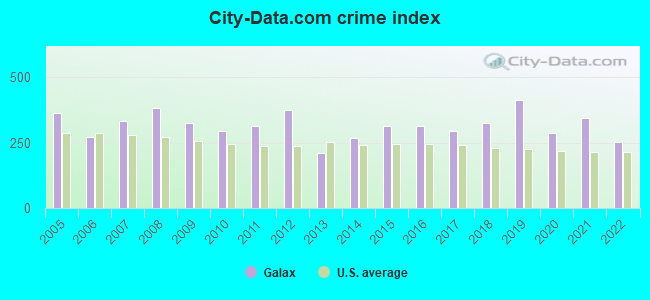
Crime - City-data.com crime index
Crime - Violent crime index
Crime - Property crime index
Crime - Murders per 100,000 population (5 year average)
Crime - Rapes per 100,000 population (5 year average)
Crime - Robberies per 100,000 population (5 year average)
Crime - Assaults per 100,000 population (5 year average)
Crime - Burglaries per 100,000 population (5 year average)
Crime - Thefts per 100,000 population (5 year average)
Crime - Auto thefts per 100,000 population (5 year average)
Crime - Arson per 100,000 population (5 year average)
Crime - City-data.com crime index (5 year average)
Crime - Violent crime index (5 year average)
Crime - Property crime index (5 year average)
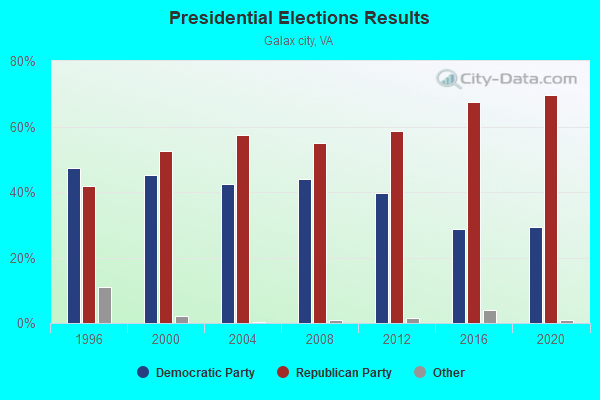
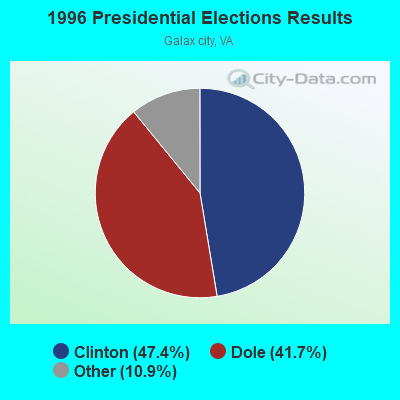
1996 Presidential Elections Results (%) - Democratic Party (Clinton)
1996 Presidential Elections Results (%) - Republican Party (Dole)
1996 Presidential Elections Results (%) - Other
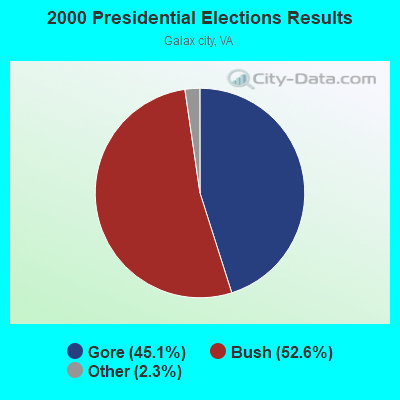
2000 Presidential Elections Results (%) - Democratic Party (Gore)
2000 Presidential Elections Results (%) - Republican Party (Bush)
2000 Presidential Elections Results (%) - Other
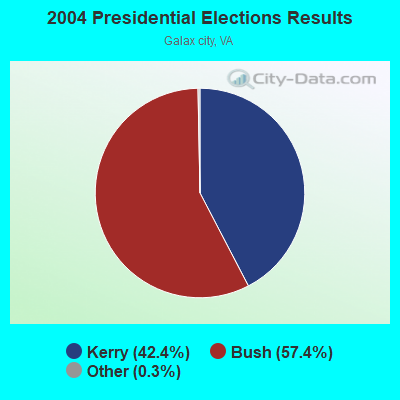
2004 Presidential Elections Results (%) - Democratic Party (Kerry)
2004 Presidential Elections Results (%) - Republican Party (Bush)
2004 Presidential Elections Results (%) - Other
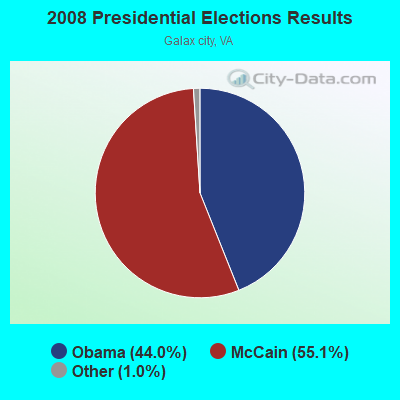
2008 Presidential Elections Results (%) - Democratic Party (Obama)
2008 Presidential Elections Results (%) - Republican Party (McCain)
2008 Presidential Elections Results (%) - Other
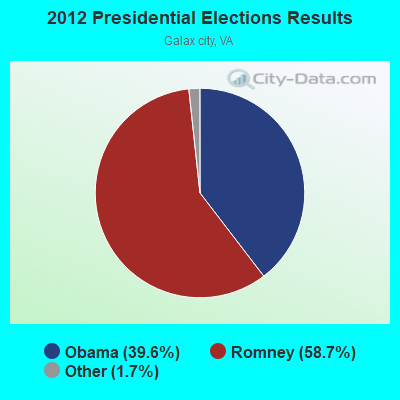
2012 Presidential Elections Results (%) - Democratic Party (Obama)
2012 Presidential Elections Results (%) - Republican Party (Romney)
2012 Presidential Elections Results (%) - Other
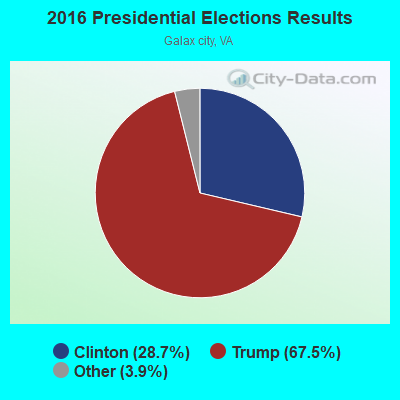
2016 Presidential Elections Results (%) - Democratic Party (Clinton)
2016 Presidential Elections Results (%) - Republican Party (Trump)
2016 Presidential Elections Results (%) - Other
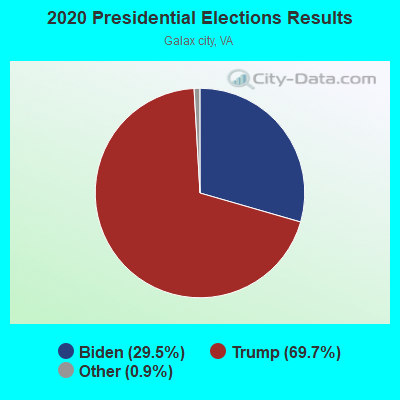
2020 Presidential Elections Results (%) - Democratic Party (Biden)
2020 Presidential Elections Results (%) - Republican Party (Trump)
2020 Presidential Elections Results (%) - Other
Ancestries Reported - Arab (%)
Ancestries Reported - Czech (%)
Ancestries Reported - Danish (%)
Ancestries Reported - Dutch (%)
Ancestries Reported - English (%)
Ancestries Reported - French (%)
Ancestries Reported - French Canadian (%)
Ancestries Reported - German (%)
Ancestries Reported - Greek (%)
Ancestries Reported - Hungarian (%)
Ancestries Reported - Irish (%)
Ancestries Reported - Italian (%)
Ancestries Reported - Lithuanian (%)
Ancestries Reported - Norwegian (%)
Ancestries Reported - Polish (%)
Ancestries Reported - Portuguese (%)
Ancestries Reported - Russian (%)
Ancestries Reported - Scotch-Irish (%)
Ancestries Reported - Scottish (%)
Ancestries Reported - Slovak (%)
Ancestries Reported - Subsaharan African (%)
Ancestries Reported - Swedish (%)
Ancestries Reported - Swiss (%)
Ancestries Reported - Ukrainian (%)
Ancestries Reported - United States (%)
Ancestries Reported - Welsh (%)
Ancestries Reported - West Indian (%)
Ancestries Reported - Other (%)
Educational Attainment - No schooling completed (%)
Educational Attainment - Less than high school (%)
Educational Attainment - High school or equivalent (%)
Educational Attainment - Less than 1 year of college (%)
Educational Attainment - 1 or more years of college (%)
Educational Attainment - Associate degree (%)
Educational Attainment - Bachelor's degree (%)
Educational Attainment - Master's degree (%)
Educational Attainment - Professional school degree (%)
Educational Attainment - Doctorate degree (%)
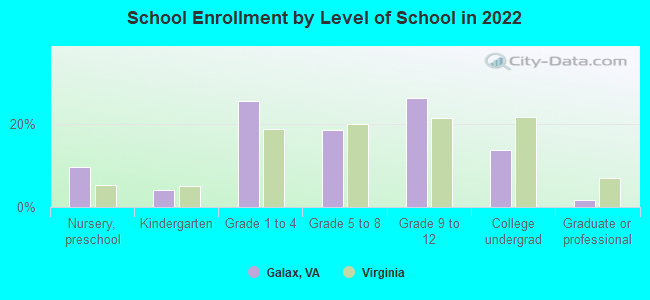
School Enrollment - Nursery, preschool (%)
School Enrollment - Kindergarten (%)
School Enrollment - Grade 1 to 4 (%)
School Enrollment - Grade 5 to 8 (%)
School Enrollment - Grade 9 to 12 (%)
School Enrollment - College undergrad (%)
School Enrollment - Graduate or professional (%)
School Enrollment - Not enrolled in school (%)
School enrollment - Public schools (%)
School enrollment - Private schools (%)
School enrollment - Not enrolled (%)
Median number of rooms in houses and condos
Median number of rooms in apartments
Housing units lacking complete plumbing facilities (%)
Housing units lacking complete kitchen facilities (%)
Density of houses
Urban houses (%)
Rural houses (%)
Households with people 60 years and over (%)
Households with people 65 years and over (%)
Households with people 75 years and over (%)
Households with one or more nonrelatives (%)
Households with no nonrelatives (%)
Population in households (%)
Family households (%)
Nonfamily households (%)
Population in families (%)
Family households with own children (%)
Median number of bedrooms in owner occupied houses
Mean number of bedrooms in owner occupied houses
Median number of bedrooms in renter occupied houses
Mean number of bedrooms in renter occupied houses
Median number of vehichles in owner occupied houses
Mean number of vehichles in owner occupied houses
Median number of vehichles in renter occupied houses
Mean number of vehichles in renter occupied houses
Mortgage status - with mortgage (%)
Mortgage status - with second mortgage (%)
Mortgage status - with home equity loan (%)
Mortgage status - with both second mortgage and home equity loan (%)
Mortgage status - without a mortgage (%)
Average family size
Average family size - White
Average family size - Black or African American
Average family size - Asian
Average family size - Hispanic or Latino
Average family size - American Indian and Alaska Native
Average family size - Multirace
Average family size - Other Race
Geographical mobility - Same house 1 year ago (%)
Geographical mobility - Moved within same county (%)
Geographical mobility - Moved from different county within same state (%)
Geographical mobility - Moved from different state (%)
Geographical mobility - Moved from abroad (%)
Place of birth - Born in state of residence (%)
Place of birth - Born in other state (%)
Place of birth - Native, outside of US (%)
Place of birth - Foreign born (%)
Housing units in structures - 1, detached (%)
Housing units in structures - 1, attached (%)
Housing units in structures - 2 (%)
Housing units in structures - 3 or 4 (%)
Housing units in structures - 5 to 9 (%)
Housing units in structures - 10 to 19 (%)
Housing units in structures - 20 to 49 (%)
Housing units in structures - 50 or more (%)
Housing units in structures - Mobile home (%)
Housing units in structures - Boat, RV, van, etc. (%)
House/condo owner moved in on average (years ago)
Renter moved in on average (years ago)
Year householder moved into unit - Moved in 1999 to March 2000 (%)
Year householder moved into unit - Moved in 1995 to 1998 (%)
Year householder moved into unit - Moved in 1990 to 1994 (%)
Year householder moved into unit - Moved in 1980 to 1989 (%)
Year householder moved into unit - Moved in 1970 to 1979 (%)
Year householder moved into unit - Moved in 1969 or earlier (%)
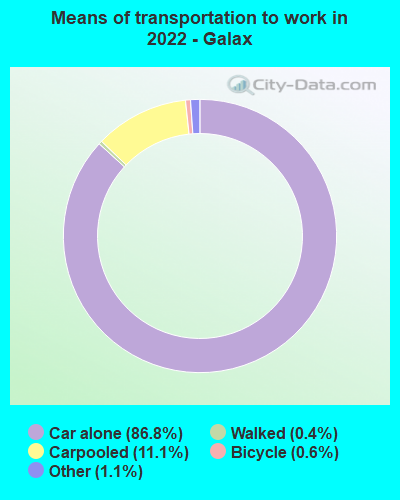
Means of transportation to work - Drove car alone (%)
Means of transportation to work - Carpooled (%)
Means of transportation to work - Public transportation (%)
Means of transportation to work - Bus or trolley bus (%)
Means of transportation to work - Streetcar or trolley car (%)
Means of transportation to work - Subway or elevated (%)
Means of transportation to work - Railroad (%)
Means of transportation to work - Ferryboat (%)
Means of transportation to work - Taxicab (%)
Means of transportation to work - Motorcycle (%)
Means of transportation to work - Bicycle (%)
Means of transportation to work - Walked (%)
Means of transportation to work - Other means (%)
Working at home (%)
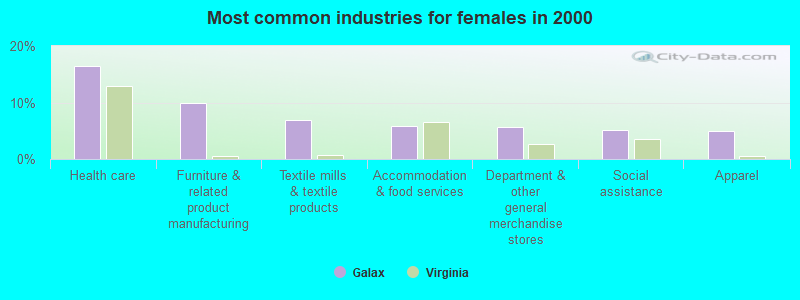
Industry diversity
Most Common Industries - Agriculture, forestry, fishing and hunting, and mining (%)
Most Common Industries - Agriculture, forestry, fishing and hunting (%)
Most Common Industries - Mining, quarrying, and oil and gas extraction (%)
Most Common Industries - Construction (%)
Most Common Industries - Manufacturing (%)
Most Common Industries - Wholesale trade (%)
Most Common Industries - Retail trade (%)
Most Common Industries - Transportation and warehousing, and utilities (%)
Most Common Industries - Transportation and warehousing (%)
Most Common Industries - Utilities (%)
Most Common Industries - Information (%)
Most Common Industries - Finance and insurance, and real estate and rental and leasing (%)
Most Common Industries - Finance and insurance (%)
Most Common Industries - Real estate and rental and leasing (%)
Most Common Industries - Professional, scientific, and management, and administrative and waste management services (%)
Most Common Industries - Professional, scientific, and technical services (%)
Most Common Industries - Management of companies and enterprises (%)
Most Common Industries - Administrative and support and waste management services (%)
Most Common Industries - Educational services, and health care and social assistance (%)
Most Common Industries - Educational services (%)
Most Common Industries - Health care and social assistance (%)
Most Common Industries - Arts, entertainment, and recreation, and accommodation and food services (%)
Most Common Industries - Arts, entertainment, and recreation (%)
Most Common Industries - Accommodation and food services (%)
Most Common Industries - Other services, except public administration (%)
Most Common Industries - Public administration (%)
Occupation diversity
Most Common Occupations - Management, business, science, and arts occupations (%)
Most Common Occupations - Management, business, and financial occupations (%)
Most Common Occupations - Management occupations (%)
Most Common Occupations - Business and financial operations occupations (%)
Most Common Occupations - Computer, engineering, and science occupations (%)
Most Common Occupations - Computer and mathematical occupations (%)
Most Common Occupations - Architecture and engineering occupations (%)
Most Common Occupations - Life, physical, and social science occupations (%)
Most Common Occupations - Education, legal, community service, arts, and media occupations (%)
Most Common Occupations - Community and social service occupations (%)
Most Common Occupations - Legal occupations (%)
Most Common Occupations - Education, training, and library occupations (%)
Most Common Occupations - Arts, design, entertainment, sports, and media occupations (%)
Most Common Occupations - Healthcare practitioners and technical occupations (%)
Most Common Occupations - Health diagnosing and treating practitioners and other technical occupations (%)
Most Common Occupations - Health technologists and technicians (%)
Most Common Occupations - Service occupations (%)
Most Common Occupations - Healthcare support occupations (%)
Most Common Occupations - Protective service occupations (%)
Most Common Occupations - Fire fighting and prevention, and other protective service workers including supervisors (%)
Most Common Occupations - Law enforcement workers including supervisors (%)
Most Common Occupations - Food preparation and serving related occupations (%)
Most Common Occupations - Building and grounds cleaning and maintenance occupations (%)
Most Common Occupations - Personal care and service occupations (%)
Most Common Occupations - Sales and office occupations (%)
Most Common Occupations - Sales and related occupations (%)
Most Common Occupations - Office and administrative support occupations (%)
Most Common Occupations - Natural resources, construction, and maintenance occupations (%)
Most Common Occupations - Farming, fishing, and forestry occupations (%)
Most Common Occupations - Construction and extraction occupations (%)
Most Common Occupations - Installation, maintenance, and repair occupations (%)
Most Common Occupations - Production, transportation, and material moving occupations (%)
Most Common Occupations - Production occupations (%)
Most Common Occupations - Transportation occupations (%)
Most Common Occupations - Material moving occupations (%)
People in Group quarters - Institutionalized population (%)
People in Group quarters - Correctional institutions (%)
People in Group quarters - Federal prisons and detention centers (%)
People in Group quarters - Halfway houses (%)
People in Group quarters - Local jails and other confinement facilities (including police lockups) (%)
People in Group quarters - Military disciplinary barracks (%)
People in Group quarters - State prisons (%)
People in Group quarters - Other types of correctional institutions (%)
People in Group quarters - Nursing homes (%)
People in Group quarters - Hospitals/wards, hospices, and schools for the handicapped (%)
People in Group quarters - Hospitals/wards and hospices for chronically ill (%)
People in Group quarters - Hospices or homes for chronically ill (%)
People in Group quarters - Military hospitals or wards for chronically ill (%)
People in Group quarters - Other hospitals or wards for chronically ill (%)
People in Group quarters - Hospitals or wards for drug/alcohol abuse (%)
People in Group quarters - Mental (Psychiatric) hospitals or wards (%)
People in Group quarters - Schools, hospitals, or wards for the mentally retarded (%)
People in Group quarters - Schools, hospitals, or wards for the physically handicapped (%)
People in Group quarters - Institutions for the deaf (%)
People in Group quarters - Institutions for the blind (%)
People in Group quarters - Orthopedic wards and institutions for the physically handicapped (%)
People in Group quarters - Wards in general hospitals for patients who have no usual home elsewhere (%)
People in Group quarters - Wards in military hospitals for patients who have no usual home elsewhere (%)
People in Group quarters - Juvenile institutions (%)
People in Group quarters - Long-term care (%)
People in Group quarters - Homes for abused, dependent, and neglected children (%)
People in Group quarters - Residential treatment centers for emotionally disturbed children (%)
People in Group quarters - Training schools for juvenile delinquents (%)
People in Group quarters - Short-term care, detention or diagnostic centers for delinquent children (%)
People in Group quarters - Type of juvenile institution unknown (%)
People in Group quarters - Noninstitutionalized population (%)
People in Group quarters - College dormitories (includes college quarters off campus) (%)
People in Group quarters - Military quarters (%)
People in Group quarters - On base (%)
People in Group quarters - Barracks, unaccompanied personnel housing (UPH), (Enlisted/Officer), ;and similar group living quarters for military personnel (%)
People in Group quarters - Transient quarters for temporary residents (%)
People in Group quarters - Military ships (%)
People in Group quarters - Group homes (%)
People in Group quarters - Homes or halfway houses for drug/alcohol abuse (%)
People in Group quarters - Homes for the mentally ill (%)
People in Group quarters - Homes for the mentally retarded (%)
People in Group quarters - Homes for the physically handicapped (%)
People in Group quarters - Other group homes (%)
People in Group quarters - Religious group quarters (%)
People in Group quarters - Dormitories (%)
People in Group quarters - Agriculture workers' dormitories on farms (%)
People in Group quarters - Job Corps and vocational training facilities (%)
People in Group quarters - Other workers' dormitories (%)
People in Group quarters - Crews of maritime vessels (%)
People in Group quarters - Other nonhousehold living situations (%)
People in Group quarters - Other noninstitutional group quarters (%)
Residents speaking English at home (%)
Residents speaking English at home - Born in the United States (%)
Residents speaking English at home - Native, born elsewhere (%)
Residents speaking English at home - Foreign born (%)
Residents speaking Spanish at home (%)
Residents speaking Spanish at home - Born in the United States (%)
Residents speaking Spanish at home - Native, born elsewhere (%)
Residents speaking Spanish at home - Foreign born (%)
Residents speaking other language at home (%)
Residents speaking other language at home - Born in the United States (%)
Residents speaking other language at home - Native, born elsewhere (%)
Residents speaking other language at home - Foreign born (%)
Class of Workers - Employee of private company (%)
Class of Workers - Self-employed in own incorporated business (%)
Class of Workers - Private not-for-profit wage and salary workers (%)
Class of Workers - Local government workers (%)
Class of Workers - State government workers (%)
Class of Workers - Federal government workers (%)
Class of Workers - Self-employed workers in own not incorporated business and Unpaid family workers (%)
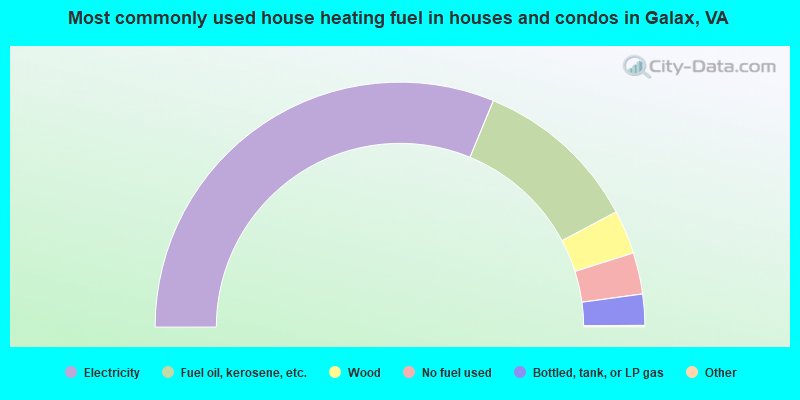
House heating fuel used in houses and condos - Utility gas (%)
House heating fuel used in houses and condos - Bottled, tank, or LP gas (%)
House heating fuel used in houses and condos - Electricity (%)
House heating fuel used in houses and condos - Fuel oil, kerosene, etc. (%)
House heating fuel used in houses and condos - Coal or coke (%)
House heating fuel used in houses and condos - Wood (%)
House heating fuel used in houses and condos - Solar energy (%)
House heating fuel used in houses and condos - Other fuel (%)
House heating fuel used in houses and condos - No fuel used (%)
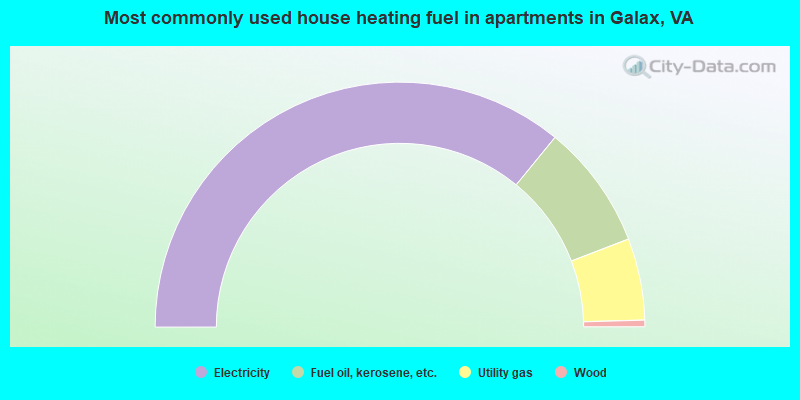
House heating fuel used in apartments - Utility gas (%)
House heating fuel used in apartments - Bottled, tank, or LP gas (%)
House heating fuel used in apartments - Electricity (%)
House heating fuel used in apartments - Fuel oil, kerosene, etc. (%)
House heating fuel used in apartments - Coal or coke (%)
House heating fuel used in apartments - Wood (%)
House heating fuel used in apartments - Solar energy (%)
House heating fuel used in apartments - Other fuel (%)
House heating fuel used in apartments - No fuel used (%)
Armed forces status - In Armed Forces (%)
Armed forces status - Civilian (%)
Armed forces status - Civilian - Veteran (%)
Armed forces status - Civilian - Nonveteran (%)
Fatal accidents locations in years 2005-2021
Fatal accidents locations in 2005
Fatal accidents locations in 2006
Fatal accidents locations in 2007
Fatal accidents locations in 2008
Fatal accidents locations in 2009
Fatal accidents locations in 2010
Fatal accidents locations in 2011
Fatal accidents locations in 2012
Fatal accidents locations in 2013
Fatal accidents locations in 2014
Fatal accidents locations in 2015
Fatal accidents locations in 2016
Fatal accidents locations in 2017
Fatal accidents locations in 2018
Fatal accidents locations in 2019
Fatal accidents locations in 2020
Fatal accidents locations in 2021
Alcohol use - People drinking some alcohol every month (%)
Alcohol use - People not drinking at all (%)
Alcohol use - Average days/month drinking alcohol
Alcohol use - Average drinks/week
Alcohol use - Average days/year people drink much
Audiometry - Average condition of hearing (%)
Audiometry - People that can hear a whisper from across a quiet room (%)
Audiometry - People that can hear normal voice from across a quiet room (%)
Audiometry - Ears ringing, roaring, buzzing (%)
Audiometry - Had a job exposure to loud noise (%)
Audiometry - Had off-work exposure to loud noise (%)
Blood Pressure & Cholesterol - Has high blood pressure (%)
Blood Pressure & Cholesterol - Checking blood pressure at home (%)
Blood Pressure & Cholesterol - Frequently checking blood cholesterol (%)
Blood Pressure & Cholesterol - Has high cholesterol level (%)
Consumer Behavior - Money monthly spent on food at supermarket/grocery store
Consumer Behavior - Money monthly spent on food at other stores
Consumer Behavior - Money monthly spent on eating out
Consumer Behavior - Money monthly spent on carryout/delivered foods
Consumer Behavior - Income spent on food at supermarket/grocery store (%)
Consumer Behavior - Income spent on food at other stores (%)
Consumer Behavior - Income spent on eating out (%)
Consumer Behavior - Income spent on carryout/delivered foods (%)
Current Health Status - General health condition (%)
Current Health Status - Blood donors (%)
Current Health Status - Has blood ever tested for HIV virus (%)
Current Health Status - Left-handed people (%)
Dermatology - People using sunscreen (%)
Diabetes - Diabetics (%)
Diabetes - Had a blood test for high blood sugar (%)
Diabetes - People taking insulin (%)
Diet Behavior & Nutrition - Diet health (%)
Diet Behavior & Nutrition - Milk product consumption (# of products/month)
Diet Behavior & Nutrition - Meals not home prepared (#/week)
Diet Behavior & Nutrition - Meals from fast food or pizza place (#/week)
Diet Behavior & Nutrition - Ready-to-eat foods (#/month)
Diet Behavior & Nutrition - Frozen meals/pizza (#/month)
Drug Use - People that ever used marijuana or hashish (%)
Drug Use - Ever used hard drugs (%)
Drug Use - Ever used any form of cocaine (%)
Drug Use - Ever used heroin (%)
Drug Use - Ever used methamphetamine (%)
Health Insurance - People covered by health insurance (%)
Kidney Conditions-Urology - Avg. # of times urinating at night
Medical Conditions - People with asthma (%)
Medical Conditions - People with anemia (%)
Medical Conditions - People with psoriasis (%)
Medical Conditions - People with overweight (%)
Medical Conditions - Elderly people having difficulties in thinking or remembering (%)
Medical Conditions - People who ever received blood transfusion (%)
Medical Conditions - People having trouble seeing even with glass/contacts (%)
Medical Conditions - People with arthritis (%)
Medical Conditions - People with gout (%)
Medical Conditions - People with congestive heart failure (%)
Medical Conditions - People with coronary heart disease (%)
Medical Conditions - People with angina pectoris (%)
Medical Conditions - People who ever had heart attack (%)
Medical Conditions - People who ever had stroke (%)
Medical Conditions - People with emphysema (%)
Medical Conditions - People with thyroid problem (%)
Medical Conditions - People with chronic bronchitis (%)
Medical Conditions - People with any liver condition (%)
Medical Conditions - People who ever had cancer or malignancy (%)
Mental Health - People who have little interest in doing things (%)
Mental Health - People feeling down, depressed, or hopeless (%)
Mental Health - People who have trouble sleeping or sleeping too much (%)
Mental Health - People feeling tired or having little energy (%)
Mental Health - People with poor appetite or overeating (%)
Mental Health - People feeling bad about themself (%)
Mental Health - People who have trouble concentrating on things (%)
Mental Health - People moving or speaking slowly or too fast (%)
Mental Health - People having thoughts they would be better off dead (%)
Oral Health - Average years since last visit a dentist
Oral Health - People embarrassed because of mouth (%)
Oral Health - People with gum disease (%)
Oral Health - General health of teeth and gums (%)
Oral Health - Average days a week using dental floss/device
Oral Health - Average days a week using mouthwash for dental problem
Oral Health - Average number of teeth
Pesticide Use - Households using pesticides to control insects (%)
Pesticide Use - Households using pesticides to kill weeds (%)
Physical Activity - People doing vigorous-intensity work activities (%)
Physical Activity - People doing moderate-intensity work activities (%)
Physical Activity - People walking or bicycling (%)
Physical Activity - People doing vigorous-intensity recreational activities (%)
Physical Activity - People doing moderate-intensity recreational activities (%)
Physical Activity - Average hours a day doing sedentary activities
Physical Activity - Average hours a day watching TV or videos
Physical Activity - Average hours a day using computer
Physical Functioning - People having limitations keeping them from working (%)
Physical Functioning - People limited in amount of work they can do (%)
Physical Functioning - People that need special equipment to walk (%)
Physical Functioning - People experiencing confusion/memory problems (%)
Physical Functioning - People requiring special healthcare equipment (%)
Prescription Medications - Average number of prescription medicines taking
Preventive Aspirin Use - Adults 40+ taking low-dose aspirin (%)
Reproductive Health - Vaginal deliveries (%)
Reproductive Health - Cesarean deliveries (%)
Reproductive Health - Deliveries resulted in a live birth (%)
Reproductive Health - Pregnancies resulted in a delivery (%)
Reproductive Health - Women breastfeeding newborns (%)
Reproductive Health - Women that had a hysterectomy (%)
Reproductive Health - Women that had both ovaries removed (%)
Reproductive Health - Women that have ever taken birth control pills (%)
Reproductive Health - Women taking birth control pills (%)
Reproductive Health - Women that have ever used Depo-Provera or injectables (%)
Reproductive Health - Women that have ever used female hormones (%)
Sexual Behavior - People 18+ that ever had sex (vaginal, anal, or oral) (%)
Sexual Behavior - Males 18+ that ever had vaginal sex with a woman (%)
Sexual Behavior - Males 18+ that ever performed oral sex on a woman (%)
Sexual Behavior - Males 18+ that ever had anal sex with a woman (%)
Sexual Behavior - Males 18+ that ever had any sex with a man (%)
Sexual Behavior - Females 18+ that ever had vaginal sex with a man (%)
Sexual Behavior - Females 18+ that ever performed oral sex on a man (%)
Sexual Behavior - Females 18+ that ever had anal sex with a man (%)
Sexual Behavior - Females 18+ that ever had any kind of sex with a woman (%)
Sexual Behavior - Average age people first had sex
Sexual Behavior - Average number of female sex partners in lifetime (males 18+)
Sexual Behavior - Average number of female vaginal sex partners in lifetime (males 18+)
Sexual Behavior - Average age people first performed oral sex on a woman (18+)
Sexual Behavior - Average number of woman performed oral sex on in lifetime (18+)
Sexual Behavior - Average number of male sex partners in lifetime (males 18+)
Sexual Behavior - Average number of male anal sex partners in lifetime (males 18+)
Sexual Behavior - Average age people first performed oral sex on a man (18+)
Sexual Behavior - Average number of male oral sex partners in lifetime (18+)
Sexual Behavior - People using protection when performing oral sex (%)
Sexual Behavior - Average number of times people have vaginal or anal sex a year
Sexual Behavior - People having sex without condom (%)
Sexual Behavior - Average number of male sex partners in lifetime (females 18+)
Sexual Behavior - Average number of male vaginal sex partners in lifetime (females 18+)
Sexual Behavior - Average number of female sex partners in lifetime (females 18+)
Sexual Behavior - Circumcised males 18+ (%)
Sleep Disorders - Average hours sleeping at night
Sleep Disorders - People that has trouble sleeping (%)
Smoking-Cigarette Use - People smoking cigarettes (%)
Taste & Smell - People 40+ having problems with smell (%)
Taste & Smell - People 40+ having problems with taste (%)
Taste & Smell - People 40+ that ever had wisdom teeth removed (%)
Taste & Smell - People 40+ that ever had tonsils teeth removed (%)
Taste & Smell - People 40+ that ever had a loss of consciousness because of a head injury (%)
Taste & Smell - People 40+ that ever had a broken nose or other serious injury to face or skull (%)
Taste & Smell - People 40+ that ever had two or more sinus infections (%)
Weight - Average height (inches)
Weight - Average weight (pounds)
Weight - Average BMI
Weight - People that are obese (%)
Weight - People that ever were obese (%)
Weight - People trying to lose weight (%)
Officers per 1,000 residents here:
3.86Virginia average:
2.24
Latest news from Galax, VA collected exclusively by city-data.com from local newspapers, TV, and radio stations
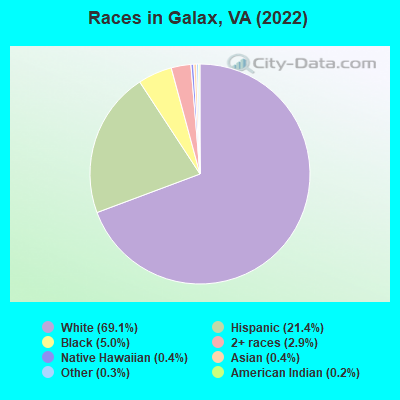
Ancestries: American (36.7%), English (8.2%), German (3.9%), Lithuanian (2.5%), Scotch-Irish (2.0%).
Current Local Time:
Land area: 8.23 square miles.
Population density: 818 people per square mile (low).
527 residents are foreign born (6.6% Latin America ).
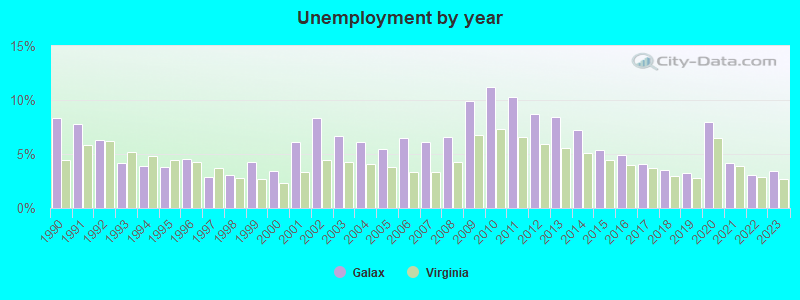
This city:
7.8%Virginia:
12.6%
Median real estate property taxes paid for housing units with mortgages in 2022: $900 (0.7%)Median real estate property taxes paid for housing units with no mortgage in 2022: $804 (0.8%)
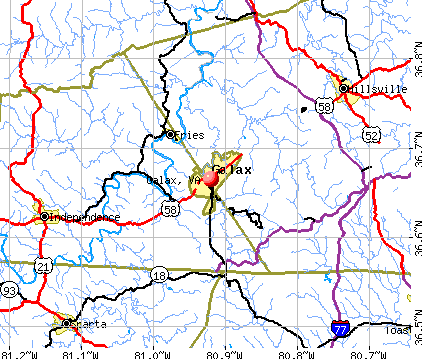
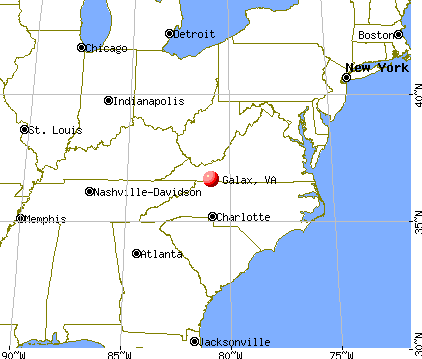
Nearest city with pop. 50,000+: Winston-Salem, NC
Nearest city with pop. 200,000+: Greensboro, NC
Nearest city with pop. 1,000,000+: Philadelphia, PA
Nearest cities:
Latitude: 36.66 N, Longitude: 80.92 W
Daytime population change due to commuting: +3,713 (+55.1%)Workers who live and work in this city: 2,111 (74.5%)
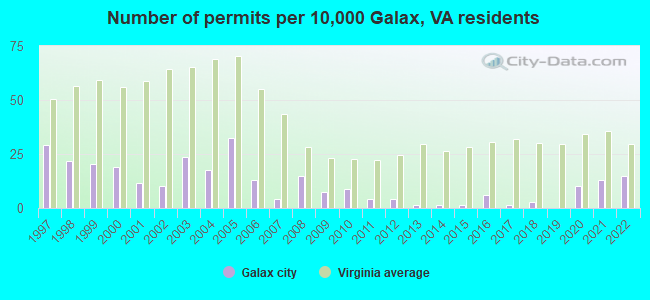
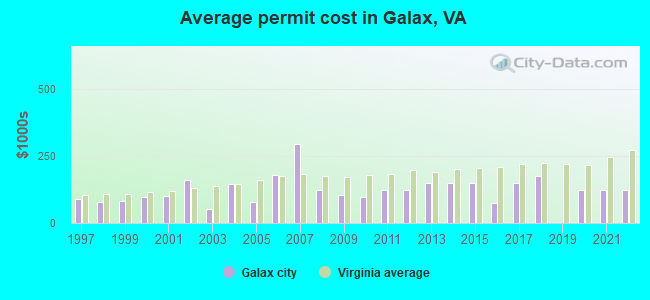
Single-family new house construction building permits:
2022: 10 buildings , average cost: $125,3002021: 9 buildings , average cost: $125,3002020: 7 buildings , average cost: $125,3002018: 2 buildings , average cost: $177,0002017: 1 building , cost: $150,0002016: 4 buildings , average cost: $72,8002015: 1 building , cost: $150,0002014: 1 building , cost: $150,0002013: 1 building , cost: $150,0002012: 3 buildings , average cost: $124,8002011: 3 buildings , average cost: $124,8002010: 6 buildings , average cost: $98,9002009: 5 buildings , average cost: $102,7002008: 10 buildings , average cost: $124,5002007: 3 buildings , average cost: $294,7002006: 9 buildings , average cost: $180,7002005: 22 buildings , average cost: $78,6002004: 12 buildings , average cost: $145,7002003: 16 buildings , average cost: $52,7002002: 7 buildings , average cost: $159,4002001: 8 buildings , average cost: $101,6002000: 13 buildings , average cost: $96,3001999: 14 buildings , average cost: $83,9001998: 15 buildings , average cost: $80,2001997: 20 buildings , average cost: $90,300Unemployment in December 2023:
Population change in the 1990s: +104 (+1.5%).
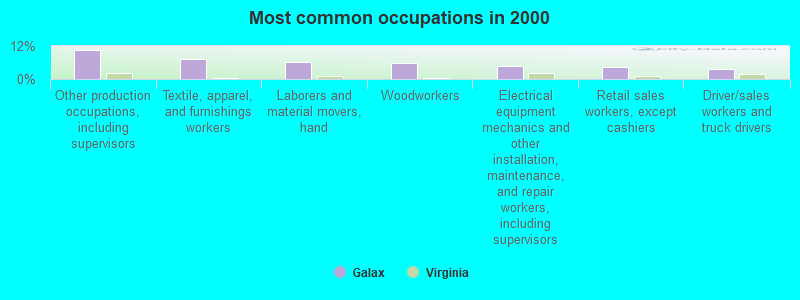
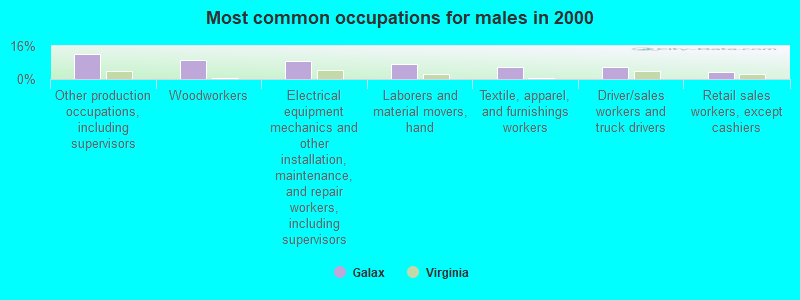
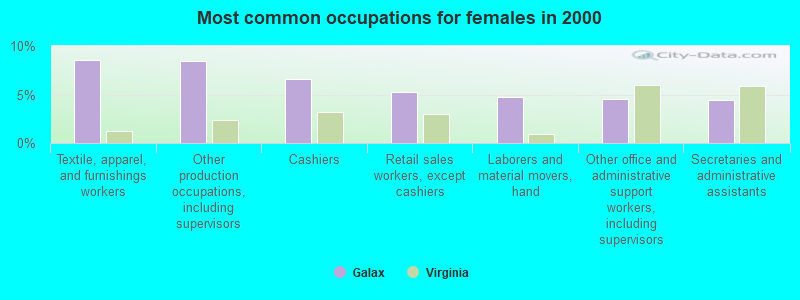
Most common occupations in Galax, VA (%)
Both Males Females
Other production occupations, including supervisors (10.4%)
Textile, apparel, and furnishings workers (7.2%)
Laborers and material movers, hand (6.1%)
Woodworkers (5.8%)
Electrical equipment mechanics and other installation, maintenance, and repair workers, including supervisors (4.6%)
Retail sales workers, except cashiers (4.2%)
Driver/sales workers and truck drivers (3.7%)
Other production occupations, including supervisors (12.3%)
Woodworkers (9.1%)
Electrical equipment mechanics and other installation, maintenance, and repair workers, including supervisors (8.7%)
Laborers and material movers, hand (7.4%)
Textile, apparel, and furnishings workers (6.0%)
Driver/sales workers and truck drivers (5.6%)
Retail sales workers, except cashiers (3.3%)
Textile, apparel, and furnishings workers (8.6%)
Other production occupations, including supervisors (8.4%)
Cashiers (6.6%)
Retail sales workers, except cashiers (5.3%)
Laborers and material movers, hand (4.7%)
Other office and administrative support workers, including supervisors (4.5%)
Secretaries and administrative assistants (4.4%)
Air pollution and air quality trends(lower is better)
AQI Ozone
Tornado activity:
Galax-area historical tornado activity is below Virginia state average. It is 59% smaller than the overall U.S. average.
On 5/7/1998, a category F4 (max. wind speeds 207-260 mph) tornado 59.3 miles away from the Galax city center injured 2 people and caused $1 million in damages.
On 8/21/1977, a category F2 (max. wind speeds 113-157 mph) tornado 22.1 miles away from the city center caused between $5000 and $50,000 in damages.
Earthquake activity:
Galax-area historical earthquake activity is significantly above Virginia state average. It is 12% smaller than the overall U.S. average. On 8/9/2020 at 12:07:37, a magnitude 5.1 (5.1 MW, Depth: 4.7 mi, Class: Moderate, Intensity: VI - VII) earthquake occurred 16.2 miles away from Galax center On 8/23/2011 at 17:51:04, a magnitude 5.8 (5.8 MW, Depth: 3.7 mi) earthquake occurred 185.4 miles away from Galax center On 7/27/1980 at 18:52:21, a magnitude 5.2 (5.1 MB, 4.7 MS, 5.0 UK, 5.2 UK) earthquake occurred 197.2 miles away from the city center On 11/2/2006 at 17:53:02, a magnitude 4.3 (4.3 MB, Depth: 0.6 mi, Class: Light, Intensity: IV - V) earthquake occurred 66.5 miles away from Galax center On 11/23/2006 at 10:42:57, a magnitude 4.3 (4.3 MB) earthquake occurred 67.5 miles away from Galax center On 8/2/1974 at 08:52:09, a magnitude 4.9 (4.3 MB, 4.9 LG) earthquake occurred 212.5 miles away from the city center Magnitude types: regional Lg-wave magnitude (LG), body-wave magnitude (MB), surface-wave magnitude (MS), moment magnitude (MW) Hospitals and medical centers in Galax: TWIN COUNTY HOSPICE (308 SOUTH MAIN STREET) TWIN COUNTY REGIONAL HOSPITAL (Voluntary non-profit - Private, 200 HOSPITAL DRIVE) BLUE RIDGE HIGHLANDS (836 GLENDALE RD PO BOX 229)
GOLDEN LIVINGCENTER - BLUE RIDGE (836 GLENDALE RD PO BOX 229)
WADDELL NURSING AND REHAB CENTER (202 PAINTER ST)
BMA - TWIN COUNTY (1159 GLENDALE RD)
BLUE RIDGE HOME HEALTH CARE (21 SHADE TREE LANE)
INTERIM HEALTHCARE OF GALAX (530 1/2 EAST STUART DR)
SOUTHWEST VA HOME HEALTH CARE (2752 GLENDALE RD)
TWIN COUNTY REGIONAL HH (818 GLENDALE ROAD, SUITE 1)
Airports located in Galax: Colleges/universities with over 2000 students nearest to Galax:
Wytheville Community College (about 22 miles; Wytheville, VA ; Full-time enrollment: 2,193)
Surry Community College (about 23 miles; Dobson, NC ; FT enrollment: 2,686)
New River Community College (about 33 miles; Dublin, VA ; FT enrollment: 3,007)
Radford University (about 39 miles; Radford, VA ; FT enrollment: 9,426)
Wilkes Community College (about 40 miles; Wilkesboro, NC ; FT enrollment: 2,292)
Virginia Polytechnic Institute and State University (about 48 miles; Blacksburg, VA ; FT enrollment: 30,984)
Wake Forest University (about 52 miles; Winston Salem, NC ; FT enrollment: 6,407)
Public high school in Galax: GALAX HIGH Students: 468, Location: 200 MAROON TIDE DR, Grades: 8-12)Private high school in Galax: LANDMARK BAPTIST ACADEMY Students: 13, Location: 101 N DEPOT AVE, Grades: 3-12)
Public elementary/middle schools in Galax: GALAX ELEM Students: 588, Location: 225 ACADEMY DRIVE, Grades: PK-4)GLADEVILLE ELEM Students: 325, Location: 3117 GLENDALE RD, Grades: PK-5)GALAX MIDDLE Students: 312, Location: 202 MAROON TIDE DR, Grades: 5-7)BAYWOOD ELEM Students: 137, Location: 247 GRAMMAR LANE, Grades: PK-5)OAKLAND ELEM Location: 4930 PIPERS GAP ROAD, Grades: PK-5)
FAIRVIEW ELEM Location: 2323 FAIRVIEW RD, Grades: KG-5)
See full list of schools located in Galax Library in Galax: GALAX-CARROLL REGIONAL LIBRARY Operating income: $573,554; Location: 610 W. STUART DRIVE; 62,205 books ; 1,761 audio materials ; 1,139 video materials ; 2 local licensed databases ; 18 state licensed databases ; 215 print serial subscriptions )
Notable location: (A) . Display/hide its location on the map
Shopping Center: (1) . Display/hide its location on the map
Churches in Galax include: (A) , Faith Temple (B) , Gladeville Church (C) , Mount Ararat Church (D) , Mount Pisgah Church (E) , Church of the Good Shepherd (F) , First Christian Church (G) , West Galax Methodist Church (H) . Display/hide their locations on the map
Cemeteries: (1) , Mount Pisgah Cemetery (2) , Gladeville Cemetery (3) , Felts Memorial Cemetery (4) , Monta Vista Cemetery (5) , Galax Cemetery (6) . Display/hide their locations on the map
Park in Galax: (1) . Display/hide its location on the map
Tourist attraction:
Hotels:
Court:
Birthplace of: Bobby Dodd - Football coach, James M. Scott (politician) - Politician.
Galax city County has a predicted average indoor radon screening level between 2 and 4 pCi/L (pico curies per liter) - Moderate Potential Drinking water stations with addresses in Galax that have no violations reported:
GALAX, CITY OF (Population served: 6,837, Primary Water Source Type: Surface water)
PATTON RV PARK (Population served: 25, Primary Water Source Type: Groundwater)
Average household size: This city:
2.3 peopleVirginia:
2.5 people
Percentage of family households: This city:
61.6%Whole state:
67.0%
Percentage of households with unmarried partners: This city:
5.2%Whole state:
5.7%
Likely homosexual households (counted as self-reported same-sex unmarried-partner households)
Lesbian couples: 0.3% of all households Gay men: 0.2% of all households
People in group quarters in Galax in 2010:
240 people in nursing facilities/skilled-nursing facilities
85 people in residential treatment centers for adults
35 people in hospitals with patients who have no usual home elsewhere
12 people in emergency and transitional shelters (with sleeping facilities) for people experiencing homelessness
5 people in mental (psychiatric) hospitals and psychiatric units in other hospitals
people in nursing homes in 2000people in other nonhousehold living situations in 2000Banks with branches in Galax (2011 data):
Wells Fargo Bank, National Association: Galax Branch at 300 N Main St, branch established on 1907/07/11; Galax Main Branch at 200 North Main Street, branch established on 1934/01/01. Info updated 2011/04/05: Bank assets: $1,161,490.0 mil, Deposits: $905,653.0 mil, headquarters in Sioux Falls, SD, positive income , 6395 total offices , Holding Company: Wells Fargo & Company
Grayson National Bank: Galax Branch at 209 West Grayson Street, branch established on 1996/05/14; Carroll Branch at 8351 Carrollton Pike, branch established on 2003/08/28. Info updated 2006/11/03: Bank assets: $345.8 mil, Deposits: $297.3 mil, headquarters in Independence, VA, negative income in the last year , 10 total offices , Holding Company: Grayson Bankshares, Inc.
Branch Banking and Trust Company: Galax Branch at 1100 East Stuart Drive, branch established on 1987/05/20. Info updated 2010/03/29: Bank assets: $168,867.6 mil, Deposits: $127,549.5 mil, headquarters in Winston Salem, NC, positive income , Commercial Lending Specialization, 1793 total offices , Holding Company: Bb&T Corporation
Carter Bank & Trust: Mountain National Bank Branch at 543 East Stuart Drive, branch established on 1996/07/01. Info updated 2007/02/23: Bank assets: $3,970.4 mil, Deposits: $3,610.0 mil, headquarters in Martinsville, VA, positive income , Commercial Lending Specialization, 123 total offices
Woodforest National Bank: Galax Virginia Branch at 1140 East Stuart Drive, branch established on 2007/06/06. Info updated 2011/05/10: Bank assets: $3,488.9 mil, Deposits: $3,097.6 mil, headquarters in Houston, TX, positive income , Commercial Lending Specialization, 766 total offices , Holding Company: Woodforest Financial Group Employee Stock Ownership Plan (With 401(K) Provisions)
First-Citizens Bank & Trust Company: Galax Plaza Branch at 540 East Stuart Drive, branch established on 1967/05/17. Info updated 2011/10/11: Bank assets: $20,566.4 mil, Deposits: $17,596.8 mil, headquarters in Raleigh, NC, positive income , Commercial Lending Specialization, 433 total offices , Holding Company: First Citizens Bancshares, Inc.
The National Bank of Blacksburg: Galax Branch at 506 East Stuart Drive, branch established on 1987/06/30. Info updated 2006/06/01: Bank assets: $1,063.8 mil, Deposits: $919.4 mil, headquarters in Blacksburg, VA, positive income , Commercial Lending Specialization, 25 total offices , Holding Company: National Bankshares, Inc.
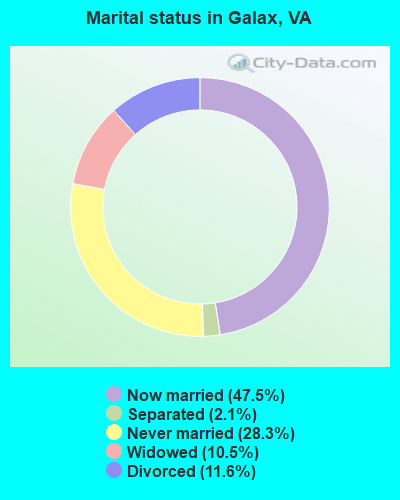
For population 15 years and over in Galax:
Never married: 28.3%Now married: 47.5%Separated: 2.1%Widowed: 10.5%Divorced: 11.6% For population 25 years and over in Galax:
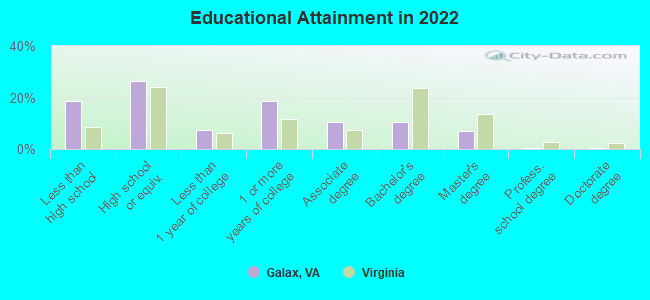
High school or higher: 80.2%Bachelor's degree or higher: 17.5%Graduate or professional degree: 7.2%Unemployed: 2.7%Mean travel time to work (commute): 15.4 minutes
Education Gini index (Inequality in education) Here:
13.0Virginia average:
12.1
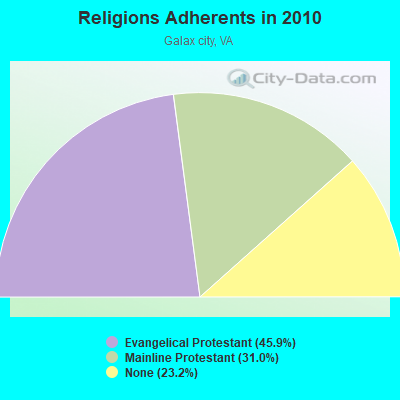
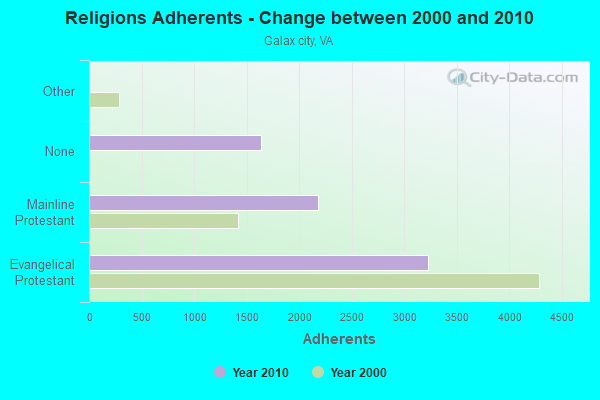
Religion statistics for Galax, VA (based on Galax city County data)
Religion Adherents Congregations Evangelical Protestant 3,229 16 Mainline Protestant 2,180 12 Other 1 1 Black Protestant - 1 None 1,632 -
Source: Clifford Grammich, Kirk Hadaway, Richard Houseal, Dale E.Jones, Alexei Krindatch, Richie Stanley and Richard H.Taylor. 2012. 2010 U.S.Religion Census: Religious Congregations & Membership Study. Association of Statisticians of American Religious Bodies. Jones, Dale E., et al. 2002. Congregations and Membership in the United States 2000. Nashville, TN: Glenmary Research Center. Graphs represent county-level data
Food Environment Statistics: Number of grocery stores : 4Galax city :
5.90 / 10,000 pop.State :
2.03 / 10,000 pop.
Number of supercenters and club stores : 1Galax city :
1.48 / 10,000 pop.Virginia :
0.17 / 10,000 pop.
Number of convenience stores (no gas) : 1This county :
1.48 / 10,000 pop.Virginia :
1.43 / 10,000 pop.
Number of convenience stores (with gas) : 8Galax city :
11.81 / 10,000 pop.Virginia :
4.03 / 10,000 pop.
Number of full-service restaurants : 14Here :
20.66 / 10,000 pop.Virginia :
7.65 / 10,000 pop.
Adult diabetes rate : Galax city :
9.7%Virginia :
9.3%
Adult obesity rate : Galax city :
26.0%State :
26.7%
Low-income preschool obesity rate : This county :
23.5%Virginia :
18.6%
Health and Nutrition: Healthy diet rate : Galax:
46.9%Virginia:
50.6%
Average overall health of teeth and gums : Galax:
42.2%Virginia:
48.6%
People feeling badly about themselves : Galax:
23.0%Virginia:
20.2%
People not drinking alcohol at all : Average hours sleeping at night : General health condition : Galax:
51.8%Virginia:
57.4%
Average condition of hearing : This city:
76.2%Virginia:
80.5%
More about Health and Nutrition of Galax, VA Residents
Local government employment and payroll (March 2022)
Function
Full-time employees
Monthly full-time payroll
Average yearly full-time wage
Part-time employees
Monthly part-time payroll
Elementary and Secondary - Instruction
148 $624,516 $50,636 42 $6,807 Elementary and Secondary - Other Total
59 $170,951 $34,770 19 $13,253 Other and Unallocable
35 $129,142 $44,277 14 $11,350 Welfare
24 $89,581 $44,791 0 $0 Police Protection - Officers
24 $103,631 $51,816 2 $6,995 Health
16 $65,049 $48,787 8 $5,487 Water Supply
15 $52,890 $42,312 0 $0 Parks and Recreation
13 $44,596 $41,166 47 $36,735 Financial Administration
10 $42,747 $51,296 1 $443 Solid Waste Management
9 $18,713 $24,951 1 $1,191 Sewerage
8 $33,566 $50,349 0 $0 Local Libraries
7 $19,298 $33,082 2 $366 Streets and Highways
6 $16,102 $32,204 0 $0 Other Government Administration
4 $27,448 $82,344 8 $704 Police - Other
2 $5,943 $35,658 0 $0 Airports
1 $3,164 $37,968 1 $321 Fire - Other
1 $4,867 $58,404 0 $0
Totals for Government
382 $1,452,204 $45,619 145 $83,653
Galax government finances - Expenditure in 2021 (per resident):
Construction - General - Other: $8,458,000 ($1256.76)
Elementary and Secondary Education: $202,000 ($30.01)Current Operations - Elementary and Secondary Education: $17,909,000 ($2661.07)
Public Welfare - Other: $4,041,000 ($600.45)Regular Highways: $2,686,000 ($399.11)Police Protection: $1,994,000 ($296.29)Housing and Community Development: $1,526,000 ($226.75)Parks and Recreation: $1,513,000 ($224.81)General - Other: $1,284,000 ($190.79)Sewerage: $1,259,000 ($187.07)Water Utilities: $1,196,000 ($177.71)Central Staff Services: $809,000 ($120.21)Judicial and Legal Services: $693,000 ($102.97)Financial Administration: $507,000 ($75.33)General Public Buildings: $461,000 ($68.50)Health - Other: $335,000 ($49.78)Local Fire Protection: $293,000 ($43.54)Solid Waste Management: $292,000 ($43.39)Libraries: $244,000 ($36.26)Correctional Institutions: $94,000 ($13.97)General - Interest on Debt: $545,000 ($80.98)
Intergovernmental to Local - Other - Elementary and Secondary Education: $72,000 ($10.70)
Other Capital Outlay - Elementary and Secondary Education: $284,000 ($42.20)
Total Salaries and Wages: $9,188,000 ($1365.23)
Galax government finances - Revenue in 2021 (per resident):
Charges - Other: $585,000 ($86.92)
Parks and Recreation: $236,000 ($35.07)Sewerage: $160,000 ($23.77)Miscellaneous Commercial Activities: $21,000 ($3.12)Solid Waste Management: $2,000 ($0.30)Federal Intergovernmental - Public Welfare: $1,351,000 ($200.74)
Housing and Community Development: $879,000 ($130.61)Highways: $389,000 ($57.80)Other: $280,000 ($41.60)Education: $55,000 ($8.17)Local Intergovernmental - Education: $323,000 ($47.99)
Miscellaneous - General Revenue - Other: $1,638,000 ($243.39)
Donations From Private Sources: $283,000 ($42.05)Fines and Forfeits: $97,000 ($14.41)Rents: $36,000 ($5.35)Interest Earnings: $19,000 ($2.82)Sale of Property: $14,000 ($2.08)Revenue - Water Utilities: $38,000 ($5.65)
State Intergovernmental - Education: $13,532,000 ($2010.70)
Highways: $2,400,000 ($356.61)Other: $2,055,000 ($305.35)Public Welfare: $807,000 ($119.91)General Local Government Support: $113,000 ($16.79)Tax - Property: $6,210,000 ($922.73)
General Sales and Gross Receipts: $2,577,000 ($382.91)Other License: $2,349,000 ($349.03)Occupation and Business License - Other: $1,146,000 ($170.28)Public Utilities Sales: $187,000 ($27.79)Documentary and Stock Transfer: $187,000 ($27.79)Motor Vehicle License: $127,000 ($18.87)Other Selective Sales: $18,000 ($2.67)
Galax government finances - Debt in 2021 (per resident):
Long Term Debt - Beginning Outstanding - Unspecified Public Purpose: $9,761,000 ($1450.37)
Outstanding Unspecified Public Purpose: $9,427,000 ($1400.74)Retired Unspecified Public Purpose: $334,000 ($49.63)
Galax government finances - Cash and Securities in 2021 (per resident):
Other Funds - Cash and Securities: $6,851,000 ($1017.98)
Businesses in Galax, VA
Name Count Name Count
Advance Auto Parts 1 Little Caesars Pizza 1 Applebee's 1 Long John Silver's 1 Arby's 1 Lowe's 1 AutoZone 1 McDonald's 1 CVS 1 Nike 2 Curves 1 Pizza Hut 1 Dunkin Donuts 1 RadioShack 1 FedEx 1 Rite Aid 1 GNC 1 Rodeway Inn 1 Goodwill 1 Rue21 1 H&R Block 1 Sears 1 Hardee's 1 Subway 2 Hilton 1 Taco Bell 1 KFC 1 U-Haul 1 Kincaid 1 U.S. Cellular 2 Knights Inn 1 UPS 3 Kroger 1 Walmart 1 La-Z-Boy 2 Wendy's 1 Lane Furniture 2
Strongest AM radio stations in Galax:
WWWJ (1360 AM; 5 kW; GALAX, VA; Owner: TWIN COUNTY BROADCASTING CORPORATION)
WPAQ (740 AM; 10 kW; MOUNT AIRY, NC; Owner: RALPH D. EPPERSON)
WTRU (830 AM; 50 kW; KERNERSVILLE, NC; Owner: TRUTH BROADCASTING CORPORATION)
WSYD (1300 AM; 10 kW; MOUNT AIRY, NC; Owner: GRANITE CITY BROADCASTING, INC.)
WHKY (1290 AM; 50 kW; HICKORY, NC; Owner: LONG COMMUNICATIONS, LLC.)
WKNV (890 AM; daytime; 10 kW; FAIRLAWN, VA; Owner: POSITIVE RADIO GROUP, INC.)
WFNR (710 AM; daytime; 10 kW; BLACKSBURG, VA; Owner: PERCEPTION MEDIA GROUP, INC.)
WKSK (580 AM; 5 kW; W.JEFFERSON, NC; Owner: CADDELL BROADCASTING, INC.)
WHHV (1400 AM; 1 kW; HILLSVILLE, VA; Owner: NEW LIFE CHRISTIAN COMMUNICATIONS, INC.)
WSGH (1040 AM; 9 kW; LEWISVILLE, NC; Owner: WINSTON-SALEM, GREENSBORO, HIGH POINT AREA RADIO)
WFGW (1010 AM; 50 kW; BLACK MOUNTAIN, NC; Owner: BLUE RIDGE BROADCASTING CORP.)
WBT (1110 AM; 50 kW; CHARLOTTE, NC; Owner: JEFFERSON-PILOT COMMUNICATNS CO. OF NORTH CAROLINA)
WYVE (1280 AM; 2 kW; WYTHEVILLE, VA; Owner: THREE RIVERS MEDIA CORPORATION)
Strongest FM radio stations in Galax:
WBRF (98.1 FM; GALAX, VA; Owner: BLUE RIDGE RADIO, INC.)
WVTR (91.9 FM; MARION, VA; Owner: VIRGINIA TECH FOUNDATION INC)
W267AN (101.3 FM; WILKESBORO, NC; Owner: TRIAD FAMILY NETWORK, INC.)
WPIN-FM (91.5 FM; DUBLIN, VA; Owner: POSITIVE ALTERNATIVE RADIO, INC.)
WPSK-FM (107.1 FM; PULASKI, VA; Owner: NEW RIVER VALLEY RADIO PARTNERS, LLC)
KHPR (88.1 FM; HONOLULU, HI; Owner: HAWAII PUBLIC RADIO)
WTQR (104.1 FM; WINSTON-SALEM, NC; Owner: CLEAR CHANNEL BROADCASTING LICENSES, INC.)
WMEV-FM (93.9 FM; MARION, VA; Owner: HOLSTON VALLEY BROADCASTING CORPORATION)
W285DJ (104.9 FM; MOUNT AIRY, NC; Owner: TRIAD FAMILY NETWORK, INC,)
WHAJ (104.5 FM; BLUEFIELD, WV; Owner: MONTEREY LICENSES, LLC)
WXLK (92.3 FM; ROANOKE, VA; Owner: MEL WHEELER, INC.)
WOLD-FM (102.5 FM; MARION, VA; Owner: EMERALD SOUND, INC.)
WSLQ (99.1 FM; ROANOKE, VA; Owner: MEL WHEELER, INC.)
WSLC-FM (94.9 FM; ROANOKE, VA; Owner: MEL WHEELER, INC.)
WKBC-FM (97.3 FM; NORTH WILKESBORO, NC; Owner: WILKES BROADCASTING COMPANY, INC.)
WVTF (89.1 FM; ROANOKE, VA; Owner: VIRGINIA TECH FOUNDATION INC)
WHKX (106.3 FM; BLUEFIELD, VA; Owner: MONTEREY LICENSES, LLC)
WROV-FM (96.3 FM; MARTINSVILLE, VA; Owner: CAPSTAR TX LIMITED PARTNERSHIP)
WKOY-FM (100.9 FM; PRINCETON, WV; Owner: MONTEREY LICENSES, LLC)
WPIB (91.1 FM; BLUEFIELD, WV; Owner: POSITIVE ALTERNATIVE RADIO, INC.)
TV broadcast stations around Galax:
WKPZ-LP (Channel 3; WYTHEVILLE, ETC., VA; Owner: HOLSTON VALLEY BROADCASTING CORPORATION)
National Bridge Inventory (NBI) Statistics 20 Number of bridges180ft / 54.7m Total length $10,196,000 Total costs22,756 Total average daily traffic609 Total average daily truck traffic28,750 Total future (year 2035) average daily traffic
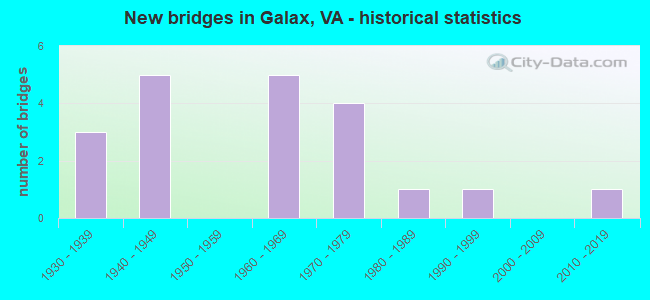
New bridges - historical statistics
3 1930-1939 5 1940-1949 5 1960-1969 4 1970-1979 1 1980-1989 1 1990-1999 1 2010-2019
See full National Bridge Inventory statistics for Galax, VA
FCC Registered Cell Phone Towers: 2 (
See the full list of FCC Registered Cell Phone Towers in Galax )
FCC Registered Antenna Towers: 64 (
See the full list of FCC Registered Antenna Towers )
FCC Registered Broadcast Land Mobile Towers: 13 (
See the full list of FCC Registered Broadcast Land Mobile Towers in Galax, VA )
FCC Registered Microwave Towers: 16 (
See the full list of FCC Registered Microwave Towers in this town )
FCC Registered Paging Towers: 3 (
See the full list of FCC Registered Paging Towers )
FCC Registered Maritime Coast & Aviation Ground Towers: 3 (
See the full list of FCC Registered Maritime Coast & Aviation Ground Towers )
FCC Registered Amateur Radio Licenses: 132 (
See the full list of FCC Registered Amateur Radio Licenses in Galax )
FAA Registered Aircraft: 7
Aircraft: PIPER PA-28-140 (Category: Land, Seats: 4, Weight: Up to 12,499 Pounds, Speed: 107 mph), Engine: LYCOMING 0-320 SERIES (180 HP) (Reciprocating)N-Number: 2351B, N2351B, N-2351B, Serial Number: 28-7325535, Year manufactured: 1973, Airworthiness Date: 06/11/1973, Certificate Issue Date: 12/28/2017Registrant (Individual): Larry Michael Diamond, 322 Fox Run Dr, Galax, VA 24333Aircraft: CESSNA 175A (Category: Land, Seats: 4, Weight: Up to 12,499 Pounds, Speed: 105 mph), Engine: CONT MOTOR GO-300 SERIES (175 HP) (Reciprocating)N-Number: 6911E, N6911E, N-6911E, Serial Number: 56411, Certificate Issue Date: 11/20/2019Registrant (Co-Owned): Brian K Williams, 3682 Hebron Rd, Galax, VA 24333, Other Owners: Felicia H WilliamsAircraft: CESSNA 172B (Category: Land, Seats: 4, Weight: Up to 12,499 Pounds, Speed: 105 mph), Engine: CONT MOTOR 0-300 SER (145 HP) (Reciprocating)N-Number: 6924X, N6924X, N-6924X, Serial Number: 17247824, Year manufactured: 1960, Airworthiness Date: 10/31/1960, Certificate Issue Date: 08/15/2020Registrant (Individual): James V Feete, 849 Edmonds Rd, Galax, VA 24333Aircraft: CESSNA 172 (Category: Land, Seats: 4, Weight: Up to 12,499 Pounds, Speed: 105 mph), Engine: CONT MOTOR 0-300 SER (145 HP) (Reciprocating)N-Number: 7356A, N7356A, N-7356A, Serial Number: 29456, Year manufactured: 1956, Airworthiness Date: 11/08/1956, Certificate Issue Date: 03/02/2020Registrant (Individual): Thomas W Littrell, 137 Crescent Dr, Galax, VA 24333Aircraft: CESSNA 182N (Category: Land, Seats: 4, Weight: Up to 12,499 Pounds, Speed: 119 mph), Engine: CONT MOTOR O-470 SERIES (230 HP) (Reciprocating)N-Number: 9270G, N9270G, N-9270G, Serial Number: 18260810, Year manufactured: 1971, Certificate Issue Date: 05/16/2001Registrant (Individual): Warren S Frye, Po Box 744, Galax, VA 24333Aircraft: FAIRCHILD M-62A (Category: Land, Seats: 2, Weight: Up to 12,499 Pounds, Speed: 97 mph), Engine: FAIRCHILD 6-440 SERIES (200 HP) (Reciprocating)N-Number: 51749, N51749, N-51749, Serial Number: T435389, Year manufactured: 1943Registrant (Individual): T J Southerland, 305 S Main St, Galax, VA 24333Deregistered: Cancel Date: 05/04/2019Aircraft: ROBINSON HELICOPTER R22 ALPHA (Category: Land, Seats: 2, Weight: Up to 12,499 Pounds), Engine: LYCOMING 0-540 SERIES (250 HP) (Reciprocating)N-Number: 8513N, N8513N, N-8513N, Serial Number: 0420, Year manufactured: 1969, Airworthiness Date: 08/19/1969, Certificate Issue Date: 02/12/2013Registrant (Individual): William M Nelson, 4047 Meadow Creek Rd, Galax, VA 24333Deregistered: Cancel Date: 04/30/1981, Exported to: Venezuela Fire-safe hotels and motels in Galax, Virginia:
Super 8, 303 N Main St, Galax, Virginia 24333 Phone: (276) 236-5127, Fax: (276) 236-9163
Hampton Inn Galax, 205 Cranberry Rd, Galax, Virginia 24333 Phone: (276) 238-4605, Fax: (276) 238-4608
Rodeway Inn, 303 N Main St, Galax, Virginia 24333 Phone: (276) 236-5127
All 3 fire-safe hotels and motels in Galax, Virginia
Most common first names in Galax, VA among deceased individuals Name Count Lived (average)
James 208 72.8 years William 154 73.0 years John 133 74.3 years Robert 110 72.7 years Mary 105 80.0 years Thomas 65 76.1 years Ruth 59 77.8 years George 55 74.8 years Charles 55 71.3 years Roy 54 72.3 years
Most common last names in Galax, VA among deceased individuals Last name Count Lived (average)
Cox 98 80.1 years Lineberry 89 77.1 years Edwards 88 77.4 years Smith 82 76.0 years Jones 74 79.0 years Davis 71 77.1 years Patton 71 76.3 years Williams 69 78.0 years Jennings 65 78.6 years Frost 60 73.3 years
Galax compared to Virginia state average:
Median household income below state average. Median house value significantly below state average. Unemployed percentage significantly below state average. Black race population percentage significantly below state average. Hispanic race population percentage above state average. Median age above state average. Foreign-born population percentage below state average. Length of stay since moving in significantly above state average. House age above state average. Institutionalized population percentage above state average. Number of college students below state average. Percentage of population with a bachelor's degree or higher below state average.
#45 on the list of "Top 101 cities with largest percentage of females in occupations: personal care and service occupations (population 5,000+)"
#47 on the list of "Top 101 cities with the highest number of rapes per 100,000 residents, excludes tourist destinations and others with a lot of outsiders visiting based on city industries data (population 5,000+)"
#89 on the list of "Top 101 cities with largest percentage of females in occupations: production occupations (population 5,000+)"
#96 on the list of "Top 101 cities with largest percentage of females in industries: manufacturing (population 5,000+)"
#97 on the list of "Top 100 high-educated but low-earning cities (pop. 5,000+)"
#5 on the list of "Top 101 counties with the smallest number of children under 18 without health insurance coverage in 2000"
Top Patent Applicants
Dustin S. Carter (1)
Mark Hoch (1)
Marc Goodson (1)
Total of 3 patent applications in 2008-2024.


 Recent articles from our blog. Our writers, many of them Ph.D. graduates or candidates, create easy-to-read articles on a wide variety of topics.

 (53.5 miles
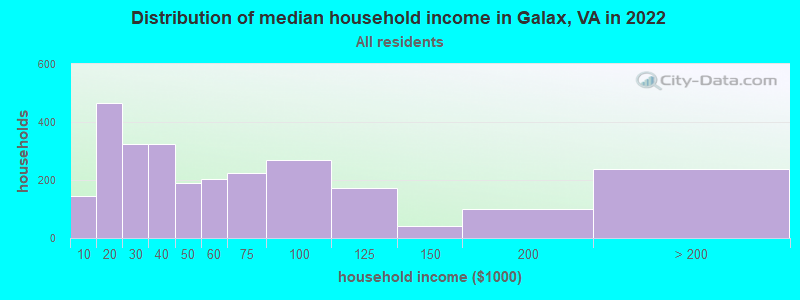


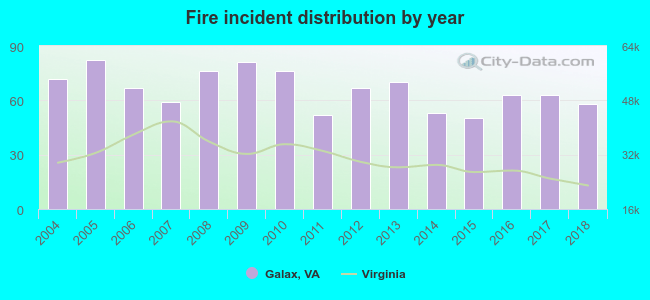 Based on the data from the years 2004 - 2018 the average number of fire incidents per year is 66. The highest number of fire incidents - 82 took place in 2005, and the least - 50 in 2015. The data has a dropping trend.
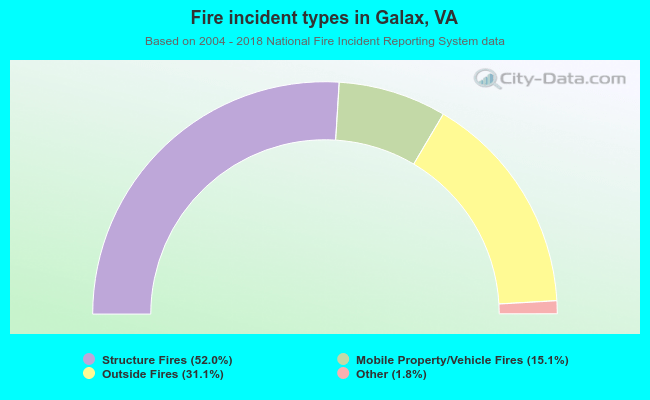 When looking into fire subcategories, the most reports belonged to: Structure Fires (52.0%), and Outside Fires (31.1%).