East Shasta, California
Submit your own pictures of this place and show them to the world
- OSM Map
- General Map
- Google Map
- MSN Map

| Males: 4,500 | |
| Females: 4,534 |
| Median resident age: | 42.4 years |
| California median age: | 33.3 years |
Zip code: 96016
| East Shasta: | $63,028 |
| CA: | $91,551 |
Estimated per capita income in 2022: $33,284 (it was $16,730 in 2000)
East Shasta CCD income, earnings, and wages data
Estimated median house or condo value in 2022: $273,952 (it was $87,100 in 2000)
| East Shasta: | $273,952 |
| CA: | $715,900 |
Mean prices in 2022: all housing units: $370,501; detached houses: $409,007; townhouses or other attached units: $359,872; in 2-unit structures: $411,184; in 3-to-4-unit structures: $437,892; in 5-or-more-unit structures: $487,419; mobile homes: $134,922; occupied boats, rvs, vans, etc.: $31,319
Detailed information about poverty and poor residents in East Shasta, CA


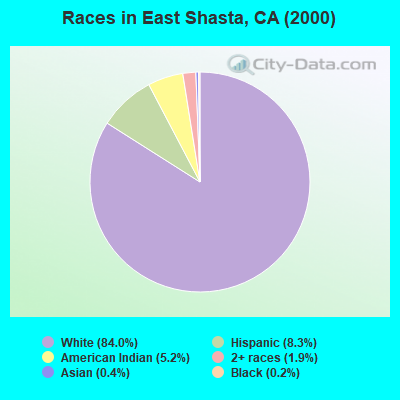
- 6,92884.0%White alone
- 6828.3%Hispanic
- 4255.2%American Indian alone
- 1591.9%Two or more races
- 360.4%Asian alone
- 140.2%Black alone
- 40.05%Native Hawaiian and Other
Pacific Islander alone - 30.04%Other race alone
 Recent articles from our blog. Our writers, many of them Ph.D. graduates or candidates, create easy-to-read articles on a wide variety of topics.

Current Local Time: PST time zone
Land area: 888.8 square miles.
Population density: 10 people per square mile (very low).

| East Shasta CCD: | 0.8% ($660) |
| California: | 0.8% ($1,564) |
Nearest city with pop. 50,000+: Redding, CA  (48.7 miles , pop. 80,865).
Nearest city with pop. 200,000+: Sacramento, CA (164.7 miles , pop. 407,018).
Nearest city with pop. 1,000,000+: Los Angeles, CA (505.1 miles , pop. 3,694,820).
Nearest cities:
), ), Latitude: 40.94 N, Longitude: 121.57 W
Area code commonly used in this area: 530

| Here: | 5.6% |
| California: | 5.1% |
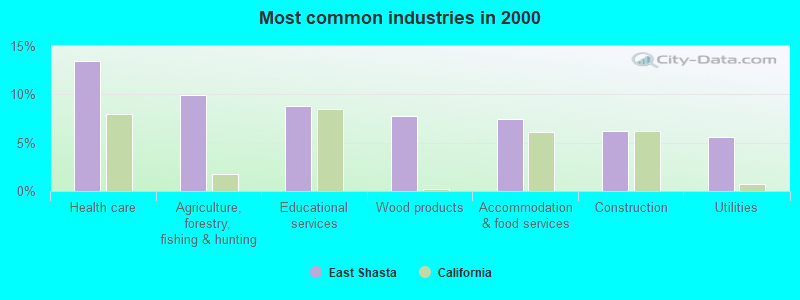
- Health care (13.4%)
- Agriculture, forestry, fishing & hunting (9.9%)
- Educational services (8.7%)
- Wood products (7.8%)
- Accommodation & food services (7.4%)
- Construction (6.2%)
- Utilities (5.6%)
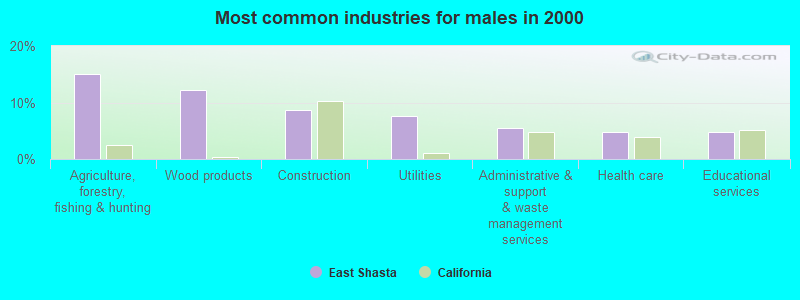
- Agriculture, forestry, fishing & hunting (15.1%)
- Wood products (12.3%)
- Construction (8.7%)
- Utilities (7.6%)
- Administrative & support & waste management services (5.5%)
- Health care (4.8%)
- Educational services (4.8%)
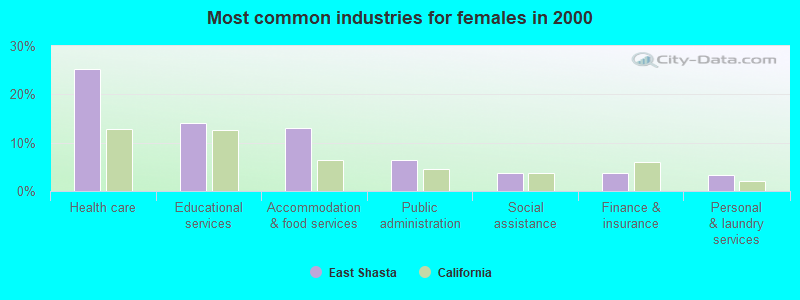
- Health care (25.2%)
- Educational services (14.2%)
- Accommodation & food services (13.0%)
- Public administration (6.5%)
- Social assistance (3.7%)
- Finance & insurance (3.6%)
- Personal & laundry services (3.2%)
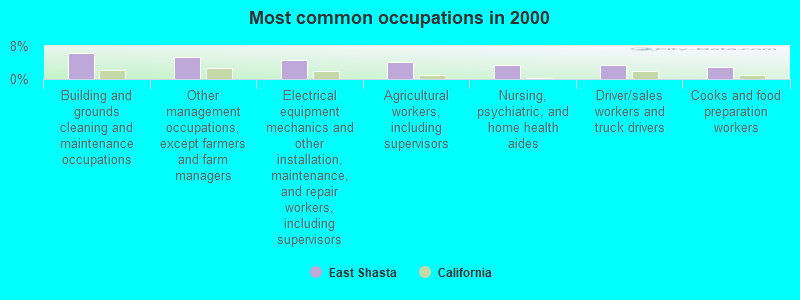
- Building and grounds cleaning and maintenance occupations (6.3%)
- Other management occupations, except farmers and farm managers (5.3%)
- Electrical equipment mechanics and other installation, maintenance, and repair workers, including supervisors (4.5%)
- Agricultural workers, including supervisors (4.0%)
- Nursing, psychiatric, and home health aides (3.4%)
- Driver/sales workers and truck drivers (3.3%)
- Cooks and food preparation workers (2.9%)
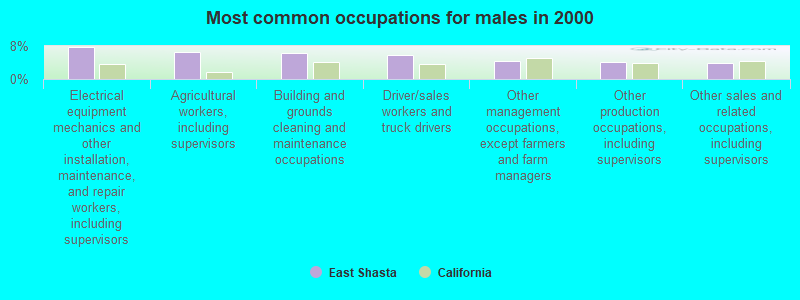
- Electrical equipment mechanics and other installation, maintenance, and repair workers, including supervisors (7.8%)
- Agricultural workers, including supervisors (6.6%)
- Building and grounds cleaning and maintenance occupations (6.3%)
- Driver/sales workers and truck drivers (5.8%)
- Other management occupations, except farmers and farm managers (4.5%)
- Other production occupations, including supervisors (4.2%)
- Other sales and related occupations, including supervisors (3.9%)
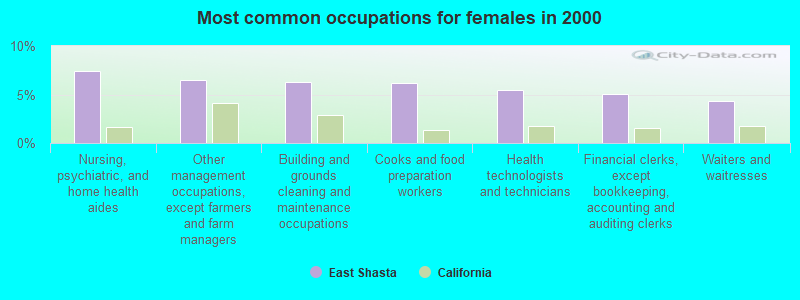
- Nursing, psychiatric, and home health aides (7.4%)
- Other management occupations, except farmers and farm managers (6.5%)
- Building and grounds cleaning and maintenance occupations (6.3%)
- Cooks and food preparation workers (6.2%)
- Health technologists and technicians (5.4%)
- Financial clerks, except bookkeeping, accounting and auditing clerks (5.0%)
- Waiters and waitresses (4.3%)
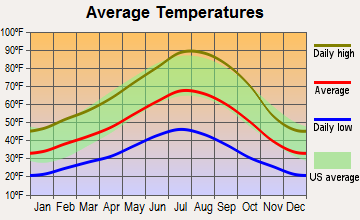
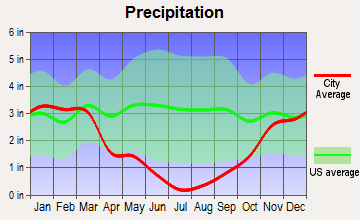
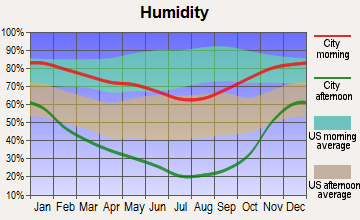
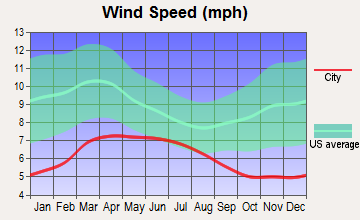
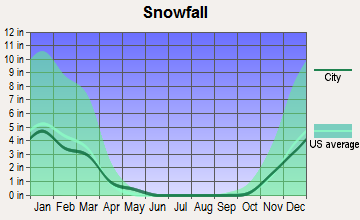
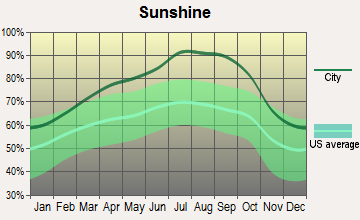
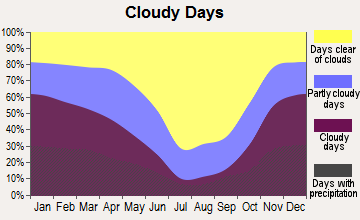
Average climate in East Shasta, California
Based on data reported by over 4,000 weather stations
Earthquake activity:
East Shasta-area historical earthquake activity is significantly above California state average. It is 4904% greater than the overall U.S. average.On 4/18/1906 at 13:12:21, a magnitude 7.9 (7.9 UK, Class: Major, Intensity: VIII - XII) earthquake occurred 216.9 miles away from East Shasta center, causing $524,000,000 total damage
On 1/31/1922 at 13:17:28, a magnitude 7.6 (7.6 UK) earthquake occurred 209.1 miles away from the city center
On 10/3/1915 at 06:52:48, a magnitude 7.6 (7.6 UK) earthquake occurred 215.5 miles away from the city center
On 4/25/1992 at 18:06:04, a magnitude 7.2 (6.3 MB, 7.1 MS, 7.2 MW, 7.1 MW, Depth: 9.4 mi) earthquake occurred 137.2 miles away from East Shasta center, causing $75,000,000 total damage
On 11/8/1980 at 10:27:34, a magnitude 7.2 (6.2 MB, 7.2 MS, 7.2 MW, 7.0 ML) earthquake occurred 142.9 miles away from East Shasta center
On 1/22/1923 at 09:04:18, a magnitude 7.2 (7.2 UK) earthquake occurred 199.2 miles away from East Shasta center
Magnitude types: body-wave magnitude (MB), local magnitude (ML), surface-wave magnitude (MS), moment magnitude (MW)
Natural disasters:
The number of natural disasters in Shasta County (29) is a lot greater than the US average (15).Major Disasters (Presidential) Declared: 13
Emergencies Declared: 4
Causes of natural disasters: Floods: 14, Fires: 12, Storms: 8, Winter Storms: 6, Landslides: 5, Mudslides: 4, Drought: 1, Heavy Rain: 1, Hurricane: 1, Tornado: 1, Wind: 1, Other: 1 (Note: some incidents may be assigned to more than one category).
Colleges/universities with over 2000 students nearest to East Shasta:
- Shasta College (about 45 miles; Redding, CA; Full-time enrollment: 5,645)
- California State University-Chico (about 85 miles; Chico, CA; FT enrollment: 14,838)
- Butte College (about 90 miles; Oroville, CA; FT enrollment: 8,649)
- Oregon Institute of Technology (about 93 miles; Klamath Falls, OR; FT enrollment: 2,900)
- Southern Oregon University (about 105 miles; Ashland, OR; FT enrollment: 4,650)
- Yuba College (about 126 miles; Marysville, CA; FT enrollment: 4,737)
- Humboldt State University (about 132 miles; Arcata, CA; FT enrollment: 7,353)
Points of interest:
Notable locations in East Shasta: Magee Trailhead (A), Horrs Four Corners (B), Butte Creek Cabin (C), Cache Cabin (D), Cave Campground (E), Cypress Campground (F), Twin Bridges Campground (G), Suicide Cabin (H), Wilcox Ranch (I), Cayton Siding (J), Dusty Campground (K), Rat Farm (not official) (L), Bidwell Ranch (M), Big Springs Campground (N), Black Ranch (O), Bridge Campground (P), Camp Britton (Q), Camp Shasta (R), Cone and Ward Ranch (S), Conrad Ranch (T). Display/hide their locations on the map
Cemeteries: Pioneer Cemetery (1), Fall River Cemetery (2), Pine Grove Cemetery (3), Burney Cemetery (4), Dana Cemetery (5). Display/hide their locations on the map
Lakes, reservoirs, and swamps: Everett Lake (A), Terry Lake (B), Grassy Lake (C), Bidwell Pond (D), Mud Lake (E), Juniper Hole (F), Big Lake (G), Murken Lake (H). Display/hide their locations on the map
Rivers and creeks: Burney Creek (A), Butte Creek (B), Spring Creek (C), Soldier Creek (D), Shelly Creek (E), Rock Creek (F), Rising River (G), Procter Creek (H), Peacock Creek (I). Display/hide their locations on the map
Parks in East Shasta include: Ahjumawi Lava Springs State Park (1), McArthur-Burney Falls Memorial State Park (2), Cinder Flats State Wildlife Area (3), Hat Creek Park (4), Washburn Bue Park (5), Burney Civic Park (6). Display/hide their locations on the map
| This place: | 2.4 people |
| California: | 2.9 people |
| This place: | 68.4% |
| Whole state: | 68.7% |
| This place: | 6.2% |
| Whole state: | 7.2% |
Likely homosexual households (counted as self-reported same-sex unmarried-partner households)
- Lesbian couples: 0.4% of all households
- Gay men: 0.1% of all households
| This place: | 18.7% |
| Whole state: | 14.2% |
| This place: | 9.7% |
| Whole state: | 6.3% |
People in group quarters in East Shasta in 2010:
- 119 people in emergency and transitional shelters (with sleeping facilities) for people experiencing homelessness
- 75 people in nursing facilities/skilled-nursing facilities
- 9 people in group homes intended for adults
- 4 people in college/university student housing
- 4 people in workers' group living quarters and job corps centers
People in group quarters in East Shasta in 2000:
- 96 people in homes or halfway houses for drug/alcohol abuse
- 83 people in nursing homes
- 64 people in other noninstitutional group quarters
- 45 people in hospitals or wards for drug/alcohol abuse
- 41 people in halfway houses
- 20 people in agriculture workers' dormitories on farms
- 13 people in other nonhousehold living situations
- 11 people in homes for the mentally retarded
- 6 people in other group homes
- 2 people in homes for the physically handicapped
For population 15 years and over in East Shasta:
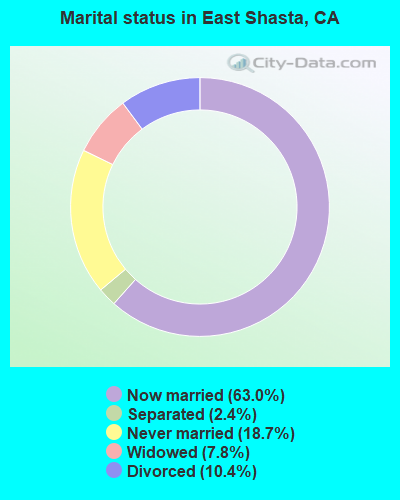
- Never married: 18.7%
- Now married: 63.0%
- Separated: 2.4%
- Widowed: 7.8%
- Divorced: 10.4%
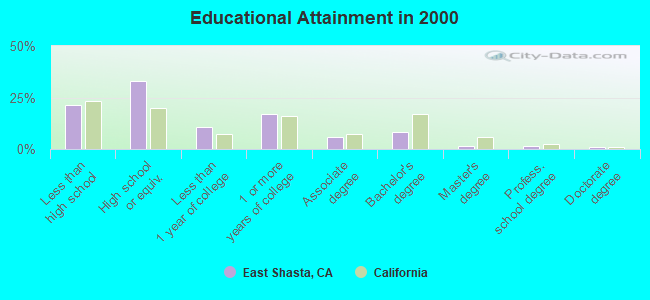
For population 25 years and over in East Shasta:
- High school or higher: 78.8%
- Bachelor's degree or higher: 12.3%
- Graduate or professional degree: 3.8%
- Unemployed: 12.6%
- Mean travel time to work (commute): 16.7 minutes
| Here: | 11.0 |
| California average: | 16.1 |
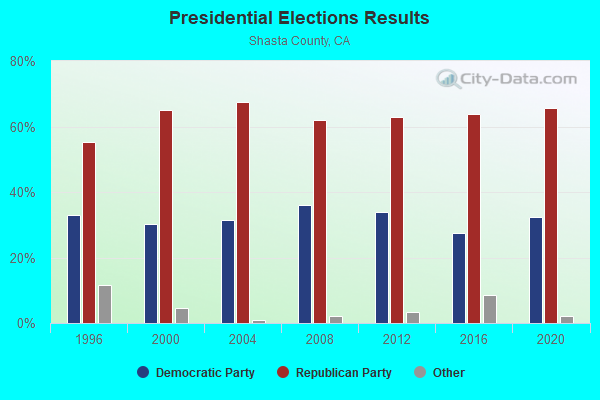
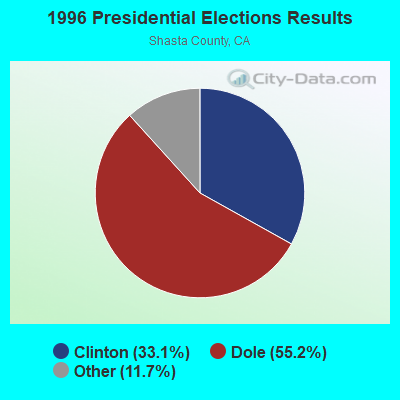
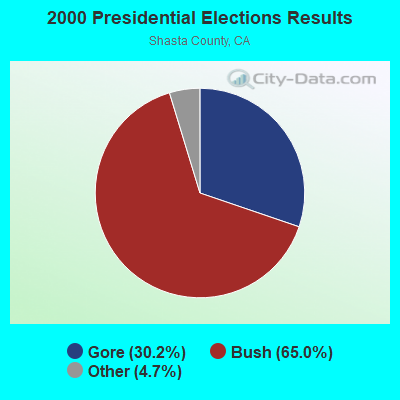
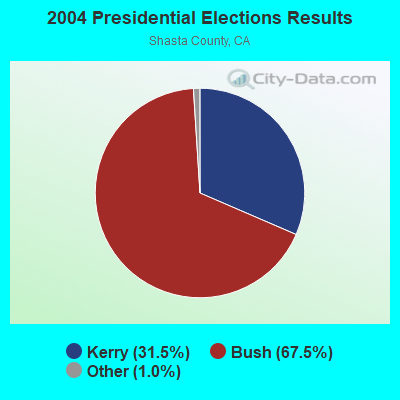
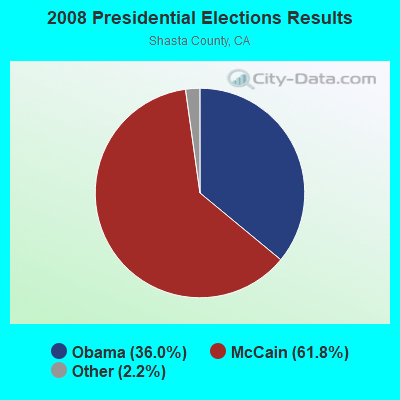
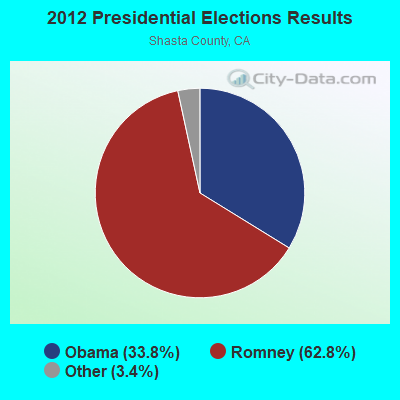
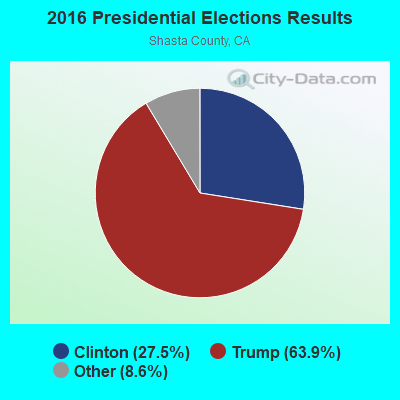

Graphs represent county-level data. Detailed 2008 Election Results
Religion statistics for East Shasta, CA (based on Shasta County data)
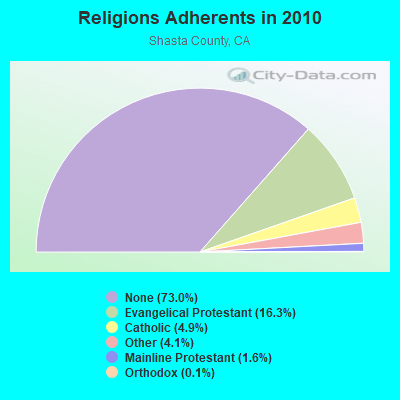
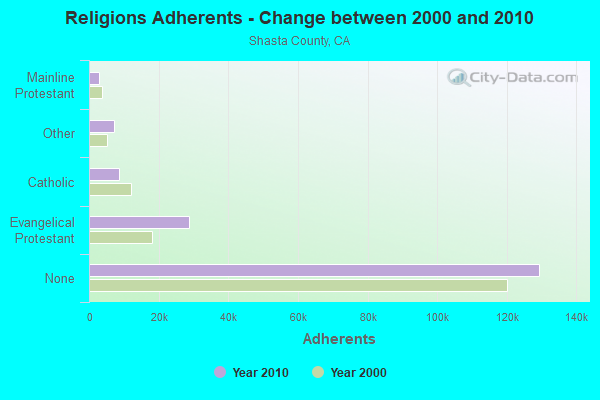
| Religion | Adherents | Congregations |
|---|---|---|
| Evangelical Protestant | 28,805 | 109 |
| Catholic | 8,629 | 8 |
| Other | 7,277 | 29 |
| Mainline Protestant | 2,830 | 12 |
| Orthodox | 191 | 5 |
| Black Protestant | 120 | 1 |
| None | 129,371 | - |
Food Environment Statistics:
| This county: | 2.35 / 10,000 pop. |
| California: | 2.14 / 10,000 pop. |
| Shasta County: | 0.06 / 10,000 pop. |
| California: | 0.04 / 10,000 pop. |
| Here: | 0.39 / 10,000 pop. |
| California: | 0.62 / 10,000 pop. |
| This county: | 3.85 / 10,000 pop. |
| California: | 1.49 / 10,000 pop. |
| Here: | 6.42 / 10,000 pop. |
| California: | 7.42 / 10,000 pop. |
| This county: | 8.0% |
| State: | 7.3% |
| Shasta County: | 25.3% |
| California: | 21.3% |
| Shasta County: | 15.4% |
| State: | 17.9% |
Strongest AM radio stations in East Shasta:
- KKOH (780 AM; 50 kW; RENO, NV; Owner: CITADEL BROADCASTING COMPANY)
- KNRO (1670 AM; 10 kW; REDDING, CA; Owner: REGENT LICENSEE OF REDDING, INC.)
- KVIP (540 AM; 2 kW; REDDING, CA; Owner: PACIFIC CASCADE COMMUNICATIONS CORP.)
- KCFJ (570 AM; 5 kW; ALTURAS, CA; Owner: EDI MEDIA, INC.)
- KCBS (740 AM; 50 kW; SAN FRANCISCO, CA; Owner: INFINITY BROADCASTING OPERATIONS, INC.)
- KFBK (1530 AM; 50 kW; SACRAMENTO, CA; Owner: AMFM RADIO LICENSES, L.L.C.)
- KFIA (710 AM; 25 kW; CARMICHAEL, CA; Owner: VISTA BROADCASTING INC.)
- KTMT (580 AM; 10 kW; ASHLAND, OR; Owner: MAPLETON COMMUNICATIONS, LLC)
- KHTK (1140 AM; 50 kW; SACRAMENTO, CA; Owner: INFINITY RADIO SUBSIDIARY OPERATIONS INC.)
- KCBC (770 AM; 50 kW; RIVERBANK, CA; Owner: KIERTRON, INC.)
- KSTE (650 AM; 25 kW; RANCHO CORDOVA, CA; Owner: AMFM RADIO LICENSES, L.L.C.)
- KNBR (680 AM; 50 kW; SAN FRANCISCO, CA; Owner: KNBR LICO, INC.)
- KAPL (1300 AM; 20 kW; PHOENIX, OR; Owner: APPLEGATE MEDIA, INC.)
Strongest FM radio stations in East Shasta:
- KNCA (89.7 FM; BURNEY, CA; Owner: OREGON STATE BOARD OF HIGHER ED.)
- K220EB (91.9 FM; BURNEY, CA; Owner: THE UNIVERSITY FOUNDATION)
- KRRX (106.1 FM; BURNEY, CA; Owner: REGENT LICENSEE OF REDDING, INC.)
- KIBC (90.5 FM; BURNEY, CA; Owner: BURNEY EDUC. BROADCASTING FOUNDATION)
- K216CM (91.1 FM; BIEBER, CA; Owner: THE UNIVERSITY FOUNDATION)
- KKRO (91.5 FM; REDDING, CA; Owner: EDUCATIONAL MEDIA FOUNDATION)
- KRDG (105.3 FM; SHINGLETOWN, CA; Owner: REGENT LICENSEE OF REDDING, INC.)
- KNSQ (88.1 FM; MOUNT SHASTA, CA; Owner: STATE OF ORE./STATE BD. OF HGR. ED.)
- KHRD (103.1 FM; WEAVERVILLE, CA; Owner: RESULTS RADIO LICENSEE, LLC)
- KNCQ (97.3 FM; REDDING, CA; Owner: RESULTS RADIO OF REDDING, LLC)
- K205EJ (88.9 FM; CHESTER, CA; Owner: CALVARY CHAPEL OF TWIN FALLS, INC.)
- KKRB (106.9 FM; KLAMATH FALLS, OR; Owner: WYNNE BROADCASTING COMPANY, INC.)
- KNTK (102.3 FM; WEED, CA; Owner: FOUR RIVERS BROADCASTING, INC.)
- KTOR (99.7 FM; WESTWOOD, CA; Owner: SIERRA RADIO, INC.)
- KBNF (98.9 FM; CHESTER, CA; Owner: CAROUSEL BROADCASTING, INC.)
- K225AJ (92.9 FM; BURNEY/REDDING, CA; Owner: CALVARY CHAPEL OF TWIN FALLS, INC.)
- K209AY (89.7 FM; CHESTER, CA; Owner: THE UNIV. FOUND. CA STATE UNIVERSITY)
- KKXS (96.1 FM; SHINGLETOWN, CA; Owner: RESULTS RADIO LICENSEE, LLC)
- KLVB-FM (102.7 FM; RED BLUFF, CA; Owner: EDUCATIONAL MEDIA FOUNDATION)
- K235AG (94.9 FM; DORRIS, CA; Owner: CALVARY CHAPEL OF TWIN FALLS, INC.)
TV broadcast stations around East Shasta:
- K27GZ (Channel 27; MARIPOSA, CA; Owner: TRINITY BROADCASTING NETWORK)
- K05DQ (Channel 5; BURNEY, ETC., CA; Owner: CALIFORNIA BROADCASTING, INC.)
- K11JM (Channel 11; FALL RIVER MILLS,ETC, CA; Owner: CALIFORNIA OREGON BROADCASTING,INC.)
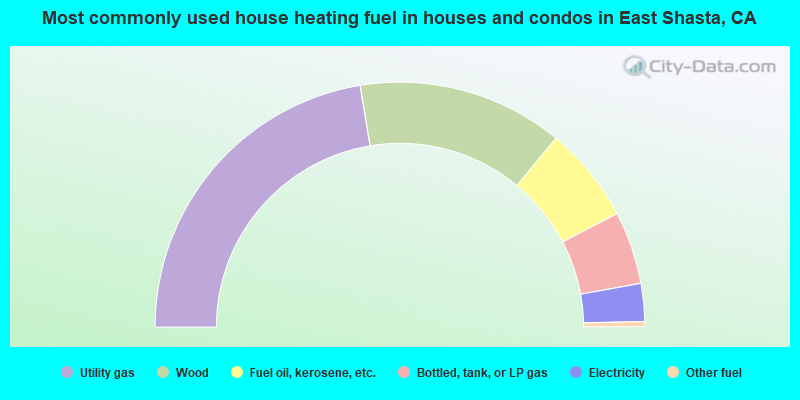
- 44.8%Utility gas
- 27.2%Wood
- 12.7%Fuel oil, kerosene, etc.
- 9.6%Bottled, tank, or LP gas
- 5.0%Electricity
- 0.7%Other fuel
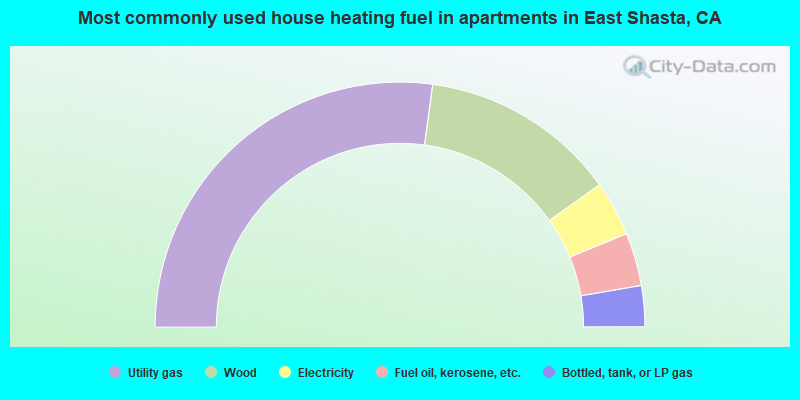
- 54.3%Utility gas
- 26.0%Wood
- 7.3%Electricity
- 7.0%Fuel oil, kerosene, etc.
- 5.4%Bottled, tank, or LP gas
East Shasta compared to California state average:
- Median house value significantly below state average.
- Black race population percentage significantly below state average.
- Hispanic race population percentage significantly below state average.
- Median age significantly above state average.
- Foreign-born population percentage significantly below state average.
- Length of stay since moving in significantly above state average.
- Number of rooms per house significantly below state average.
- House age significantly below state average.
- Number of college students below state average.
- Percentage of population with a bachelor's degree or higher below state average.
East Shasta on our top lists:
- #4 on the list of "Top 101 cities with largest percentage of females in occupations: motor vehicle operators except bus and truck drivers (population 5,000+)"
- #5 on the list of "Top 101 cities with largest percentage of females in occupations: other construction workers and helpers (population 5,000+)"
- #6 on the list of "Top 101 cities with largest percentage of females in industries: drugs, sundries, and chemical and allied products merchant wholesalers (population 5,000+)"
- #6 on the list of "Top 101 cities with largest percentage of males in occupations: woodworkers (population 5,000+)"
- #8 on the list of "Top 101 cities with largest percentage of males in industries: wood products (population 5,000+)"
- #9 on the list of "Top 101 cities with largest percentage of females in industries: petroleum and petroleum products merchant wholesalers (population 5,000+)"
- #10 on the list of "Top 101 cities with largest percentage of females in occupations: extraction workers (population 5,000+)"
- #15 on the list of "Top 101 cities with largest percentage of females in occupations: financial clerks except bookkeeping, accounting, and auditing clerks (population 5,000+)"
- #17 on the list of "Top 101 cities with largest percentage of males in occupations: fishing and hunting, and forest and logging workers (population 5,000+)"
- #22 on the list of "Top 101 cities with largest percentage of females in industries: health care (population 5,000+)"
- #29 on the list of "Top 101 cities with largest percentage of females in industries: wood products (population 5,000+)"
- #33 on the list of "Top 101 cities with the largest percentage of people in halfway houses (population 1,000+)"
- #41 on the list of "Top 101 cities with the largest percentage of people in hospitals or wards for drug/alcohol abuse (population 1,000+)"
- #48 on the list of "Top 101 cities with the largest percentage of people in homes or halfway houses for drug/alcohol abuse (population 1,000+)"
- #51 on the list of "Top 101 cities with largest percentage of males in industries: utilities (population 5,000+)"
- #59 on the list of "Top 100 cities with largest land areas (pop. 5,000+)"
- #84 on the list of "Top 101 cities with largest percentage of males in industries: food and beverage stores (population 5,000+)"
- #85 on the list of "Top 101 cities with largest percentage of females in industries: utilities (population 5,000+)"
- #91 on the list of "Top 101 cities with largest percentage of females in industries: u. s. postal service (population 5,000+)"
- #8 (96016) on the list of "Top 101 zip codes with the largest percentage of Greek first ancestries"
- #23 on the list of "Top 101 counties with the largest increase in the number of births per 1000 residents 2000-2006 to 2007-2013 (pop 50,000+)"
- #27 on the list of "Top 101 counties with the smallest number of children under 18 without health insurance coverage in 2000 (pop. 50,000+)"
- #55 on the list of "Top 101 counties with the lowest Particulate Matter (PM2.5) Annual air pollution readings in 2012 (µg/m3)"
- #60 on the list of "Top 101 counties with the largest increase in the number of deaths per 1000 residents 2000-2006 to 2007-2013 (pop. 50,000+)"
- #66 on the list of "Top 101 counties with the lowest Particulate Matter (PM10) Annual air pollution readings in 2012 (µg/m3)"