East Lansdowne, Pennsylvania
Submit your own pictures of this borough and show them to the world
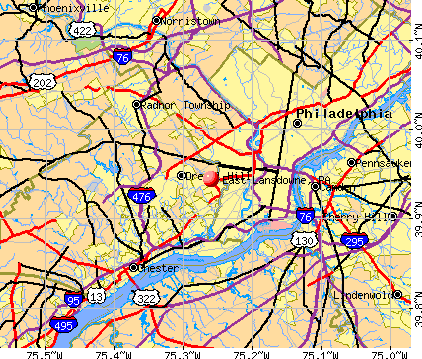
- OSM Map
- General Map
- Google Map
- MSN Map
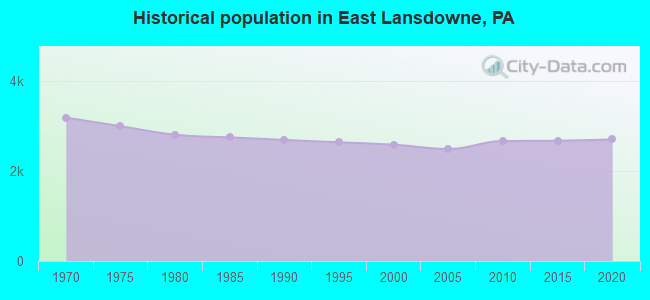
Population change since 2000: +3.9%
 |
| Males: 1,242 | |
| Females: 1,444 |
| Median resident age: | 35.5 years |
| Pennsylvania median age: | 40.9 years |
Zip codes: 19050.
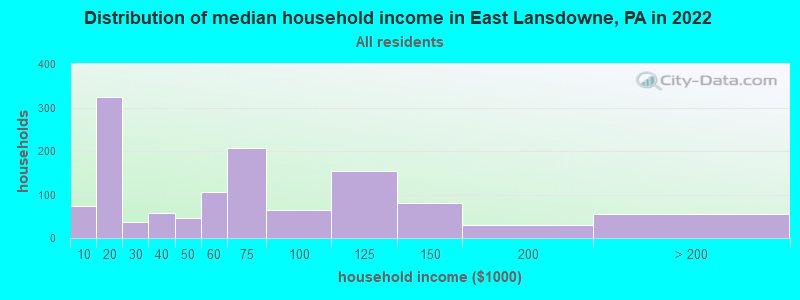
| East Lansdowne: | $56,153 |
| PA: | $71,798 |
Estimated per capita income in 2022: $32,475 (it was $19,558 in 2000)
East Lansdowne borough income, earnings, and wages data
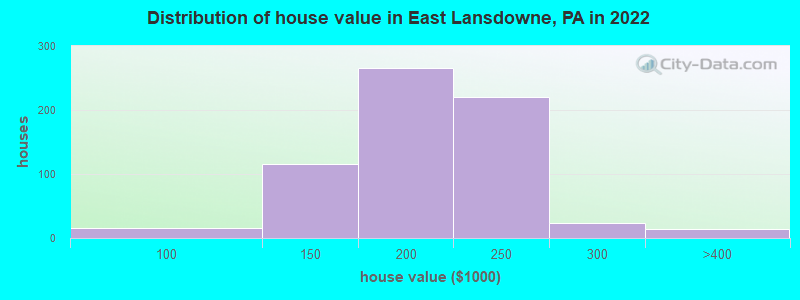
Estimated median house or condo value in 2022: $188,498 (it was $79,700 in 2000)
| East Lansdowne: | $188,498 |
| PA: | $245,500 |
Mean prices in 2022: all housing units: $208,023; detached houses: $220,483; townhouses or other attached units: $179,366; in 2-unit structures: $224,073
Median gross rent in 2022: $1,486.
East Lansdowne, PA residents, houses, and apartments details
(18.3% for White Non-Hispanic residents, 14.9% for Black residents)
Detailed information about poverty and poor residents in East Lansdowne, PA
Compare current foreclosures near East Lansdowne, PA:
| Photo | Address | Area | Beds / Baths | Price | Details |
|---|---|---|---|---|---|

|
#1
Yeadon Ave
Lansdowne, PA 19050
|
1,388 sq. feet
|
1 baths 3 beds |
$268,500
|
show details |

|
#2
Manchester Rd
Elkins Park, PA 19027
|
3,444 sq. feet
|
2 baths 3 beds |
$548,900
|
show details |

|
#3
N 5th St
Philadelphia, PA 19126
|
1,420 sq. feet
|
2 baths 3 beds |
$313,900
|
show details |

|
#4
Buchanan Ave
Folsom, PA 19033
|
3,087 sq. feet
|
3 baths 4 beds |
$566,500
|
show details |

|
#5
Browning Rd
Merchantville, NJ 08109
|
2,376 sq. feet
|
3 baths 5 beds |
$459,900
|
show details |

|
#6
Jessamine Ave
Oaklyn, NJ 08107
|
864 sq. feet
|
2 baths 5 beds |
$379,900
|
show details |

|
#7
Covered Bridge Rd
Cherry Hill, NJ 08034
|
1,343 sq. feet
|
1 baths 3 beds |
$445,000
|
show details |

|
#8
N Marshall St
Philadelphia, PA 19122
|
1,769 sq. feet
|
2 baths 3 beds |
$414,500
|
show details |

|
#9
Edgewood Ave
Audubon, NJ 08106
|
1,250 sq. feet
|
1 baths 4 beds |
$340,000
|
show details |

|
#10
Harmer St
Philadelphia, PA 19131
|
1,134 sq. feet
|
1 baths 3 beds |
$70,000
|
show details |
| Photo | Address | Area | Beds / Baths | Price | Details |
|---|---|---|---|---|---|

|
#11
Christian St
Philadelphia, PA 19146
|
1,612 sq. feet
|
2 baths 5 beds |
$449,900
|
show details |

|
#12
Kershaw St
Philadelphia, PA 19131
|
1,284 sq. feet
|
1 baths 3 beds |
$134,500
|
show details |

|
#13
N Hicks St
Philadelphia, PA 19132
|
970 sq. feet
|
1 baths 3 beds |
$62,900
|
show details |

|
#14
Mark Pl
Philadelphia, PA 19115
|
2,185 sq. feet
|
2 baths 4 beds |
$609,000
|
show details |

|
#15
Osbourne Ave
Willow Grove, PA 19090
|
1,603 sq. feet
|
2 baths 4 beds |
$457,500
|
show details |

|
#16
N Front St Apt B
Philadelphia, PA 19123
|
2,491 sq. feet
|
2 baths 3 beds |
$599,900
|
show details |

|
#17
Ashbourne Rd
Elkins Park, PA 19027
|
3,104 sq. feet
|
3 baths 6 beds |
$144,500
|
show details |

|
#18
Harvey Ave
Pennsauken, NJ 08110
|
1,555 sq. feet
|
2 baths 4 beds |
$405,000
|
show details |

|
#19
Harmon Rd
Philadelphia, PA 19128
|
1,200 sq. feet
|
1 baths 3 beds |
$409,500
|
show details |

|
#20
N 59th St
Philadelphia, PA 19151
|
1,244 sq. feet
|
1 baths 3 beds |
$231,500
|
show details |
| Photo | Address | Area | Beds / Baths | Price | Details |
|---|---|---|---|---|---|

|
#21
Pershing Ave
Darby, PA 19023
|
1,179 sq. feet
|
1 baths 3 beds |
$309,900
|
show details |

|
#22
W Cumberland St
Philadelphia, PA 19132
|
1,356 sq. feet
|
1 baths 3 beds |
$17,109
|
show details |

|
#23
N Reese St
Philadelphia, PA 19140
|
1,350 sq. feet
|
1 baths 3 beds |
$53,075
|
show details |

|
#24
Gulph Rd
Wayne, PA 19087
|
3,262 sq. feet
|
2 baths 4 beds |
$651,481
|
show details |

|
#25
Cedarbrook Ave
Philadelphia, PA 19150
|
1,128 sq. feet
|
1 baths 3 beds |
$40,954
|
show details |

|
#26
Hopkinson Ct # 160
Wayne, PA 19087
|
1,656 sq. feet
|
2 baths 2 beds |
$214,896
|
show details |

|
#27
King Of Prussia Rd
Wayne, PA 19087
|
1,509 sq. feet
|
1 baths 3 beds |
$334,200
|
show details |

|
#28
S 57th St
Philadelphia, PA 19143
|
1,158 sq. feet
|
1 baths 3 beds |
$228,800
|
show details |

|
#29
Dillman St
Philadelphia, PA 19140
|
728 sq. feet
|
1 baths 2 beds |
$1
|
show details |

|
#30
Spruce St
Philadelphia, PA 19139
|
1,420 sq. feet
|
1 baths 3 beds |
$3,100
|
show details |
| Photo | Address | Area | Beds / Baths | Price | Details |
|---|---|---|---|---|---|

|
#31
Cottage St
Philadelphia, PA 19135
|
1,170 sq. feet
|
1 baths 3 beds |
$165,319
|
show details |

|
#32
Delancey St
Philadelphia, PA 19143
|
948 sq. feet
|
1 baths 3 beds |
$1
|
show details |

|
#33
S 56th St
Philadelphia, PA 19143
|
1,278 sq. feet
|
1 baths 3 beds |
$3,100
|
show details |

|
#34
E Lippincott St
Philadelphia, PA 19134
|
1,064 sq. feet
|
1 baths 3 beds |
$1
|
show details |

|
#35
W Lehigh Ave
Philadelphia, PA 19132
|
1,566 sq. feet
|
1 baths 3 beds |
$3,100
|
show details |

|
#36
E Wishart St
Philadelphia, PA 19134
|
1,064 sq. feet
|
1 baths 3 beds |
$1,290,613
|
show details |

|
#37
W Wishart St
Philadelphia, PA 19133
|
1,036 sq. feet
|
1 baths 3 beds |
$1
|
show details |

|
#38
Buist Ave
Philadelphia, PA 19153
|
1,360 sq. feet
|
1 baths 3 beds |
$228,818
|
show details |

|
#39
Greenwich St
Philadelphia, PA 19147
|
884 sq. feet
|
1 baths 3 beds |
$1
|
show details |

|
#40
E Courtland St
Philadelphia, PA 19120
|
800 sq. feet
|
1 baths 3 beds |
$76,008
|
show details |
| Photo | Address | Area | Beds / Baths | Price | Details |
|---|---|---|---|---|---|

|
#41
Saint Vincent St
Philadelphia, PA 19149
|
1,480 sq. feet
|
1 baths 3 beds |
$1
|
show details |

|
#42
N 9th St
Philadelphia, PA 19140
|
1,024 sq. feet
|
1 baths 3 beds |
$3,100
|
show details |

|
#43
N Bancroft St
Philadelphia, PA 19140
|
932 sq. feet
|
1 baths 3 beds |
$1
|
show details |

|
#44
S 56th St
Philadelphia, PA 19143
|
1,600 sq. feet
|
1 baths 4 beds |
$3,100
|
show details |

|
#45
Tasker St
Philadelphia, PA 19148
|
1,040 sq. feet
|
1 baths 3 beds |
$1
|
show details |

|
#46
Shady Brook Ln
Malvern, PA 19355
|
3,974 sq. feet
|
3 baths 4 beds |
$185,445
|
show details |

|
#47
N Peach St
Philadelphia, PA 19139
|
1,120 sq. feet
|
1 baths 3 beds |
$1
|
show details |

|
#48
N Newkirk St
Philadelphia, PA 19121
|
1,050 sq. feet
|
1 baths 3 beds |
$3,100
|
show details |

|
#49
Sigel St
Philadelphia, PA 19145
|
1,018 sq. feet
|
1 baths 3 beds |
$219,169
|
show details |

|
Check over 1 million property listings on Foreclosure.com!
|
browse all offers | |||


- 1,71863.6%Black alone
- 46017.0%White alone
- 36113.4%Two or more races
- 2087.7%Asian alone
- 421.6%Hispanic
- 70.3%Other race alone
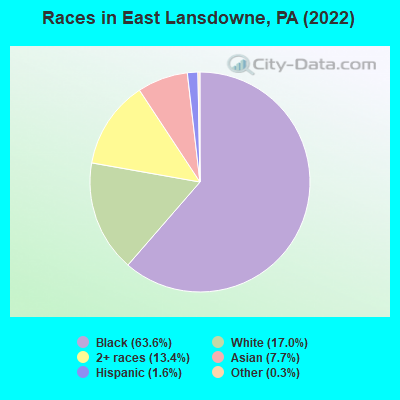
Races in East Lansdowne detailed stats: ancestries, foreign born residents, place of birth
According to our research of Pennsylvania and other state lists, there were 3 registered sex offenders living in East Lansdowne, Pennsylvania as of July 03, 2024.
The ratio of all residents to sex offenders in East Lansdowne is 889 to 1.
The ratio of registered sex offenders to all residents in this city is lower than the state average.
Type |
2009 |
2010 |
2011 |
2012 |
2013 |
2014 |
2015 |
2016 |
2017 |
2018 |
2019 |
2020 |
2022 |
|---|---|---|---|---|---|---|---|---|---|---|---|---|---|
| Murders (per 100,000) | 0 (0.0) | 0 (0.0) | 0 (0.0) | 0 (0.0) | 0 (0.0) | 0 (0.0) | 1 (37.5) | 0 (0.0) | 0 (0.0) | 0 (0.0) | 0 (0.0) | 0 (0.0) | 0 (0.0) |
| Rapes (per 100,000) | 1 (40.6) | 0 (0.0) | 0 (0.0) | 0 (0.0) | 1 (37.6) | 3 (112.6) | 2 (75.0) | 0 (0.0) | 0 (0.0) | 0 (0.0) | 0 (0.0) | 0 (0.0) | 0 (0.0) |
| Robberies (per 100,000) | 5 (203.2) | 11 (412.3) | 9 (336.2) | 12 (448.8) | 7 (263.1) | 13 (487.8) | 1 (37.5) | 6 (225.1) | 4 (150.7) | 2 (74.9) | 1 (37.6) | 5 (187.2) | 0 (0.0) |
| Assaults (per 100,000) | 10 (406.3) | 3 (112.4) | 18 (672.4) | 13 (486.2) | 21 (789.2) | 14 (525.3) | 8 (299.9) | 6 (225.1) | 14 (527.5) | 7 (262.2) | 17 (638.6) | 16 (599.0) | 0 (0.0) |
| Burglaries (per 100,000) | 24 (975.2) | 20 (749.6) | 13 (485.6) | 15 (561.0) | 20 (751.6) | 27 (1,013) | 23 (862.1) | 12 (450.3) | 10 (376.8) | 14 (524.3) | 6 (225.4) | 9 (337.0) | 3 (112.4) |
| Thefts (per 100,000) | 50 (2,032) | 47 (1,762) | 50 (1,868) | 61 (2,281) | 73 (2,743) | 69 (2,589) | 55 (2,061) | 72 (2,702) | 57 (2,148) | 56 (2,097) | 51 (1,916) | 39 (1,460) | 4 (149.8) |
| Auto thefts (per 100,000) | 7 (284.4) | 5 (187.4) | 4 (149.4) | 4 (149.6) | 3 (112.7) | 2 (75.0) | 3 (112.4) | 4 (150.1) | 1 (37.7) | 9 (337.1) | 7 (263.0) | 6 (224.6) | 0 (0.0) |
| Arson (per 100,000) | 0 (0.0) | 0 (0.0) | 0 (0.0) | 0 (0.0) | 0 (0.0) | 0 (0.0) | 0 (0.0) | 3 (112.6) | 4 (150.7) | 0 (0.0) | 0 (0.0) | 0 (0.0) | 0 (0.0) |
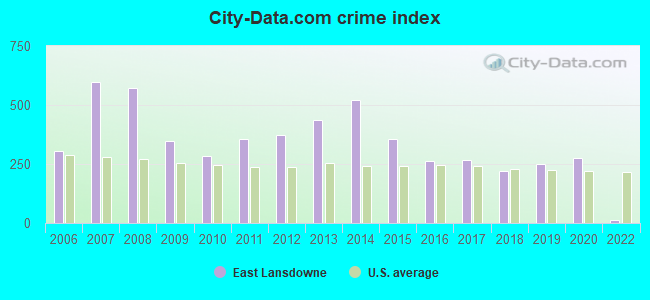
| City-Data.com crime index | 347.0 | 284.1 | 356.0 | 374.3 | 438.2 | 522.0 | 357.9 | 264.2 | 266.0 | 222.5 | 252.4 | 275.9 | 13.9 |
The City-Data.com crime index weighs serious crimes and violent crimes more heavily. Higher means more crime, U.S. average is 246.1. It adjusts for the number of visitors and daily workers commuting into cities.
Crime rate in East Lansdowne detailed stats: murders, rapes, robberies, assaults, burglaries, thefts, arson
Full-time law enforcement employees in 2021, including police officers: 5 (4 officers - 4 male; 0 female).
| Officers per 1,000 residents here: | 1.50 |
| Pennsylvania average: | 2.55 |
 Recent articles from our blog. Our writers, many of them Ph.D. graduates or candidates, create easy-to-read articles on a wide variety of topics.

 | Is Lansdowne ok for renting? no school aged kids yet (24 replies) |
| Is anyone thinking of leaving/moving out of the city? Why? (217 replies) |
| What can anybody tell me about the Lansdowne/Drexel Hill area? (3 replies) |
| Philadelphia vs Pittsburgh (1514 replies) |
| Terminal Square, Upper Darby Township... (24 replies) |
| Upper Darby (44 replies) |
Latest news from East Lansdowne, PA collected exclusively by city-data.com from local newspapers, TV, and radio stations
Ancestries: Jamaican (7.4%), Irish (5.7%), Somali (5.1%), Italian (4.0%), Haitian (2.7%), German Russian (2.3%).
Current Local Time: EST time zone
Incorporated on 05/27/1911
Elevation: 120 feet
Land area: 0.21 square miles.
Population density: 13,002 people per square mile (very high).
570 residents are foreign born (7.8% Africa, 6.6% Latin America, 5.8% Asia).
| This borough: | 21.1% |
| Pennsylvania: | 7.3% |
Median real estate property taxes paid for housing units with mortgages in 2022: $4,968 (2.4%)
Median real estate property taxes paid for housing units with no mortgage in 2022: $3,872 (2.3%)
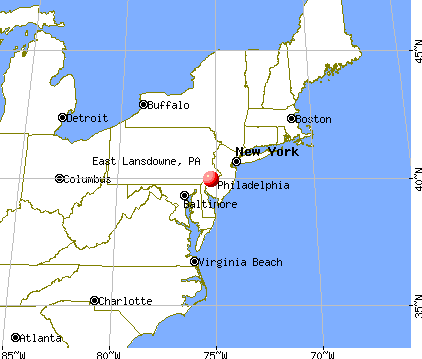
Nearest city with pop. 50,000+: Philadelphia, PA  (7.2 miles , pop. 1,517,550).
Nearest cities:
), ), ), Latitude: 39.94 N, Longitude: 75.26 W
| Here: | 2.7% |
| Pennsylvania: | 2.9% |
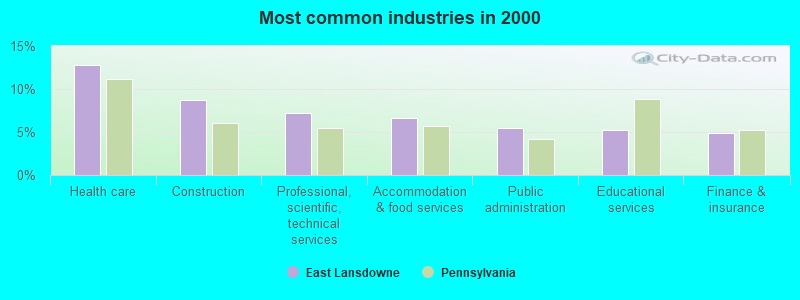
- Health care (12.8%)
- Construction (8.8%)
- Professional, scientific, technical services (7.2%)
- Accommodation & food services (6.6%)
- Public administration (5.5%)
- Educational services (5.2%)
- Finance & insurance (4.9%)
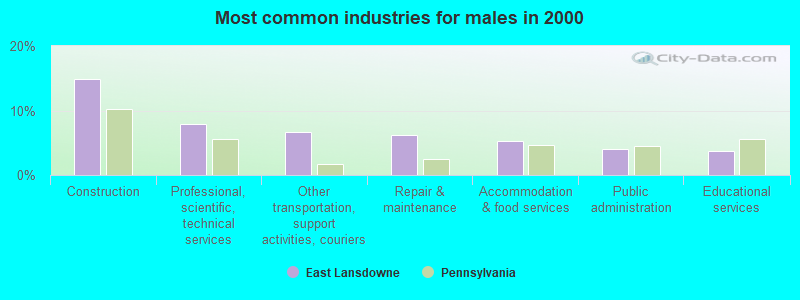
- Construction (14.9%)
- Professional, scientific, technical services (7.9%)
- Other transportation, support activities, couriers (6.6%)
- Repair & maintenance (6.2%)
- Accommodation & food services (5.3%)
- Public administration (4.0%)
- Educational services (3.8%)
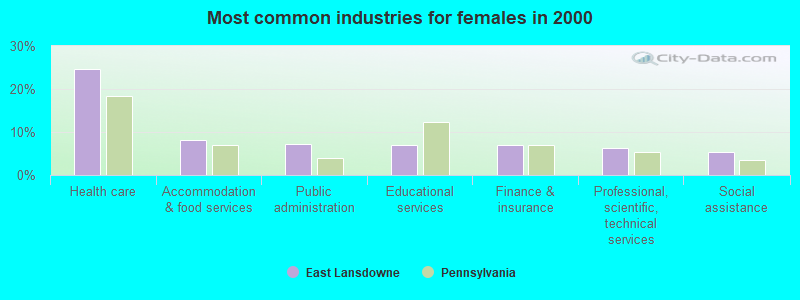
- Health care (24.7%)
- Accommodation & food services (8.2%)
- Public administration (7.3%)
- Educational services (7.1%)
- Finance & insurance (6.9%)
- Professional, scientific, technical services (6.2%)
- Social assistance (5.4%)
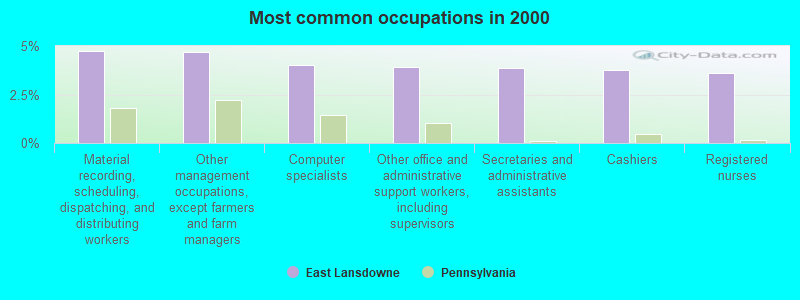
- Material recording, scheduling, dispatching, and distributing workers (4.7%)
- Other management occupations, except farmers and farm managers (4.7%)
- Computer specialists (4.0%)
- Other office and administrative support workers, including supervisors (3.9%)
- Secretaries and administrative assistants (3.9%)
- Cashiers (3.8%)
- Registered nurses (3.6%)
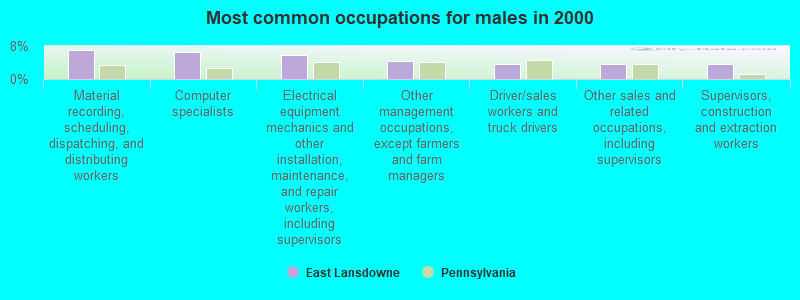
- Material recording, scheduling, dispatching, and distributing workers (7.1%)
- Computer specialists (6.6%)
- Electrical equipment mechanics and other installation, maintenance, and repair workers, including supervisors (5.8%)
- Other management occupations, except farmers and farm managers (4.5%)
- Driver/sales workers and truck drivers (3.8%)
- Other sales and related occupations, including supervisors (3.6%)
- Supervisors, construction and extraction workers (3.6%)

- Secretaries and administrative assistants (8.7%)
- Registered nurses (8.2%)
- Information and record clerks, except customer service representatives (8.2%)
- Other office and administrative support workers, including supervisors (6.4%)
- Cashiers (5.3%)
- Other management occupations, except farmers and farm managers (4.9%)
- Preschool, kindergarten, elementary, and middle school teachers (4.2%)
Average climate in East Lansdowne, Pennsylvania
Based on data reported by over 4,000 weather stations


(lower is better)
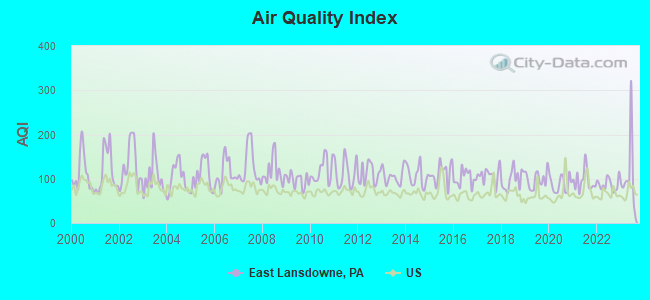
Air Quality Index (AQI) level in 2023 was 109. This is significantly worse than average.
| City: | 109 |
| U.S.: | 73 |
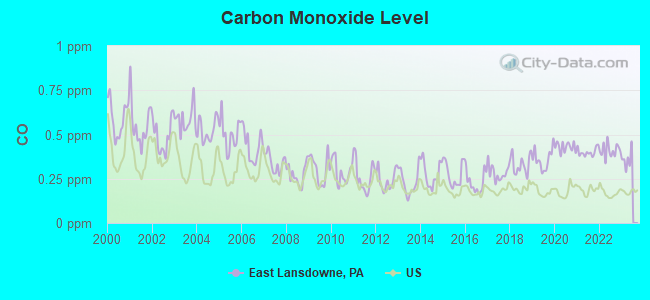
Carbon Monoxide (CO) [ppm] level in 2022 was 0.409. This is significantly worse than average. Closest monitor was 4.2 miles away from the city center.
| City: | 0.409 |
| U.S.: | 0.251 |
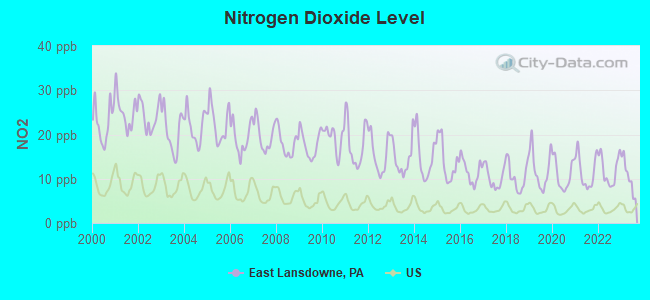
Nitrogen Dioxide (NO2) [ppb] level in 2023 was 10.6. This is significantly worse than average. Closest monitor was 4.2 miles away from the city center.
| City: | 10.6 |
| U.S.: | 5.1 |
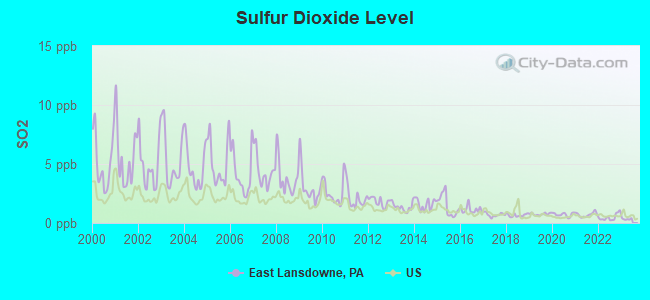
Sulfur Dioxide (SO2) [ppb] level in 2022 was 0.484. This is significantly better than average. Closest monitor was 2.3 miles away from the city center.
| City: | 0.484 |
| U.S.: | 1.515 |
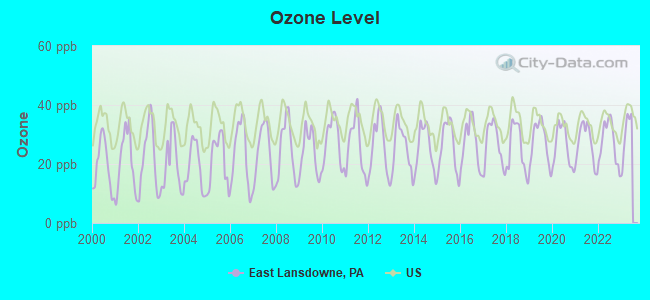
Ozone [ppb] level in 2022 was 27.4. This is better than average. Closest monitor was 2.3 miles away from the city center.
| City: | 27.4 |
| U.S.: | 33.3 |
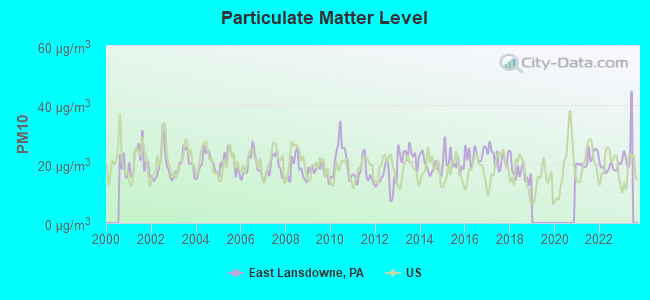
Particulate Matter (PM10) [µg/m3] level in 2022 was 18.9. This is about average. Closest monitor was 5.0 miles away from the city center.
| City: | 18.9 |
| U.S.: | 19.2 |
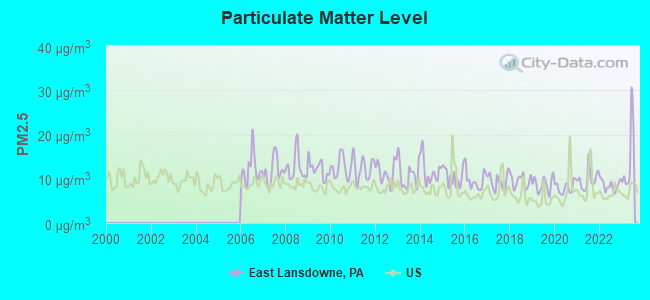
Particulate Matter (PM2.5) [µg/m3] level in 2023 was 14.4. This is significantly worse than average. Closest monitor was 2.3 miles away from the city center.
| City: | 14.4 |
| U.S.: | 8.1 |
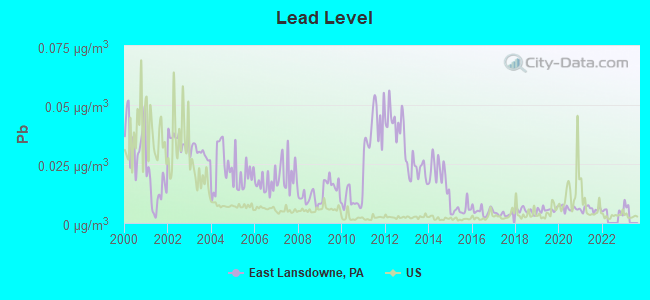
Lead (Pb) [µg/m3] level in 2021 was 0.00591. This is significantly better than average. Closest monitor was 2.0 miles away from the city center.
| City: | 0.00591 |
| U.S.: | 0.00931 |
Tornado activity:
East Lansdowne-area historical tornado activity is slightly above Pennsylvania state average. It is 1% greater than the overall U.S. average.
On 3/22/1955, a category F3 (max. wind speeds 158-206 mph) tornado 13.3 miles away from the East Lansdowne borough center killed one person and caused between $50,000 and $500,000 in damages.
On 7/27/1994, a category F3 tornado 24.1 miles away from the borough center killed 3 people and injured 25 people and caused between $5,000,000 and $50,000,000 in damages.
Earthquake activity:
East Lansdowne-area historical earthquake activity is significantly above Pennsylvania state average. It is 65% smaller than the overall U.S. average.On 8/23/2011 at 17:51:04, a magnitude 5.8 (5.8 MW, Depth: 3.7 mi, Class: Moderate, Intensity: VI - VII) earthquake occurred 201.3 miles away from the city center
On 1/16/1994 at 01:49:16, a magnitude 4.6 (4.6 MB, 4.6 LG, Depth: 3.1 mi, Class: Light, Intensity: IV - V) earthquake occurred 49.0 miles away from the city center
On 1/16/1994 at 00:42:43, a magnitude 4.2 (4.2 MB, 4.0 LG, Depth: 3.1 mi) earthquake occurred 47.5 miles away from East Lansdowne center
On 10/7/1983 at 10:18:46, a magnitude 5.3 (5.1 MB, 5.3 LG, 5.1 ML) earthquake occurred 281.3 miles away from East Lansdowne center
On 11/30/2017 at 21:47:31, a magnitude 4.1 (4.1 MW, Depth: 6.1 mi) earthquake occurred 52.4 miles away from East Lansdowne center
On 9/25/1998 at 19:52:52, a magnitude 5.2 (4.8 MB, 4.3 MS, 5.2 LG, 4.5 MW, Depth: 3.1 mi) earthquake occurred 289.7 miles away from the city center
Magnitude types: regional Lg-wave magnitude (LG), body-wave magnitude (MB), local magnitude (ML), surface-wave magnitude (MS), moment magnitude (MW)
Natural disasters:
The number of natural disasters in Delaware County (21) is greater than the US average (15).Major Disasters (Presidential) Declared: 15
Emergencies Declared: 6
Causes of natural disasters: Hurricanes: 5, Floods: 4, Winter Storms: 4, Storms: 3, Tropical Storms: 3, Snowstorms: 2, Blizzard: 1, Snowfall: 1, Tropical Depression: 1, Water Shortage: 1, Other: 1 (Note: some incidents may be assigned to more than one category).

Hospitals and medical centers near East Lansdowne:
- JORPAT NURSING SERVICES INC (Home Health Center, about 1 miles away; LANSDOWNE, PA)
- MANORCARE HEALTH SERVICES-MERCY FI (Nursing Home, about 2 miles away; YEADON, PA)
- LEADER NSG REHAB CTR/YEADON (Nursing Home, about 2 miles away; YEADON, PA)
- MANORCARE HEALTH SERVICES-YEADON (Nursing Home, about 2 miles away; YEADON, PA)
- CARE PAVILION NURSING AND REHABILITATION CENTER (Nursing Home, about 2 miles away; PHILADELPHIA, PA)
- MERCY HEALTH HOSPICE PROGRAM (Hospital, about 2 miles away; DARBY, PA)
- MERCY FITZGERALD HOSPITAL SNF (Nursing Home, about 2 miles away; DARBY, PA)
Amtrak stations near East Lansdowne:
- 5 miles: PHILADELPHIA (30TH & MARKET STS.) . Services: ticket office, fully wheelchair accessible, enclosed waiting area, public restrooms, public payphones, snack bar, ATM, paid short-term parking, paid long-term parking, car rental agency, taxi stand, public transit connection.
- 5 miles: ARDMORE (STATION RD. & LANCASTER AVE.) . Services: enclosed waiting area, public restrooms, public payphones, paid short-term parking, call for car rental service, call for taxi service, public transit connection.
- 7 miles: NORTH PHILADELPHIA (PHILADELPHIA, 2900 N. BROAD ST.) . Services: ticket office, fully wheelchair accessible, enclosed waiting area, public restrooms, public payphones, paid short-term parking, paid long-term parking, call for taxi service, public transit connection.
Colleges/universities with over 2000 students nearest to East Lansdowne:
- University of the Sciences (about 3 miles; Philadelphia, PA; Full-time enrollment: 2,464)
- University of Pennsylvania (about 4 miles; Philadelphia, PA; FT enrollment: 25,693)
- Saint Joseph's University (about 4 miles; Philadelphia, PA; FT enrollment: 7,329)
- Drexel University (about 4 miles; Philadelphia, PA; FT enrollment: 22,969)
- The Art Institute of Philadelphia (about 5 miles; Philadelphia, PA; FT enrollment: 2,432)
- The University of the Arts (about 6 miles; Philadelphia, PA; FT enrollment: 2,198)
- Community College of Philadelphia (about 6 miles; Philadelphia, PA; FT enrollment: 15,116)
Public elementary/middle school in East Lansdowne:
- EAST LANSDOWNE EL SCH (Students: 338, Location: 401 EMERSON AVE, Grades: KG-6)
Private elementary/middle school in East Lansdowne:
Points of interest:
Notable locations in East Lansdowne: Pattonville (A), East Lansdowne Borough Hall (B), East Lansdowne Fire Company Station 24 (C), East Lansdowne Library (D), East Lansdowne Police Station (E). Display/hide their locations on the map
| This borough: | 2.9 people |
| Pennsylvania: | 2.5 people |
| This borough: | 68.9% |
| Whole state: | 65.0% |
| This borough: | 8.0% |
| Whole state: | 6.6% |
Likely homosexual households (counted as self-reported same-sex unmarried-partner households)
- Lesbian couples: 0.2% of all households
- Gay men: 0.3% of all households
28 people in other noninstitutional group quarters in 2000
18 people in religious group quarters in 2000
For population 15 years and over in East Lansdowne:
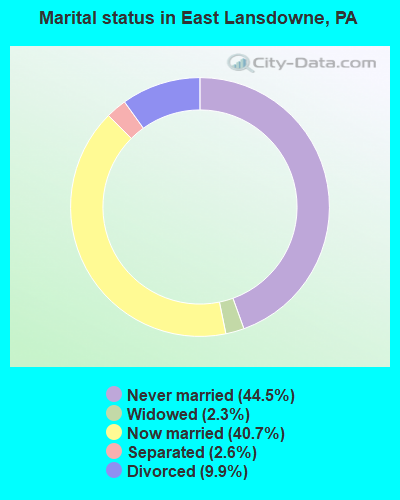
- Never married: 44.5%
- Now married: 40.7%
- Separated: 2.6%
- Widowed: 2.3%
- Divorced: 9.9%
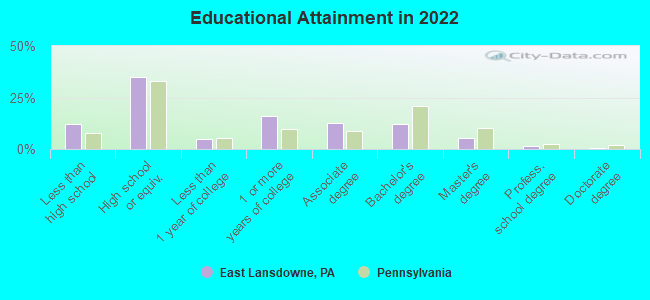
For population 25 years and over in East Lansdowne:
- High school or higher: 89.8%
- Bachelor's degree or higher: 19.2%
- Graduate or professional degree: 7.1%
- Unemployed: 5.8%
- Mean travel time to work (commute): 26.6 minutes
| Here: | 14.9 |
| Pennsylvania average: | 11.4 |
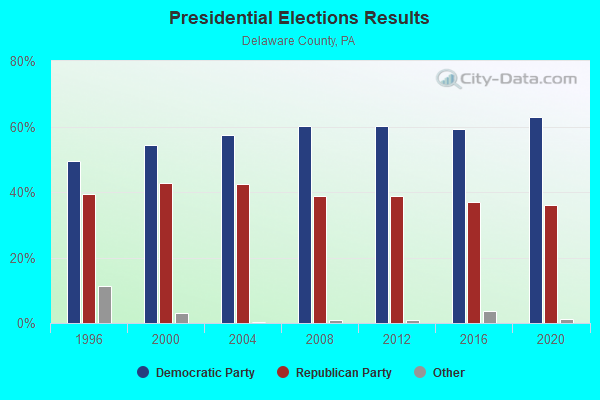
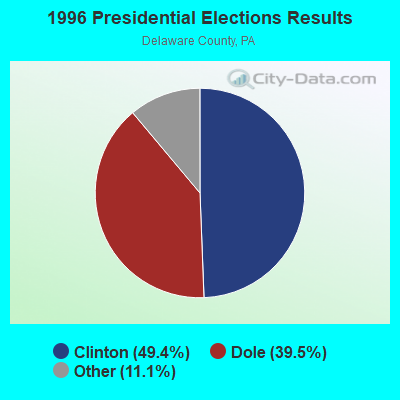
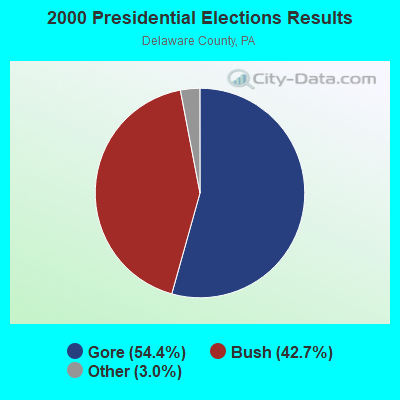
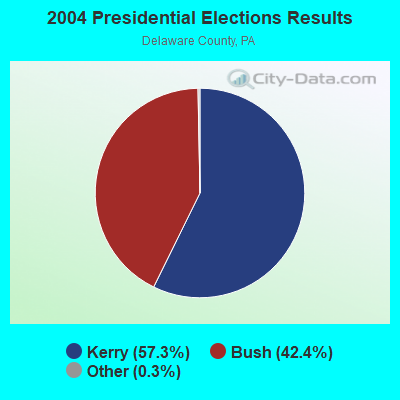
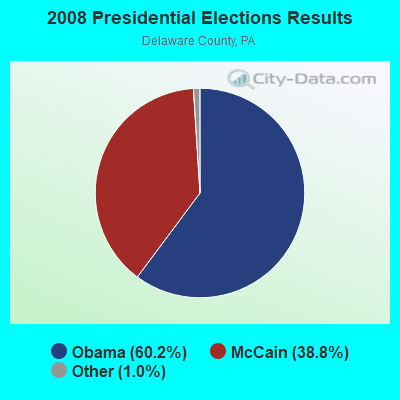
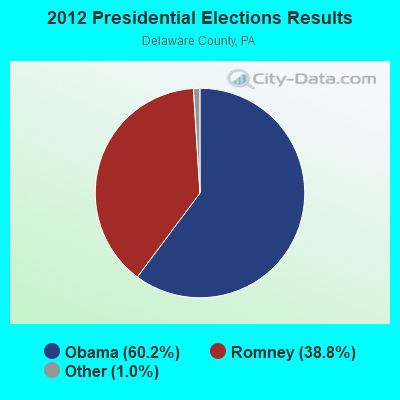
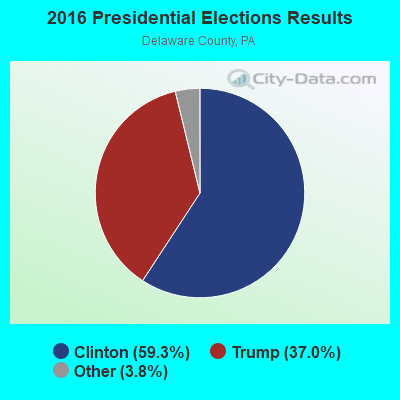
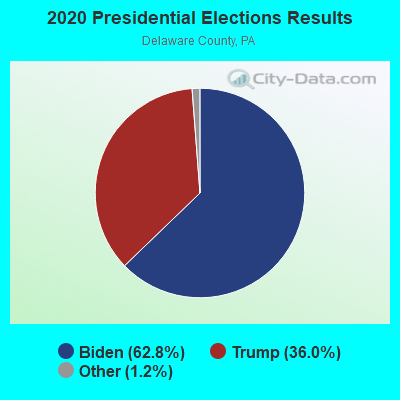
Graphs represent county-level data. Detailed 2008 Election Results
Political contributions by individuals in East Lansdowne, PA
Religion statistics for East Lansdowne, PA (based on Delaware County data)
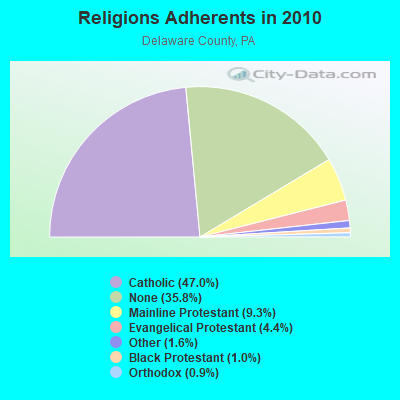
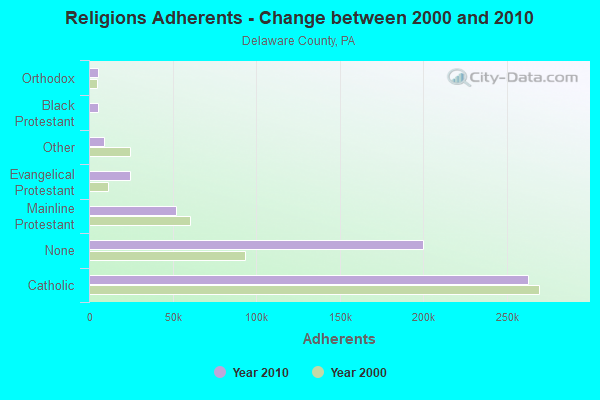
| Religion | Adherents | Congregations |
|---|---|---|
| Catholic | 262,506 | 50 |
| Mainline Protestant | 52,224 | 169 |
| Evangelical Protestant | 24,456 | 136 |
| Other | 9,009 | 27 |
| Black Protestant | 5,617 | 39 |
| Orthodox | 5,096 | 8 |
| None | 200,071 | - |
Food Environment Statistics:
| This county: | 1.86 / 10,000 pop. |
| Pennsylvania: | 2.04 / 10,000 pop. |
| Delaware County: | 0.02 / 10,000 pop. |
| State: | 0.09 / 10,000 pop. |
| This county: | 1.50 / 10,000 pop. |
| Pennsylvania: | 0.88 / 10,000 pop. |
| Delaware County: | 1.14 / 10,000 pop. |
| Pennsylvania: | 2.52 / 10,000 pop. |
| Here: | 5.66 / 10,000 pop. |
| Pennsylvania: | 7.12 / 10,000 pop. |
| Here: | 8.5% |
| Pennsylvania: | 9.1% |
| Here: | 25.7% |
| Pennsylvania: | 27.2% |
| This county: | 11.1% |
| Pennsylvania: | 11.5% |
Health and Nutrition:
| This city: | 49.9% |
| State: | 50.2% |
| East Lansdowne: | 47.0% |
| Pennsylvania: | 47.1% |
| Here: | 29.1 |
| State: | 28.7 |
| This city: | 19.4% |
| Pennsylvania: | 20.8% |
| This city: | 12.7% |
| Pennsylvania: | 10.9% |
| East Lansdowne: | 6.8 |
| Pennsylvania: | 6.8 |
| East Lansdowne: | 34.5% |
| Pennsylvania: | 34.3% |
| This city: | 56.6% |
| Pennsylvania: | 56.2% |
| East Lansdowne: | 79.5% |
| Pennsylvania: | 78.3% |
More about Health and Nutrition of East Lansdowne, PA Residents
| Local government employment and payroll (March 2022) | |||||
| Function | Full-time employees | Monthly full-time payroll | Average yearly full-time wage | Part-time employees | Monthly part-time payroll |
|---|---|---|---|---|---|
| Police Protection - Officers | 7 | $46,648 | $79,968 | 4 | $3,432 |
| Other Government Administration | 5 | $14,309 | $34,342 | 0 | $0 |
| Solid Waste Management | 2 | $6,532 | $39,192 | 0 | $0 |
| Other and Unallocable | 1 | $4,043 | $48,516 | 0 | $0 |
| Police - Other | 0 | $0 | 2 | $2,817 | |
| Totals for Government | 15 | $71,533 | $57,226 | 6 | $6,249 |
East Lansdowne government finances - Expenditure in 2017 (per resident):
- Construction - General Public Buildings: $42,000 ($15.64)
- Current Operations - Police Protection: $685,000 ($255.03)
Sewerage: $232,000 ($86.37)
Solid Waste Management: $180,000 ($67.01)
General - Other: $148,000 ($55.10)
Central Staff Services: $95,000 ($35.37)
Regular Highways: $61,000 ($22.71)
Housing and Community Development: $58,000 ($21.59)
Financial Administration: $57,000 ($21.22)
Local Fire Protection: $56,000 ($20.85)
General Public Buildings: $44,000 ($16.38)
Protective Inspection and Regulation - Other: $33,000 ($12.29)
Judicial and Legal Services: $9,000 ($3.35)
Libraries: $8,000 ($2.98)
Health - Other: $1,000 ($0.37)
- General - Interest on Debt: $3,000 ($1.12)
- Other Capital Outlay - Central Staff Services: $1,000 ($0.37)
- Total Salaries and Wages: $479,000 ($178.33)
East Lansdowne government finances - Revenue in 2017 (per resident):
- Charges - Sewerage: $324,000 ($120.63)
Solid Waste Management: $147,000 ($54.73)
Other: $66,000 ($24.57)
Parking Facilities: $23,000 ($8.56)
- Local Intergovernmental - Other: $5,000 ($1.86)
- Miscellaneous - Fines and Forfeits: $52,000 ($19.36)
General Revenue - Other: $37,000 ($13.78)
Rents: $25,000 ($9.31)
Interest Earnings: $24,000 ($8.94)
- State Intergovernmental - Other: $62,000 ($23.08)
Highways: $47,000 ($17.50)
General Local Government Support: $2,000 ($0.74)
- Tax - Property: $823,000 ($306.40)
Individual Income: $70,000 ($26.06)
Public Utility License: $44,000 ($16.38)
Occupation and Business License - Other: $22,000 ($8.19)
Documentary and Stock Transfer: $21,000 ($7.82)
Other License: $11,000 ($4.10)
East Lansdowne government finances - Debt in 2017 (per resident):
- Long Term Debt - Beginning Outstanding - Unspecified Public Purpose: $54,000 ($20.10)
Retired Unspecified Public Purpose: $33,000 ($12.29)
Outstanding Unspecified Public Purpose: $21,000 ($7.82)
East Lansdowne government finances - Cash and Securities in 2017 (per resident):
- Other Funds - Cash and Securities: $988,000 ($367.83)
5.79% of this county's 2021 resident taxpayers lived in other counties in 2020 ($87,801 average adjusted gross income)
| Here: | 5.79% |
| Pennsylvania average: | 5.27% |
0.01% of residents moved from foreign countries ($122 average AGI)
Delaware County: 0.01% Pennsylvania average: 0.01%
Top counties from which taxpayers relocated into this county between 2020 and 2021:
| from Philadelphia County, PA | |
| from Montgomery County, PA | |
| from Chester County, PA |
6.34% of this county's 2020 resident taxpayers moved to other counties in 2021 ($87,816 average adjusted gross income)
| Here: | 6.34% |
| Pennsylvania average: | 5.44% |
0.01% of residents moved to foreign countries ($90 average AGI)
Delaware County: 0.01% Pennsylvania average: 0.01%
Top counties to which taxpayers relocated from this county between 2020 and 2021:
| to Philadelphia County, PA | |
| to Chester County, PA | |
| to Montgomery County, PA |
Businesses in East Lansdowne, PA
- U-Haul: 1
Strongest AM radio stations in East Lansdowne:
- WPEN (950 AM; 50 kW; PHILADELPHIA, PA; Owner: GREATER PHILADELPHIA RADIO, INC.)
- WVCH (740 AM; 50 kW; CHESTER, PA; Owner: WVCH COMMUNICATIONS, INC.)
- WNWR (1540 AM; 50 kW; PHILADELPHIA, PA)
- WZZD (990 AM; 50 kW; PHILADELPHIA, PA; Owner: PENNSYLVANIA MEDIA ASSOCIATES, INC.)
- KYW (1060 AM; 50 kW; PHILADELPHIA, PA; Owner: INFINITY BROADCASTING OPERATIONS, INC.)
- WPHT (1210 AM; 50 kW; PHILADELPHIA, PA; Owner: INFINITY BROADCASTING OPERATIONS, INC.)
- WDAS (1480 AM; 5 kW; PHILADELPHIA, PA; Owner: AMFM RADIO LICENSES, L.L.C.)
- WURD (900 AM; 1 kW; PHILADELPHIA, PA; Owner: LEVAS COMMUNICATIONS, LLC)
- WIP (610 AM; 5 kW; PHILADELPHIA, PA; Owner: INFINITY BROADCASTING CORPORATION OF PHILADELPHIA)
- WTMR (800 AM; 5 kW; CAMDEN, NJ; Owner: WTMR LICENSE LIMITED PARTNERSHIP)
- WWJZ (640 AM; 50 kW; MOUNT HOLLY, NJ; Owner: ABC, INC.)
- WFIL (560 AM; 5 kW; PHILADELPHIA, PA; Owner: PENNSYLVANIA MEDIA ASSOCIATES, INC.)
- WWDB (860 AM; daytime; 10 kW; PHILADELPHIA, PA)
Strongest FM radio stations in East Lansdowne:
- WMMR (93.3 FM; PHILADELPHIA, PA; Owner: GREATER BOSTON RADIO, INC.)
- WMGK (102.9 FM; PHILADELPHIA, PA; Owner: GREATER PHILADELPHIA RADIO, INC.)
- WMWX (95.7 FM; PHILADELPHIA, PA; Owner: GREATER PHILADELPHIA RADIO, INC.)
- WOGL (98.1 FM; PHILADELPHIA, PA; Owner: INFINITY BROADCASTING OPERATIONS, INC.)
- WBEB (101.1 FM; PHILADELPHIA, PA; Owner: WEAZ-FM RADIO, INC.)
- WRTI (90.1 FM; PHILADELPHIA, PA; Owner: TEMPLE UNIV. OF THE COMMONWEALTH, ET)
- WPHI-FM (103.9 FM; JENKINTOWN, PA; Owner: RADIO ONE LICENSES, LLC)
- WSNI-FM (104.5 FM; PHILADELPHIA, PA; Owner: AMFM RADIO LICENSES, L.L.C.)
- WXTU (92.5 FM; PHILADELPHIA, PA; Owner: WXTU LICENSE LIMITED PARTNERSHIP)
- WHYY-FM (90.9 FM; PHILADELPHIA, PA; Owner: WHYY, INC.)
- WXPN (88.5 FM; PHILADELPHIA, PA; Owner: TRUSTEES OF THE UNIVERSITY OF PENNA.)
- WPTP (96.5 FM; PHILADELPHIA, PA; Owner: WDAS LICENSE LIMITED PARTNERSHIP)
- WDAS-FM (105.3 FM; PHILADELPHIA, PA; Owner: AMFM RADIO LICENSES, L.L.C.)
- WUSL (98.9 FM; PHILADELPHIA, PA; Owner: AMFM RADIO LICENSES, L.L.C.)
- WPLY (100.3 FM; MEDIA, PA; Owner: RADIO ONE LICENSES, LLC)
- WYSP (94.1 FM; PHILADELPHIA, PA; Owner: INFINITY BROADCASTING OPERATIONS, INC.)
- WPEB (88.1 FM; PHILADELPHIA, PA; Owner: WEST PHILADELPHIA BROADCASTING FOUNDATION)
- WIOQ (102.1 FM; PHILADELPHIA, PA; Owner: AMFM RADIO LICENSES, L.L.C.)
- WJJZ (106.1 FM; PHILADELPHIA, PA; Owner: AMFM RADIO LICENSES, L.L.C.)
- WHHS (107.9 FM; HAVERTOWN, PA; Owner: SCHOOL DISTRICT OF HAVERFORD TOWNSHP)
TV broadcast stations around East Lansdowne:
- WWJT-LP (Channel 7; PHILADELPHIA, PA; Owner: PHILADELPHIA TELEVISION NETWORK, INC)
- KYW-TV (Channel 3; PHILADELPHIA, PA; Owner: CBS BROADCASTING INC.)
- WPSG (Channel 57; PHILADELPHIA, PA; Owner: VIACOM STATIONS GROUP OF PHILADELPHIA INC.)
- WPVI-TV (Channel 6; PHILADELPHIA, PA; Owner: ABC, INC.)
- WPHL-TV (Channel 17; PHILADELPHIA, PA; Owner: TRIBUNE TELEVISION COMPANY)
- WCAU (Channel 10; PHILADELPHIA, PA; Owner: NBC SUBSIDIARY (WCAU-TV), L.P.)
- WPPX (Channel 61; WILMINGTON, DE; Owner: PAXSON PHILADELPHIA LICENSE, INC.)
- WGTW (Channel 48; BURLINGTON, NJ; Owner: BRUNSON COMMUNICATIONS, INC.)
- WYBE (Channel 35; PHILADELPHIA, PA; Owner: INDEPENDENCE PUBLIC MEDIA OF PHILADELPHIA, INC.)
- WHYY-TV (Channel 12; WILMINGTON, DE; Owner: WHYY, INC.)
- WTXF-TV (Channel 29; PHILADELPHIA, PA; Owner: FOX TV STATIONS OF PHILADELPHIA)
- WFPA-CA (Channel 28; PHILADELPHIA, PA; Owner: WXTV LICENSE PARTNERSHIP, G.P.)
- WELL-LP (Channel 8; WILLOW GROVE, ETC., PA; Owner: WORD OF GOD FELLOWSHIP, INC.)
- WPHA-LP (Channel 63; PHILADELPHIA, PA; Owner: COMMERCIAL BROADCASTING CORP.)
- WUVP (Channel 65; VINELAND, NJ; Owner: UNIVISION PHILADELPHIA LLC)
- WMCN-TV (Channel 53; ATLANTIC CITY, NJ; Owner: LENFEST BROADCASTING, LLC)
- WNJS (Channel 23; CAMDEN, NJ; Owner: NEW JERSEY PUBLIC BROADCASTING AUTHORITY)
- W33BT (Channel 33; CAMDEN, NJ; Owner: MEDIACASTING LLC)
- WPSJ-LP (Channel 8; HAMMONTON, ETC., NJ; Owner: ENGLE BROADCASTING)
- WTSD-CA (Channel 14; WILMINGTON, DE; Owner: PRIORITY COMMUNICATIONS MINISTRIES, INC.)
- W40AZ (Channel 40; WILMINGTON, DE; Owner: NATIONAL MINORITY T.V., INC.)
- W55BT (Channel 55; TALLEYVILLE, DE; Owner: MEDIACASTING LLC)
- WNJT (Channel 52; TRENTON, NJ; Owner: NEW JERSEY PUBLIC BROADCASTING AUTHORITY)
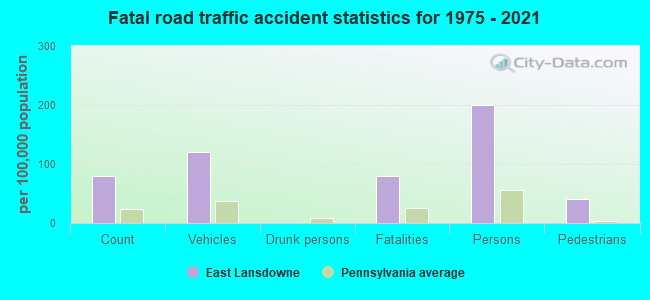
East Lansdowne fatal accident list:
May 24, 2005 11:35 AM, Us-13, Sr-2001, Lat: 39.941110, Lon: -75.256100, Vehicles: 2, Persons: 3, Fatalities: 1
- National Bridge Inventory (NBI) Statistics
- 1Number of bridges
- 3ft / 0.7mTotal length
- 23,117Total average daily traffic
- 924Total average daily truck traffic
- 24,899Total future (year 2032) average daily traffic
FCC Registered Amateur Radio Licenses:
5- Call Sign: KA3ZRT, Licensee ID: L00450417, Grant Date: 01/15/2002, Expiration Date: 01/21/2012, Cancellation Date: 01/22/2014, Registrant: William J Leitch, 1015 Pembroke Ave, East Lansdowne, PA 19050
- Call Sign: KB3CKU, Grant Date: 04/15/1998, Expiration Date: 04/15/2008, Cancellation Date: 04/16/2010, Registrant: Eric Harris, 109 Penn Blvd, East Lansdowne, PA 19050
- Call Sign: N3VUK, Licensee ID: L01020315, Grant Date: 05/24/2005, Expiration Date: 07/11/2015, Cancellation Date: 07/12/2017, Certifier: Pernette G Mills, Registrant: Pernette G Mills, 515 East Baltimore Pike, East Lansdowne, PA 19050
- Call Sign: KB3OBF, Licensee ID: L01199935, Grant Date: 10/06/2006, Expiration Date: 10/06/2016, Cancellation Date: 10/10/2018, Certifier: Chimaobi O Onyeachu, Registrant: Chimaobi O Onyeachu, 47 Lexington Ave, East Lansdowne, PA 19050
- Call Sign: KC3ETY, Licensee ID: L01936048, Grant Date: 04/13/2015, Expiration Date: 04/13/2025, Certifier: Matthew Prescott, Registrant: Matthew Prescott, 127 Penn Boulevard, East Lansdowne, PA 19050
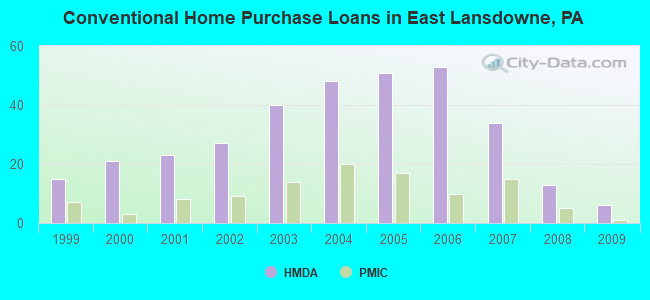
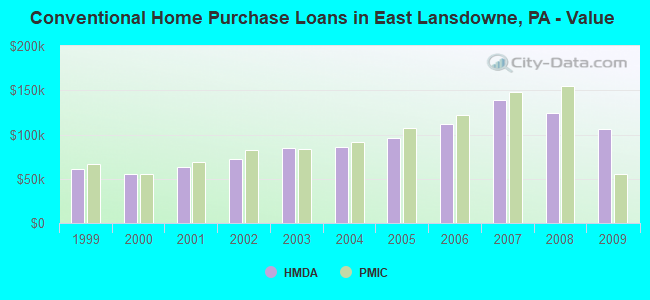
| Home Mortgage Disclosure Act Aggregated Statistics For Year 2009 (Based on 1 full tract) | ||||||||||
| A) FHA, FSA/RHS & VA Home Purchase Loans | B) Conventional Home Purchase Loans | C) Refinancings | D) Home Improvement Loans | F) Non-occupant Loans on < 5 Family Dwellings (A B C & D) | ||||||
|---|---|---|---|---|---|---|---|---|---|---|
| Number | Average Value | Number | Average Value | Number | Average Value | Number | Average Value | Number | Average Value | |
| LOANS ORIGINATED | 21 | $129,476 | 6 | $106,000 | 28 | $120,000 | 5 | $91,200 | 2 | $134,500 |
| APPLICATIONS APPROVED, NOT ACCEPTED | 0 | $0 | 1 | $120,000 | 5 | $134,600 | 2 | $12,500 | 0 | $0 |
| APPLICATIONS DENIED | 1 | $123,000 | 5 | $95,600 | 28 | $134,143 | 10 | $18,600 | 1 | $50,000 |
| APPLICATIONS WITHDRAWN | 2 | $142,500 | 2 | $63,500 | 13 | $114,000 | 1 | $80,000 | 1 | $123,000 |
| FILES CLOSED FOR INCOMPLETENESS | 0 | $0 | 0 | $0 | 4 | $75,000 | 0 | $0 | 0 | $0 |
Detailed HMDA statistics for the following Tracts: 4017.00
| Private Mortgage Insurance Companies Aggregated Statistics For Year 2009 (Based on 1 full tract) | ||||
| A) Conventional Home Purchase Loans | B) Refinancings | |||
|---|---|---|---|---|
| Number | Average Value | Number | Average Value | |
| LOANS ORIGINATED | 1 | $55,000 | 1 | $108,000 |
| APPLICATIONS APPROVED, NOT ACCEPTED | 0 | $0 | 0 | $0 |
| APPLICATIONS DENIED | 0 | $0 | 1 | $108,000 |
| APPLICATIONS WITHDRAWN | 0 | $0 | 0 | $0 |
| FILES CLOSED FOR INCOMPLETENESS | 0 | $0 | 0 | $0 |
Detailed PMIC statistics for the following Tracts: 4017.00
2006 - 2018 National Fire Incident Reporting System (NFIRS) incidents
- Fire incident types reported to NFIRS in East Lansdowne, PA
- 8174.3%Structure Fires
- 2119.3%Other
- 43.7%Outside Fires
- 32.8%Mobile Property/Vehicle Fires
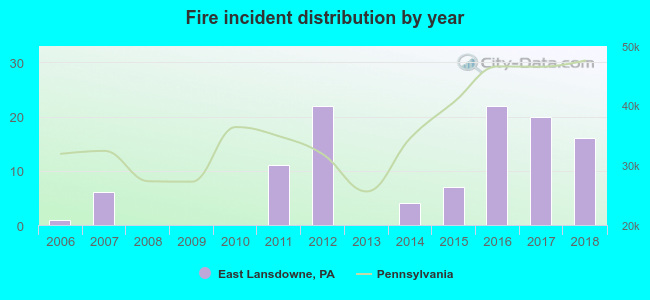 According to the data from the years 2006 - 2018 the average number of fires per year is 8. The highest number of fires - 22 took place in 2012, and the least - 0 in 2008. The data has an increasing trend.
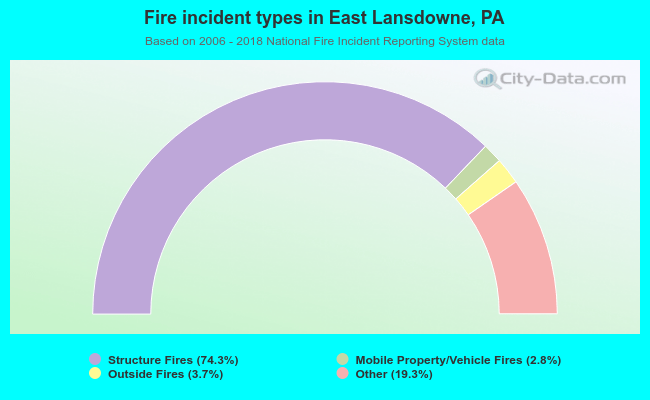 When looking into fire subcategories, the most reports belonged to: Structure Fires (74.3%), and Other (19.3%).
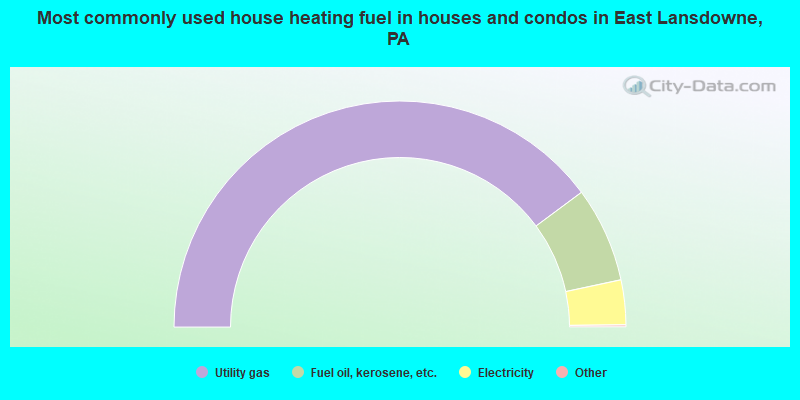
- 80.0%Utility gas
- 13.7%Fuel oil, kerosene, etc.
- 6.4%Electricity
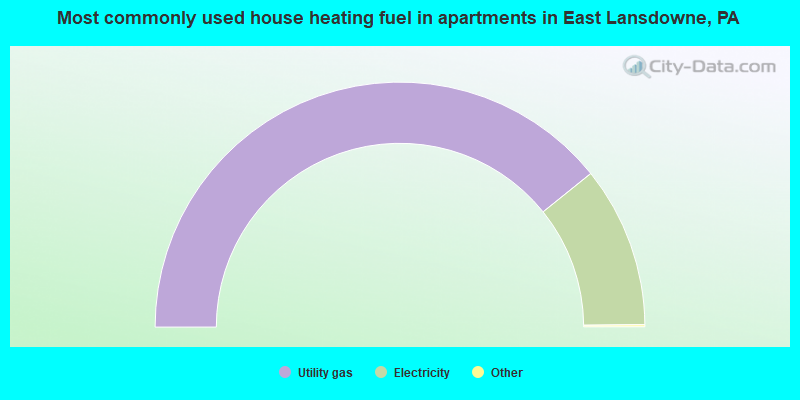
- 78.7%Utility gas
- 21.3%Electricity
East Lansdowne compared to Pennsylvania state average:
- Unemployed percentage below state average.
- Black race population percentage significantly above state average.
- Hispanic race population percentage significantly below state average.
- Median age below state average.
- Foreign-born population percentage significantly above state average.
- Length of stay since moving in above state average.
- House age above state average.
East Lansdowne on our top lists:
- #8 on the list of "Top 101 cities with the most residents born in Sierra Leone (population 500+)"
- #17 on the list of "Top 101 cities with the most residents born in Bangladesh (population 500+)"
- #49 on the list of "Top 101 cities with the most residents born in Other Northern America (population 500+)"
- #51 on the list of "Top 101 cities with the most residents born in Cambodia (population 500+)"
- #52 on the list of "Top 101 cities with the most residents born in Jamaica (population 500+)"
- #83 on the list of "Top 101 cities with the most residents born in Western Africa (population 500+)"
- #85 on the list of "Top 101 cities with the most residents born in Ecuador (population 500+)"
- #91 on the list of "Top 101 cities with the highest housing density (population 2,000+)"
- #95 on the list of "Top 101 cities with the largest percentage of people in religious group quarters (population 1,000+)"
- #96 on the list of "Top 101 cities with the most residents born in Pakistan (population 500+)"
- #14 on the list of "Top 101 counties with the lowest ground withdrawal of fresh water for public supply (pop. 50,000+)"
- #16 on the list of "Top 101 counties with the largest increase in the number of infant deaths per 1000 residents 2000-2006 to 2007-2013 (pop. 50,000+)"
- #20 on the list of "Top 101 counties with the highest Particulate Matter (PM2.5) Annual air pollution readings in 2012 (µg/m3)"
- #40 on the list of "Top 101 counties with the most Mainline Protestant congregations"
- #46 on the list of "Top 101 counties with the highest number of infant deaths per 1000 residents 2007-2013 (pop. 50,000+)"

|
Total of 3 patent applications in 2008-2024.