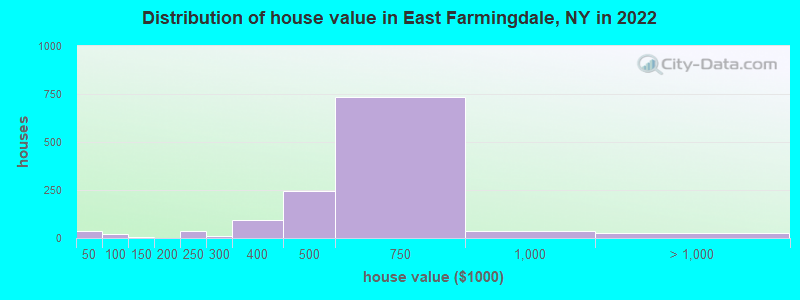
Estimated median house or condo value in 2022: $591,842 (it was $187,000 in 2000)
East Farmingdale:
$591,842
NY:
$400,400
Mean prices in 2022:all housing units: $568,278; detached houses: $577,649; townhouses or other attached units: $525,101; in 2-unit structures: $725,860; in 5-or-more-unit structures: $464,065
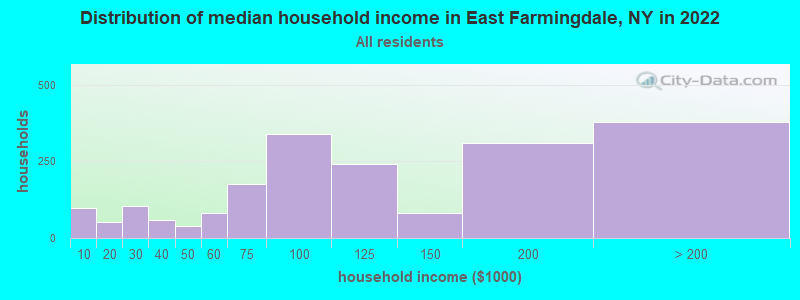
Median gross rent in 2022: $1,964.
March 2022 cost of living index in East Farmingdale: 152.9 (very high, U.S. average is 100)
Percentage of residents living in poverty in 2022: 4.1%
(4.0% for White Non-Hispanic residents, 2.0% for Black residents, 3.2% for Hispanic or Latino residents, 9.2% for other race residents)
Ancestries: Italian (19.2%), Irish (7.6%), American (6.1%), Jamaican (4.5%), German (3.0%), Hungarian (2.9%).
Current Local Time: EST time zone
Elevation: 70 feet
Land area: 5.38 square miles.
Population density: 1,205 people per square mile (low).
951 residents are foreign born (11.1% Latin America, 3.8% Asia).
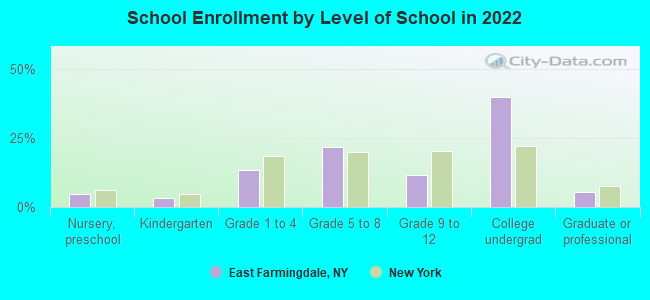
This place:
15.7%
New York:
22.6%
Median real estate property taxes paid for housing units with mortgages in 2022: $10,001 (1.6%) Median real estate property taxes paid for housing units with no mortgage in 2022: $9,738 (1.8%)
Nearest city with pop. 50,000+: Levittown, NY (4.5 miles , pop. 53,067).
Nearest city with pop. 200,000+: North Hempstead, NY (13.1 miles , pop. 222,611).
Nearest city with pop. 1,000,000+: Queens, NY (20.7 miles , pop. 2,229,379).
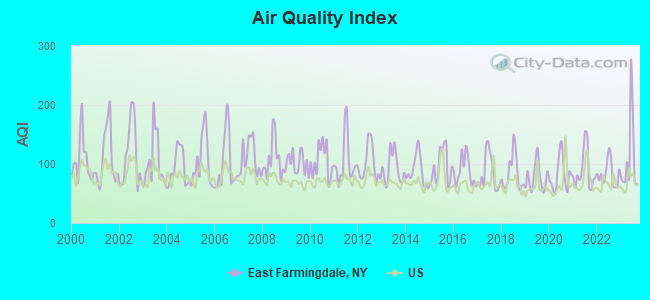
Air Quality Index (AQI) level in 2023 was 108. This is significantly worse than average.
City:
108
U.S.:
73
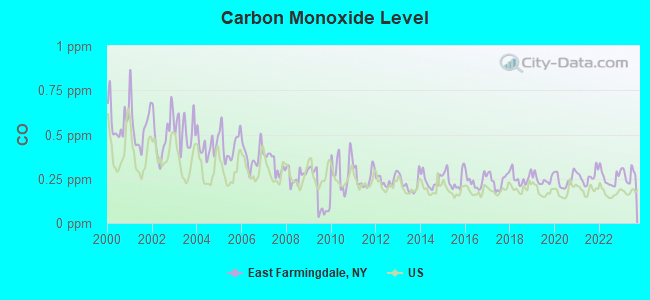
Carbon Monoxide (CO) [ppm] level in 2023 was 0.273. This is about average.Closest monitor was 1.4 miles away from the city center.
City:
0.273
U.S.:
0.251
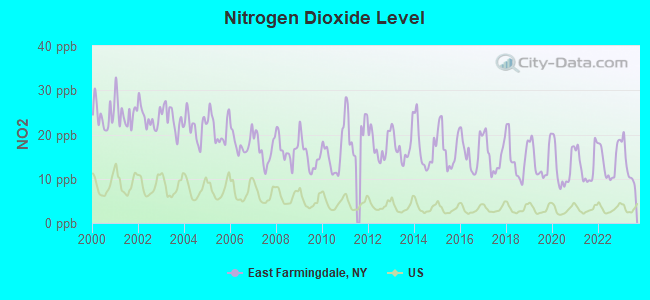
Nitrogen Dioxide (NO2) [ppb] level in 2023 was 12.8. This is significantly worse than average.Closest monitor was 17.5 miles away from the city center.
City:
12.8
U.S.:
5.1
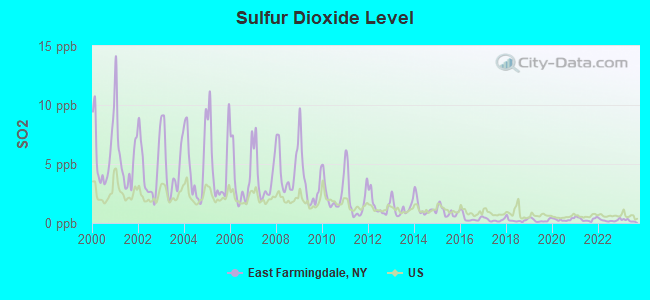
Sulfur Dioxide (SO2) [ppb] level in 2023 was 0.213. This is significantly better than average.Closest monitor was 1.4 miles away from the city center.
City:
0.213
U.S.:
1.515
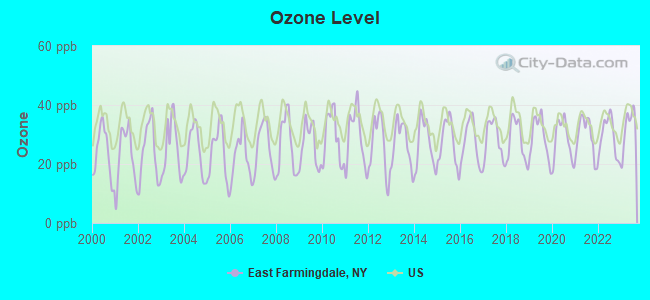
Ozone [ppb] level in 2023 was 32.5. This is about average.Closest monitor was 1.4 miles away from the city center.
City:
32.5
U.S.:
33.3
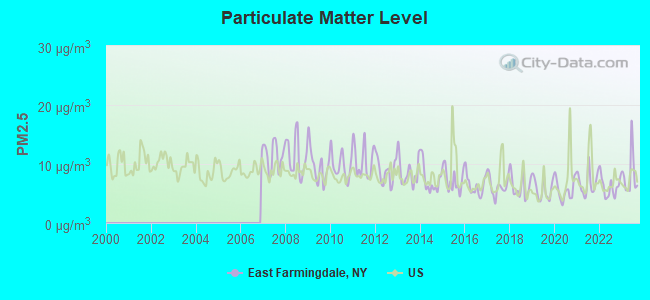
Particulate Matter (PM2.5) [µg/m3] level in 2023 was 8.16. This is about average.Closest monitor was 1.4 miles away from the city center.
City:
8.16
U.S.:
8.11
Tornado activity:
East Farmingdale-area historical tornado activity is slightly above New York state average. It is 56% smaller than the overall U.S. average.
On 7/10/1989, a category F4 (max. wind speeds 207-260 mph) tornado 48.9 miles away from the East Farmingdale place center injured 40 peopleand causedbetween $50,000,000 and $500,000,000 in damages.
On 9/18/1973, a category F2 (max. wind speeds 113-157 mph) tornado 4.0 miles away from the place center .
Earthquake activity:
East Farmingdale-area historical earthquake activity is significantly above New York state average. It is 70% smaller than the overall U.S. average.
On 8/23/2011 at 17:51:04, a magnitude 5.8 (5.8 MW, Depth: 3.7 mi, Class: Moderate, Intensity: VI - VII) earthquake occurred 310.0 miles away from the city center On 10/7/1983 at 10:18:46, a magnitude 5.3 (5.1 MB, 5.3 LG, 5.1 ML) earthquake occurred 228.1 miles away from the city center On 4/20/2002 at 10:50:47, a magnitude 5.3 (5.3 ML, Depth: 3.0 mi) earthquake occurred 262.3 miles away from the city center On 1/16/1994 at 01:49:16, a magnitude 4.6 (4.6 MB, 4.6 LG, Depth: 3.1 mi, Class: Light, Intensity: IV - V) earthquake occurred 139.9 miles away from East Farmingdale center On 4/20/2002 at 10:50:47, a magnitude 5.2 (5.2 MB, 4.2 MS, 5.2 MW, 5.0 MW) earthquake occurred 260.6 miles away from East Farmingdale center On 8/22/1992 at 12:20:32, a magnitude 4.8 (4.8 MB, 3.8 MS, 4.7 LG, Depth: 6.2 mi) earthquake occurred 199.3 miles away from East Farmingdale center Magnitude types: regional Lg-wave magnitude (LG), body-wave magnitude (MB), local magnitude (ML), surface-wave magnitude (MS), moment magnitude (MW)
Natural disasters:
The number of natural disasters in Suffolk County (28) is a lot greater than the US average (15). Major Disasters (Presidential) Declared: 19 Emergencies Declared: 7
Causes of natural disasters: Hurricanes: 9, Floods: 7, Storms: 7, Snowstorms: 4, Winter Storms: 3, Blizzards: 2, Heavy Rain: 1, Power Outage: 1, Tropical Depression: 1, Tropical Storm: 1, Water Shortage: 1, Other: 3 (Note: some incidents may be assigned to more than one category).
Hospitals and medical centers in East Farmingdale:
DALEVIEW CARE CENTER (574 FULTON STREET)
Other hospitals and medical centers near East Farmingdale:
DALEVIEW MANOR HRF (Nursing Home, about 2 miles away; FARMINGDALE, NY)
LONG ISLAND RENAL CARE, INC. (Dialysis Facility, about 2 miles away; NORTH AMITYVILLE, NY)
THE CENTER FOR DEVELOPMENTAL DISABILITIES, INC (Hospital, about 3 miles away; FARMINGDALE, NY)
SOUTH OAKS HOSP (Hospital, about 3 miles away; AMITYVILLE, NY)
BROADLAWN MANOR NH (Nursing Home, about 3 miles away; AMITYVILLE, NY)
BROADLAWN MANOR NURSING AND REHAB CTR (Nursing Home, about 3 miles away; AMITYVILLE, NY)
BRUNSWICK HOSPITAL CENTER, INC (Hospital, about 3 miles away; AMITYVILLE, NY)
Amtrak station near East Farmingdale:
20 miles: KENNEDY AIRPORT NEW YORK (QUEENS, ) - Bus Station . Services: enclosed waiting area, public restrooms, public payphones, snack bar and vending machines, ATM, paid short-term parking, paid long-term parking, car rental agency, taxi stand.
Colleges/universities with over 2000 students nearest to East Farmingdale:
Farmingdale State College (about 3 miles; Farmingdale, NY; Full-time enrollment: 6,956)
Briarcliffe College (about 5 miles; Bethpage, NY; FT enrollment: 2,134)
Nassau Community College (about 9 miles; Garden City, NY; FT enrollment: 18,552)
SUNY College at Old Westbury (about 9 miles; Old Westbury, NY; FT enrollment: 4,096)
Hofstra University (about 10 miles; Hempstead, NY; FT enrollment: 9,429)
Molloy College (about 11 miles; Rockville Centre, NY; FT enrollment: 3,962)
LIU Post (about 11 miles; Brookville, NY; FT enrollment: 6,854)
Suffolk County has a predicted average indoor radon screening level less than 2 pCi/L (pico curies per liter) - Low Potential
Average household size:
This place:
3.0 people
New York:
2.6 people
Percentage of family households:
This place:
70.4%
Whole state:
63.5%
Percentage of households with unmarried partners:
This place:
5.7%
Whole state:
6.8%
Likely homosexual households (counted as self-reported same-sex unmarried-partner households)
Lesbian couples: 0.3% of all households
Gay men: 0.5% of all households
People in group quarters in East Farmingdale in 2010:
458 people in college/university student housing
15 people in group homes intended for adults
7 people in group homes for juveniles (non-correctional)
People in group quarters in East Farmingdale in 2000:
126 people in college dormitories (includes college quarters off campus)
8 people in other noninstitutional group quarters
7 people in other group homes
6 people in homes or halfway houses for drug/alcohol abuse
2 people in homes for the mentally retarded
Banks with branches in East Farmingdale (2011 data):
JPMorgan Chase Bank, National Association: East Farmingdale Branch at 1745 Broad Hollow Road, branch established on 1971/04/28. Info updated 2011/11/10: Bank assets: $1,811,678.0 mil, Deposits: $1,190,738.0 mil, headquarters in Columbus, OH, positive income, International Specialization, 5577 total offices, Holding Company: Jpmorgan Chase & Co.
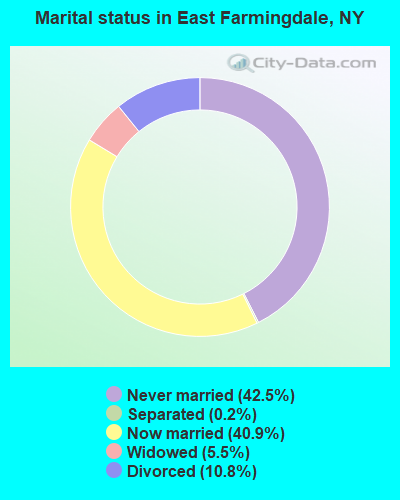
For population 15 years and over in East Farmingdale:
Never married: 42.5%
Now married: 40.9%
Separated: 0.2%
Widowed: 5.5%
Divorced: 10.8%
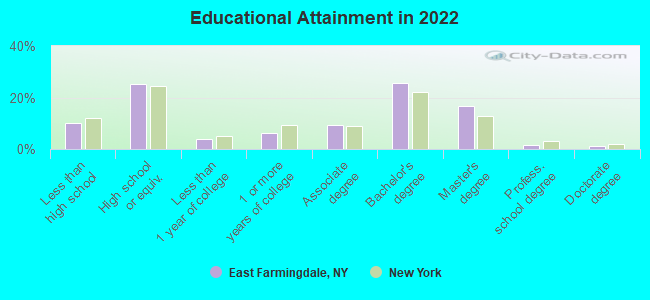
For population 25 years and over in East Farmingdale:
Religion statistics for East Farmingdale, NY (based on Suffolk County data)
Religion
Adherents
Congregations
Catholic
879,457
75
Mainline Protestant
69,205
182
Evangelical Protestant
58,909
264
Other
50,771
124
Orthodox
10,190
10
Black Protestant
8,298
49
None
416,520
-
Source: Clifford Grammich, Kirk Hadaway, Richard Houseal, Dale E.Jones, Alexei Krindatch, Richie Stanley and Richard H.Taylor. 2012. 2010 U.S.Religion Census: Religious Congregations & Membership Study. Association of Statisticians of American Religious Bodies. Jones, Dale E., et al. 2002. Congregations and Membership in the United States 2000. Nashville, TN: Glenmary Research Center. Graphs represent county-level data
Call Sign: KB2MLG, Licensee ID: L00348764, Grant Date: 04/18/2002, Expiration Date: 04/18/2012, Cancellation Date: 04/19/2014, Registrant: Karl S Bonczek, 23 Alexander Ave, East Farmingdale, NY 11735
Call Sign: KB2PDT, Grant Date: 08/18/1992, Expiration Date: 08/18/2002, Cancellation Date: 08/19/2004, Registrant: Ethel A Gardner, 132 E Carmans Rd, East Farmingdale, NY 11735
Call Sign: KC2HYV, Licensee ID: L00353319, Grant Date: 02/03/2011, Expiration Date: 05/03/2021, Cancellation Date: 05/04/2023, Certifier: Joseph M Dirusso, Registrant: Joseph M Dirusso, 124 Locust Ave, East Farmingdale, NY 11735-3898
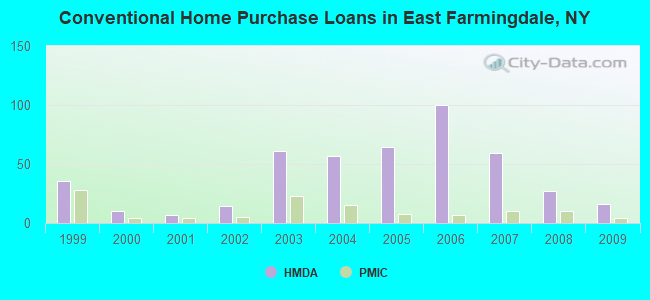
Home Mortgage Disclosure Act Aggregated Statistics For Year 2009 (Based on 1 full and 1 partial tracts)
A) FHA, FSA/RHS & VA Home Purchase Loans
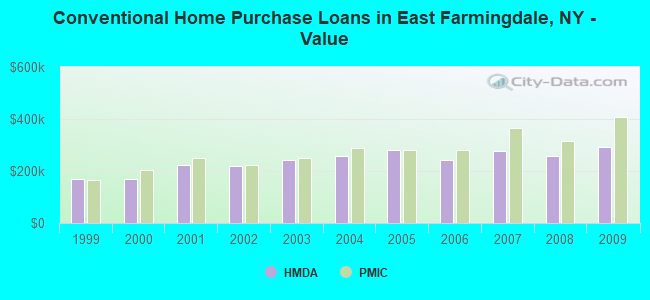
B) Conventional Home Purchase Loans
C) Refinancings
D) Home Improvement Loans
F) Non-occupant Loans on < 5 Family Dwellings (A B C & D)
Number
Average Value
Number
Average Value
Number
Average Value
Number
Average Value
Number
Average Value
LOANS ORIGINATED
8
$333,060
16
$292,128
42
$249,025
4
$86,165
1
$163,450
APPLICATIONS APPROVED, NOT ACCEPTED
0
$0
4
$291,140
11
$267,363
2
$19,395
0
$0
APPLICATIONS DENIED
3
$365,233
5
$301,554
25
$225,031
4
$144,560
4
$164,452
APPLICATIONS WITHDRAWN
3
$309,310
6
$242,390
24
$283,335
1
$27,860
1
$163,450
FILES CLOSED FOR INCOMPLETENESS
0
$0
0
$0
4
$310,482
0
$0
0
$0
Aggregated Statistics For Year 2008 (Based on 1 full and 1 partial tracts)
A) FHA, FSA/RHS & VA Home Purchase Loans
B) Conventional Home Purchase Loans
C) Refinancings
D) Home Improvement Loans
F) Non-occupant Loans on < 5 Family Dwellings (A B C & D)
Number
Average Value
Number
Average Value
Number
Average Value
Number
Average Value
Number
Average Value
LOANS ORIGINATED
4
$304,710
27
$256,422
23
$294,160
5
$54,316
4
$217,862
APPLICATIONS APPROVED, NOT ACCEPTED
0
$0
3
$224,347
10
$245,294
0
$0
0
$0
APPLICATIONS DENIED
3
$338,047
5
$317,972
33
$340,513
5
$51,006
2
$235,590
APPLICATIONS WITHDRAWN
0
$0
5
$267,702
11
$330,229
1
$120,730
1
$163,450
FILES CLOSED FOR INCOMPLETENESS
0
$0
1
$317,620
5
$323,370
1
$246,110
0
$0
Aggregated Statistics For Year 2007 (Based on 1 full and 1 partial tracts)
A) FHA, FSA/RHS & VA Home Purchase Loans
B) Conventional Home Purchase Loans
C) Refinancings
D) Home Improvement Loans
F) Non-occupant Loans on < 5 Family Dwellings (A B C & D)
Number
Average Value
Number
Average Value
Number
Average Value
Number
Average Value
Number
Average Value
LOANS ORIGINATED
1
$335,000
59
$276,451
66
$241,284
15
$97,201
6
$331,707
APPLICATIONS APPROVED, NOT ACCEPTED
0
$0
12
$238,672
19
$273,622
5
$138,658
3
$303,377
APPLICATIONS DENIED
0
$0
29
$286,749
37
$308,862
23
$108,866
8
$333,345
APPLICATIONS WITHDRAWN
0
$0
6
$303,113
22
$273,694
2
$257,250
0
$0
FILES CLOSED FOR INCOMPLETENESS
0
$0
4
$365,555
13
$274,101
1
$275,000
0
$0
Aggregated Statistics For Year 2006 (Based on 1 full and 1 partial tracts)
A) FHA, FSA/RHS & VA Home Purchase Loans
B) Conventional Home Purchase Loans
C) Refinancings
D) Home Improvement Loans
F) Non-occupant Loans on < 5 Family Dwellings (A B C & D)
Number
Average Value
Number
Average Value
Number
Average Value
Number
Average Value
Number
Average Value
LOANS ORIGINATED
1
$345,000
100
$240,664
122
$268,246
24
$105,296
15
$284,507
APPLICATIONS APPROVED, NOT ACCEPTED
0
$0
12
$243,267
18
$213,050
11
$71,035
1
$97,510
APPLICATIONS DENIED
0
$0
40
$295,582
61
$251,010
19
$93,855
5
$344,362
APPLICATIONS WITHDRAWN
0
$0
18
$236,524
41
$257,549
2
$40,000
3
$332,693
FILES CLOSED FOR INCOMPLETENESS
0
$0
9
$226,390
9
$301,426
1
$69,650
0
$0
Aggregated Statistics For Year 2005 (Based on 1 full and 1 partial tracts)
B) Conventional Home Purchase Loans
C) Refinancings
D) Home Improvement Loans
F) Non-occupant Loans on < 5 Family Dwellings (A B C & D)
Number
Average Value
Number
Average Value
Number
Average Value
Number
Average Value
LOANS ORIGINATED
64
$280,118
126
$231,468
17
$97,514
10
$253,808
APPLICATIONS APPROVED, NOT ACCEPTED
14
$290,725
19
$262,008
5
$78,466
3
$259,927
APPLICATIONS DENIED
16
$248,686
73
$232,654
22
$91,315
6
$251,270
APPLICATIONS WITHDRAWN
12
$229,564
55
$274,666
7
$308,454
2
$171,090
FILES CLOSED FOR INCOMPLETENESS
5
$259,780
34
$297,929
3
$84,887
2
$174,000
Aggregated Statistics For Year 2004 (Based on 1 full and 1 partial tracts)
A) FHA, FSA/RHS & VA Home Purchase Loans
B) Conventional Home Purchase Loans
C) Refinancings
D) Home Improvement Loans
E) Loans on Dwellings For 5+ Families
F) Non-occupant Loans on < 5 Family Dwellings (A B C & D)
Number
Average Value
Number
Average Value
Number
Average Value
Number
Average Value
Number
Average Value
Number
Average Value
LOANS ORIGINATED
1
$233,000
57
$257,655
145
$222,027
19
$95,959
0
$0
3
$255,597
APPLICATIONS APPROVED, NOT ACCEPTED
0
$0
8
$379,091
32
$214,749
4
$177,532
0
$0
5
$261,008
APPLICATIONS DENIED
1
$204,310
27
$268,638
80
$233,623
18
$96,671
1
$349,000
6
$282,225
APPLICATIONS WITHDRAWN
2
$295,805
9
$262,719
61
$232,184
12
$152,185
0
$0
3
$303,377
FILES CLOSED FOR INCOMPLETENESS
0
$0
2
$171,500
33
$210,871
4
$238,675
0
$0
2
$163,520
Aggregated Statistics For Year 2003 (Based on 1 full and 1 partial tracts)
A) FHA, FSA/RHS & VA Home Purchase Loans
B) Conventional Home Purchase Loans
C) Refinancings
D) Home Improvement Loans
E) Loans on Dwellings For 5+ Families
F) Non-occupant Loans on < 5 Family Dwellings (A B C & D)
Number
Average Value
Number
Average Value
Number
Average Value
Number
Average Value
Number
Average Value
Number
Average Value
LOANS ORIGINATED
5
$184,440
61
$243,661
249
$188,286
10
$35,819
1
$1,532,360
11
$175,519
APPLICATIONS APPROVED, NOT ACCEPTED
0
$0
9
$201,580
54
$179,417
7
$35,290
0
$0
4
$151,765
APPLICATIONS DENIED
0
$0
12
$216,704
77
$197,229
9
$55,093
0
$0
9
$166,281
APPLICATIONS WITHDRAWN
0
$0
1
$32,500
84
$194,917
5
$40,062
0
$0
4
$177,585
FILES CLOSED FOR INCOMPLETENESS
0
$0
1
$168,000
8
$155,301
2
$48,220
0
$0
1
$235,000
Aggregated Statistics For Year 2002 (Based on 1 full tract)
A) FHA, FSA/RHS & VA Home Purchase Loans
B) Conventional Home Purchase Loans
C) Refinancings
D) Home Improvement Loans
F) Non-occupant Loans on < 5 Family Dwellings (A B C & D)
Number
Average Value
Number
Average Value
Number
Average Value
Number
Average Value
Number
Average Value
LOANS ORIGINATED
1
$224,000
14
$217,357
39
$153,974
1
$20,000
2
$148,000
APPLICATIONS APPROVED, NOT ACCEPTED
0
$0
6
$136,500
11
$124,727
0
$0
2
$111,500
APPLICATIONS DENIED
0
$0
1
$158,000
23
$143,130
0
$0
1
$64,000
APPLICATIONS WITHDRAWN
0
$0
1
$144,000
14
$166,286
1
$30,000
0
$0
FILES CLOSED FOR INCOMPLETENESS
0
$0
1
$175,000
4
$151,750
0
$0
0
$0
Aggregated Statistics For Year 2001 (Based on 1 full tract)
A) FHA, FSA/RHS & VA Home Purchase Loans
B) Conventional Home Purchase Loans
C) Refinancings
D) Home Improvement Loans
F) Non-occupant Loans on < 5 Family Dwellings (A B C & D)
Number
Average Value
Number
Average Value
Number
Average Value
Number
Average Value
Number
Average Value
LOANS ORIGINATED
10
$181,200
7
$223,714
37
$158,919
5
$17,200
1
$99,000
APPLICATIONS APPROVED, NOT ACCEPTED
0
$0
2
$149,000
13
$117,615
3
$21,000
0
$0
APPLICATIONS DENIED
0
$0
5
$181,200
28
$143,500
5
$60,600
1
$50,000
APPLICATIONS WITHDRAWN
0
$0
0
$0
25
$138,000
1
$30,000
0
$0
FILES CLOSED FOR INCOMPLETENESS
0
$0
0
$0
3
$113,333
0
$0
0
$0
Aggregated Statistics For Year 2000 (Based on 1 full tract)
A) FHA, FSA/RHS & VA Home Purchase Loans
B) Conventional Home Purchase Loans
C) Refinancings
D) Home Improvement Loans
F) Non-occupant Loans on < 5 Family Dwellings (A B C & D)
Number
Average Value
Number
Average Value
Number
Average Value
Number
Average Value
Number
Average Value
LOANS ORIGINATED
6
$166,000
10
$171,000
11
$117,818
4
$45,000
1
$100,000
APPLICATIONS APPROVED, NOT ACCEPTED
1
$166,000
1
$93,000
3
$161,000
2
$39,000
0
$0
APPLICATIONS DENIED
2
$170,000
6
$195,167
14
$112,500
6
$10,667
0
$0
APPLICATIONS WITHDRAWN
0
$0
3
$127,667
16
$73,250
0
$0
1
$37,000
FILES CLOSED FOR INCOMPLETENESS
1
$162,000
1
$90,000
6
$125,667
1
$50,000
0
$0
Aggregated Statistics For Year 1999 (Based on 2 full tracts)
A) FHA, FSA/RHS & VA Home Purchase Loans
B) Conventional Home Purchase Loans
C) Refinancings
D) Home Improvement Loans
F) Non-occupant Loans on < 5 Family Dwellings (A B C & D)
#5 on the list of "Top 101 cities that people commute into (largest positive percentage daily daytime population change due to commuting) (population 5,000+)"
#18 on the list of "Top 101 cities with the most residents born in Afghanistan (population 500+)"
#91 on the list of "Top 101 cities with the most residents born in Trinidad and Tobago (population 500+)"
#3 on the list of "Top 101 counties with the most Catholic adherents"
#6 on the list of "Top 101 counties with the lowest percentage of residents relocating from other counties between 2010 and 2011"
#7 on the list of "Top 101 counties with the lowest surface withdrawal of fresh water for public supply (pop. 50,000+)"
#9 on the list of "Top 101 counties with the lowest percentage of residents relocating to other counties in 2011"
#19 on the list of "Top 101 counties with the highest ground withdrawal of fresh water for public supply (pop. 50,000+)"
Top Patent Applicants
Target Rock Division Of Curtiss-Wright Flow Contro (1)


 Recent articles from our blog. Our writers, many of them Ph.D. graduates or candidates, create easy-to-read articles on a wide variety of topics.

 (4.5 miles