Copiague, New York Submit your own pictures of this place and show them to the world
OSM Map
General Map
Google Map
MSN Map
OSM Map
General Map
Google Map
MSN Map
OSM Map
General Map
Google Map
MSN Map
OSM Map
General Map
Google Map
MSN Map
Please wait while loading the map...
Population in 2010: 22,993. Population change since 2000: +4.9%Males: 11,248 Females: 11,745
March 2022 cost of living index in Copiague: 150.5 (very high, U.S. average is 100) Percentage of residents living in poverty in 2022: 10.8%for White Non-Hispanic residents , 14.7% for Black residents , 16.1% for Hispanic or Latino residents , 1.7% for American Indian residents , 20.1% for other race residents , 8.2% for two or more races residents )
Profiles of local businesses
Business Search - 14 Million verified businesses
Data:
Median household income ($)
Median household income (% change since 2000)
Household income diversity
Ratio of average income to average house value (%)
Ratio of average income to average rent
Median household income ($) - White
Median household income ($) - Black or African American
Median household income ($) - Asian
Median household income ($) - Hispanic or Latino
Median household income ($) - American Indian and Alaska Native
Median household income ($) - Multirace
Median household income ($) - Other Race
Median household income for houses/condos with a mortgage ($)
Median household income for apartments without a mortgage ($)
Races - White alone (%)
Races - White alone (% change since 2000)
Races - Black alone (%)
Races - Black alone (% change since 2000)
Races - American Indian alone (%)
Races - American Indian alone (% change since 2000)
Races - Asian alone (%)
Races - Asian alone (% change since 2000)
Races - Hispanic (%)
Races - Hispanic (% change since 2000)
Races - Native Hawaiian and Other Pacific Islander alone (%)
Races - Native Hawaiian and Other Pacific Islander alone (% change since 2000)
Races - Two or more races (%)
Races - Two or more races (% change since 2000)
Races - Other race alone (%)
Races - Other race alone (% change since 2000)
Racial diversity
Unemployment (%)
Unemployment (% change since 2000)
Unemployment (%) - White
Unemployment (%) - Black or African American
Unemployment (%) - Asian
Unemployment (%) - Hispanic or Latino
Unemployment (%) - American Indian and Alaska Native
Unemployment (%) - Multirace
Unemployment (%) - Other Race
Population density (people per square mile)
Population - Males (%)
Population - Females (%)
Population - Males (%) - White
Population - Males (%) - Black or African American
Population - Males (%) - Asian
Population - Males (%) - Hispanic or Latino
Population - Males (%) - American Indian and Alaska Native
Population - Males (%) - Multirace
Population - Males (%) - Other Race
Population - Females (%) - White
Population - Females (%) - Black or African American
Population - Females (%) - Asian
Population - Females (%) - Hispanic or Latino
Population - Females (%) - American Indian and Alaska Native
Population - Females (%) - Multirace
Population - Females (%) - Other Race
Coronavirus confirmed cases (Jul 02, 2024)
Deaths caused by coronavirus (Jul 02, 2024)
Coronavirus confirmed cases (per 100k population) (Jul 02, 2024)
Deaths caused by coronavirus (per 100k population) (Jul 02, 2024)
Daily increase in number of cases (Jul 02, 2024)
Weekly increase in number of cases (Jul 02, 2024)
Cases doubled (in days) (Jul 02, 2024)
Hospitalized patients (Apr 18, 2022)
Negative test results (Apr 18, 2022)
Total test results (Apr 18, 2022)
COVID Vaccine doses distributed (per 100k population) (Sep 19, 2023)
COVID Vaccine doses administered (per 100k population) (Sep 19, 2023)
COVID Vaccine doses distributed (Sep 19, 2023)
COVID Vaccine doses administered (Sep 19, 2023)
Likely homosexual households (%)
Likely homosexual households (% change since 2000)
Likely homosexual households - Lesbian couples (%)
Likely homosexual households - Lesbian couples (% change since 2000)
Likely homosexual households - Gay men (%)
Likely homosexual households - Gay men (% change since 2000)
Cost of living index
Median gross rent ($)
Median contract rent ($)
Median monthly housing costs ($)
Median house or condo value ($)
Median house or condo value ($ change since 2000)
Mean house or condo value by units in structure - 1, detached ($)
Mean house or condo value by units in structure - 1, attached ($)
Mean house or condo value by units in structure - 2 ($)
Mean house or condo value by units in structure by units in structure - 3 or 4 ($)
Mean house or condo value by units in structure - 5 or more ($)
Mean house or condo value by units in structure - Boat, RV, van, etc. ($)
Mean house or condo value by units in structure - Mobile home ($)
Median house or condo value ($) - White
Median house or condo value ($) - Black or African American
Median house or condo value ($) - Asian
Median house or condo value ($) - Hispanic or Latino
Median house or condo value ($) - American Indian and Alaska Native
Median house or condo value ($) - Multirace
Median house or condo value ($) - Other Race
Median resident age
Resident age diversity
Median resident age - Males
Median resident age - Females
Median resident age - White
Median resident age - Black or African American
Median resident age - Asian
Median resident age - Hispanic or Latino
Median resident age - American Indian and Alaska Native
Median resident age - Multirace
Median resident age - Other Race
Median resident age - Males - White
Median resident age - Males - Black or African American
Median resident age - Males - Asian
Median resident age - Males - Hispanic or Latino
Median resident age - Males - American Indian and Alaska Native
Median resident age - Males - Multirace
Median resident age - Males - Other Race
Median resident age - Females - White
Median resident age - Females - Black or African American
Median resident age - Females - Asian
Median resident age - Females - Hispanic or Latino
Median resident age - Females - American Indian and Alaska Native
Median resident age - Females - Multirace
Median resident age - Females - Other Race
Commute - mean travel time to work (minutes)
Travel time to work - Less than 5 minutes (%)
Travel time to work - Less than 5 minutes (% change since 2000)
Travel time to work - 5 to 9 minutes (%)
Travel time to work - 5 to 9 minutes (% change since 2000)
Travel time to work - 10 to 19 minutes (%)
Travel time to work - 10 to 19 minutes (% change since 2000)
Travel time to work - 20 to 29 minutes (%)
Travel time to work - 20 to 29 minutes (% change since 2000)
Travel time to work - 30 to 39 minutes (%)
Travel time to work - 30 to 39 minutes (% change since 2000)
Travel time to work - 40 to 59 minutes (%)
Travel time to work - 40 to 59 minutes (% change since 2000)
Travel time to work - 60 to 89 minutes (%)
Travel time to work - 60 to 89 minutes (% change since 2000)
Travel time to work - 90 or more minutes (%)
Travel time to work - 90 or more minutes (% change since 2000)
Marital status - Never married (%)
Marital status - Now married (%)
Marital status - Separated (%)
Marital status - Widowed (%)
Marital status - Divorced (%)
Median family income ($)
Median family income (% change since 2000)
Median non-family income ($)
Median non-family income (% change since 2000)
Median per capita income ($)
Median per capita income (% change since 2000)
Median family income ($) - White
Median family income ($) - Black or African American
Median family income ($) - Asian
Median family income ($) - Hispanic or Latino
Median family income ($) - American Indian and Alaska Native
Median family income ($) - Multirace
Median family income ($) - Other Race
Median year house/condo built
Median year apartment built
Year house built - Built 2005 or later (%)
Year house built - Built 2000 to 2004 (%)
Year house built - Built 1990 to 1999 (%)
Year house built - Built 1980 to 1989 (%)
Year house built - Built 1970 to 1979 (%)
Year house built - Built 1960 to 1969 (%)
Year house built - Built 1950 to 1959 (%)
Year house built - Built 1940 to 1949 (%)
Year house built - Built 1939 or earlier (%)
Average household size
Household density (households per square mile)
Average household size - White
Average household size - Black or African American
Average household size - Asian
Average household size - Hispanic or Latino
Average household size - American Indian and Alaska Native
Average household size - Multirace
Average household size - Other Race
Occupied housing units (%)
Vacant housing units (%)
Owner occupied housing units (%)
Renter occupied housing units (%)
Vacancy status - For rent (%)
Vacancy status - For sale only (%)
Vacancy status - Rented or sold, not occupied (%)
Vacancy status - For seasonal, recreational, or occasional use (%)
Vacancy status - For migrant workers (%)
Vacancy status - Other vacant (%)
Residents with income below the poverty level (%)
Residents with income below 50% of the poverty level (%)
Children below poverty level (%)
Poor families by family type - Married-couple family (%)
Poor families by family type - Male, no wife present (%)
Poor families by family type - Female, no husband present (%)
Poverty status for native-born residents (%)
Poverty status for foreign-born residents (%)
Poverty among high school graduates not in families (%)
Poverty among people who did not graduate high school not in families (%)
Residents with income below the poverty level (%) - White
Residents with income below the poverty level (%) - Black or African American
Residents with income below the poverty level (%) - Asian
Residents with income below the poverty level (%) - Hispanic or Latino
Residents with income below the poverty level (%) - American Indian and Alaska Native
Residents with income below the poverty level (%) - Multirace
Residents with income below the poverty level (%) - Other Race
Air pollution - Air Quality Index (AQI)
Air pollution - CO
Air pollution - NO2
Air pollution - SO2
Air pollution - Ozone
Air pollution - PM10
Air pollution - PM25
Air pollution - Pb
Crime - Murders per 100,000 population
Crime - Rapes per 100,000 population
Crime - Robberies per 100,000 population
Crime - Assaults per 100,000 population
Crime - Burglaries per 100,000 population
Crime - Thefts per 100,000 population
Crime - Auto thefts per 100,000 population
Crime - Arson per 100,000 population
Crime - City-data.com crime index
Crime - Violent crime index
Crime - Property crime index
Crime - Murders per 100,000 population (5 year average)
Crime - Rapes per 100,000 population (5 year average)
Crime - Robberies per 100,000 population (5 year average)
Crime - Assaults per 100,000 population (5 year average)
Crime - Burglaries per 100,000 population (5 year average)
Crime - Thefts per 100,000 population (5 year average)
Crime - Auto thefts per 100,000 population (5 year average)
Crime - Arson per 100,000 population (5 year average)
Crime - City-data.com crime index (5 year average)
Crime - Violent crime index (5 year average)
Crime - Property crime index (5 year average)
1996 Presidential Elections Results (%) - Democratic Party (Clinton)
1996 Presidential Elections Results (%) - Republican Party (Dole)
1996 Presidential Elections Results (%) - Other
2000 Presidential Elections Results (%) - Democratic Party (Gore)
2000 Presidential Elections Results (%) - Republican Party (Bush)
2000 Presidential Elections Results (%) - Other
2004 Presidential Elections Results (%) - Democratic Party (Kerry)
2004 Presidential Elections Results (%) - Republican Party (Bush)
2004 Presidential Elections Results (%) - Other
2008 Presidential Elections Results (%) - Democratic Party (Obama)
2008 Presidential Elections Results (%) - Republican Party (McCain)
2008 Presidential Elections Results (%) - Other
2012 Presidential Elections Results (%) - Democratic Party (Obama)
2012 Presidential Elections Results (%) - Republican Party (Romney)
2012 Presidential Elections Results (%) - Other
2016 Presidential Elections Results (%) - Democratic Party (Clinton)
2016 Presidential Elections Results (%) - Republican Party (Trump)
2016 Presidential Elections Results (%) - Other
2020 Presidential Elections Results (%) - Democratic Party (Biden)
2020 Presidential Elections Results (%) - Republican Party (Trump)
2020 Presidential Elections Results (%) - Other
Ancestries Reported - Arab (%)
Ancestries Reported - Czech (%)
Ancestries Reported - Danish (%)
Ancestries Reported - Dutch (%)
Ancestries Reported - English (%)
Ancestries Reported - French (%)
Ancestries Reported - French Canadian (%)
Ancestries Reported - German (%)
Ancestries Reported - Greek (%)
Ancestries Reported - Hungarian (%)
Ancestries Reported - Irish (%)
Ancestries Reported - Italian (%)
Ancestries Reported - Lithuanian (%)
Ancestries Reported - Norwegian (%)
Ancestries Reported - Polish (%)
Ancestries Reported - Portuguese (%)
Ancestries Reported - Russian (%)
Ancestries Reported - Scotch-Irish (%)
Ancestries Reported - Scottish (%)
Ancestries Reported - Slovak (%)
Ancestries Reported - Subsaharan African (%)
Ancestries Reported - Swedish (%)
Ancestries Reported - Swiss (%)
Ancestries Reported - Ukrainian (%)
Ancestries Reported - United States (%)
Ancestries Reported - Welsh (%)
Ancestries Reported - West Indian (%)
Ancestries Reported - Other (%)
Educational Attainment - No schooling completed (%)
Educational Attainment - Less than high school (%)
Educational Attainment - High school or equivalent (%)
Educational Attainment - Less than 1 year of college (%)
Educational Attainment - 1 or more years of college (%)
Educational Attainment - Associate degree (%)
Educational Attainment - Bachelor's degree (%)
Educational Attainment - Master's degree (%)
Educational Attainment - Professional school degree (%)
Educational Attainment - Doctorate degree (%)
School Enrollment - Nursery, preschool (%)
School Enrollment - Kindergarten (%)
School Enrollment - Grade 1 to 4 (%)
School Enrollment - Grade 5 to 8 (%)
School Enrollment - Grade 9 to 12 (%)
School Enrollment - College undergrad (%)
School Enrollment - Graduate or professional (%)
School Enrollment - Not enrolled in school (%)
School enrollment - Public schools (%)
School enrollment - Private schools (%)
School enrollment - Not enrolled (%)
Median number of rooms in houses and condos
Median number of rooms in apartments
Housing units lacking complete plumbing facilities (%)
Housing units lacking complete kitchen facilities (%)
Density of houses
Urban houses (%)
Rural houses (%)
Households with people 60 years and over (%)
Households with people 65 years and over (%)
Households with people 75 years and over (%)
Households with one or more nonrelatives (%)
Households with no nonrelatives (%)
Population in households (%)
Family households (%)
Nonfamily households (%)
Population in families (%)
Family households with own children (%)
Median number of bedrooms in owner occupied houses
Mean number of bedrooms in owner occupied houses
Median number of bedrooms in renter occupied houses
Mean number of bedrooms in renter occupied houses
Median number of vehichles in owner occupied houses
Mean number of vehichles in owner occupied houses
Median number of vehichles in renter occupied houses
Mean number of vehichles in renter occupied houses
Mortgage status - with mortgage (%)
Mortgage status - with second mortgage (%)
Mortgage status - with home equity loan (%)
Mortgage status - with both second mortgage and home equity loan (%)
Mortgage status - without a mortgage (%)
Average family size
Average family size - White
Average family size - Black or African American
Average family size - Asian
Average family size - Hispanic or Latino
Average family size - American Indian and Alaska Native
Average family size - Multirace
Average family size - Other Race
Geographical mobility - Same house 1 year ago (%)
Geographical mobility - Moved within same county (%)
Geographical mobility - Moved from different county within same state (%)
Geographical mobility - Moved from different state (%)
Geographical mobility - Moved from abroad (%)
Place of birth - Born in state of residence (%)
Place of birth - Born in other state (%)
Place of birth - Native, outside of US (%)
Place of birth - Foreign born (%)
Housing units in structures - 1, detached (%)
Housing units in structures - 1, attached (%)
Housing units in structures - 2 (%)
Housing units in structures - 3 or 4 (%)
Housing units in structures - 5 to 9 (%)
Housing units in structures - 10 to 19 (%)
Housing units in structures - 20 to 49 (%)
Housing units in structures - 50 or more (%)
Housing units in structures - Mobile home (%)
Housing units in structures - Boat, RV, van, etc. (%)
House/condo owner moved in on average (years ago)
Renter moved in on average (years ago)
Year householder moved into unit - Moved in 1999 to March 2000 (%)
Year householder moved into unit - Moved in 1995 to 1998 (%)
Year householder moved into unit - Moved in 1990 to 1994 (%)
Year householder moved into unit - Moved in 1980 to 1989 (%)
Year householder moved into unit - Moved in 1970 to 1979 (%)
Year householder moved into unit - Moved in 1969 or earlier (%)
Means of transportation to work - Drove car alone (%)
Means of transportation to work - Carpooled (%)
Means of transportation to work - Public transportation (%)
Means of transportation to work - Bus or trolley bus (%)
Means of transportation to work - Streetcar or trolley car (%)
Means of transportation to work - Subway or elevated (%)
Means of transportation to work - Railroad (%)
Means of transportation to work - Ferryboat (%)
Means of transportation to work - Taxicab (%)
Means of transportation to work - Motorcycle (%)
Means of transportation to work - Bicycle (%)
Means of transportation to work - Walked (%)
Means of transportation to work - Other means (%)
Working at home (%)
Industry diversity
Most Common Industries - Agriculture, forestry, fishing and hunting, and mining (%)
Most Common Industries - Agriculture, forestry, fishing and hunting (%)
Most Common Industries - Mining, quarrying, and oil and gas extraction (%)
Most Common Industries - Construction (%)
Most Common Industries - Manufacturing (%)
Most Common Industries - Wholesale trade (%)
Most Common Industries - Retail trade (%)
Most Common Industries - Transportation and warehousing, and utilities (%)
Most Common Industries - Transportation and warehousing (%)
Most Common Industries - Utilities (%)
Most Common Industries - Information (%)
Most Common Industries - Finance and insurance, and real estate and rental and leasing (%)
Most Common Industries - Finance and insurance (%)
Most Common Industries - Real estate and rental and leasing (%)
Most Common Industries - Professional, scientific, and management, and administrative and waste management services (%)
Most Common Industries - Professional, scientific, and technical services (%)
Most Common Industries - Management of companies and enterprises (%)
Most Common Industries - Administrative and support and waste management services (%)
Most Common Industries - Educational services, and health care and social assistance (%)
Most Common Industries - Educational services (%)
Most Common Industries - Health care and social assistance (%)
Most Common Industries - Arts, entertainment, and recreation, and accommodation and food services (%)
Most Common Industries - Arts, entertainment, and recreation (%)
Most Common Industries - Accommodation and food services (%)
Most Common Industries - Other services, except public administration (%)
Most Common Industries - Public administration (%)
Occupation diversity
Most Common Occupations - Management, business, science, and arts occupations (%)
Most Common Occupations - Management, business, and financial occupations (%)
Most Common Occupations - Management occupations (%)
Most Common Occupations - Business and financial operations occupations (%)
Most Common Occupations - Computer, engineering, and science occupations (%)
Most Common Occupations - Computer and mathematical occupations (%)
Most Common Occupations - Architecture and engineering occupations (%)
Most Common Occupations - Life, physical, and social science occupations (%)
Most Common Occupations - Education, legal, community service, arts, and media occupations (%)
Most Common Occupations - Community and social service occupations (%)
Most Common Occupations - Legal occupations (%)
Most Common Occupations - Education, training, and library occupations (%)
Most Common Occupations - Arts, design, entertainment, sports, and media occupations (%)
Most Common Occupations - Healthcare practitioners and technical occupations (%)
Most Common Occupations - Health diagnosing and treating practitioners and other technical occupations (%)
Most Common Occupations - Health technologists and technicians (%)
Most Common Occupations - Service occupations (%)
Most Common Occupations - Healthcare support occupations (%)
Most Common Occupations - Protective service occupations (%)
Most Common Occupations - Fire fighting and prevention, and other protective service workers including supervisors (%)
Most Common Occupations - Law enforcement workers including supervisors (%)
Most Common Occupations - Food preparation and serving related occupations (%)
Most Common Occupations - Building and grounds cleaning and maintenance occupations (%)
Most Common Occupations - Personal care and service occupations (%)
Most Common Occupations - Sales and office occupations (%)
Most Common Occupations - Sales and related occupations (%)
Most Common Occupations - Office and administrative support occupations (%)
Most Common Occupations - Natural resources, construction, and maintenance occupations (%)
Most Common Occupations - Farming, fishing, and forestry occupations (%)
Most Common Occupations - Construction and extraction occupations (%)
Most Common Occupations - Installation, maintenance, and repair occupations (%)
Most Common Occupations - Production, transportation, and material moving occupations (%)
Most Common Occupations - Production occupations (%)
Most Common Occupations - Transportation occupations (%)
Most Common Occupations - Material moving occupations (%)
People in Group quarters - Institutionalized population (%)
People in Group quarters - Correctional institutions (%)
People in Group quarters - Federal prisons and detention centers (%)
People in Group quarters - Halfway houses (%)
People in Group quarters - Local jails and other confinement facilities (including police lockups) (%)
People in Group quarters - Military disciplinary barracks (%)
People in Group quarters - State prisons (%)
People in Group quarters - Other types of correctional institutions (%)
People in Group quarters - Nursing homes (%)
People in Group quarters - Hospitals/wards, hospices, and schools for the handicapped (%)
People in Group quarters - Hospitals/wards and hospices for chronically ill (%)
People in Group quarters - Hospices or homes for chronically ill (%)
People in Group quarters - Military hospitals or wards for chronically ill (%)
People in Group quarters - Other hospitals or wards for chronically ill (%)
People in Group quarters - Hospitals or wards for drug/alcohol abuse (%)
People in Group quarters - Mental (Psychiatric) hospitals or wards (%)
People in Group quarters - Schools, hospitals, or wards for the mentally retarded (%)
People in Group quarters - Schools, hospitals, or wards for the physically handicapped (%)
People in Group quarters - Institutions for the deaf (%)
People in Group quarters - Institutions for the blind (%)
People in Group quarters - Orthopedic wards and institutions for the physically handicapped (%)
People in Group quarters - Wards in general hospitals for patients who have no usual home elsewhere (%)
People in Group quarters - Wards in military hospitals for patients who have no usual home elsewhere (%)
People in Group quarters - Juvenile institutions (%)
People in Group quarters - Long-term care (%)
People in Group quarters - Homes for abused, dependent, and neglected children (%)
People in Group quarters - Residential treatment centers for emotionally disturbed children (%)
People in Group quarters - Training schools for juvenile delinquents (%)
People in Group quarters - Short-term care, detention or diagnostic centers for delinquent children (%)
People in Group quarters - Type of juvenile institution unknown (%)
People in Group quarters - Noninstitutionalized population (%)
People in Group quarters - College dormitories (includes college quarters off campus) (%)
People in Group quarters - Military quarters (%)
People in Group quarters - On base (%)
People in Group quarters - Barracks, unaccompanied personnel housing (UPH), (Enlisted/Officer), ;and similar group living quarters for military personnel (%)
People in Group quarters - Transient quarters for temporary residents (%)
People in Group quarters - Military ships (%)
People in Group quarters - Group homes (%)
People in Group quarters - Homes or halfway houses for drug/alcohol abuse (%)
People in Group quarters - Homes for the mentally ill (%)
People in Group quarters - Homes for the mentally retarded (%)
People in Group quarters - Homes for the physically handicapped (%)
People in Group quarters - Other group homes (%)
People in Group quarters - Religious group quarters (%)
People in Group quarters - Dormitories (%)
People in Group quarters - Agriculture workers' dormitories on farms (%)
People in Group quarters - Job Corps and vocational training facilities (%)
People in Group quarters - Other workers' dormitories (%)
People in Group quarters - Crews of maritime vessels (%)
People in Group quarters - Other nonhousehold living situations (%)
People in Group quarters - Other noninstitutional group quarters (%)
Residents speaking English at home (%)
Residents speaking English at home - Born in the United States (%)
Residents speaking English at home - Native, born elsewhere (%)
Residents speaking English at home - Foreign born (%)
Residents speaking Spanish at home (%)
Residents speaking Spanish at home - Born in the United States (%)
Residents speaking Spanish at home - Native, born elsewhere (%)
Residents speaking Spanish at home - Foreign born (%)
Residents speaking other language at home (%)
Residents speaking other language at home - Born in the United States (%)
Residents speaking other language at home - Native, born elsewhere (%)
Residents speaking other language at home - Foreign born (%)
Class of Workers - Employee of private company (%)
Class of Workers - Self-employed in own incorporated business (%)
Class of Workers - Private not-for-profit wage and salary workers (%)
Class of Workers - Local government workers (%)
Class of Workers - State government workers (%)
Class of Workers - Federal government workers (%)
Class of Workers - Self-employed workers in own not incorporated business and Unpaid family workers (%)
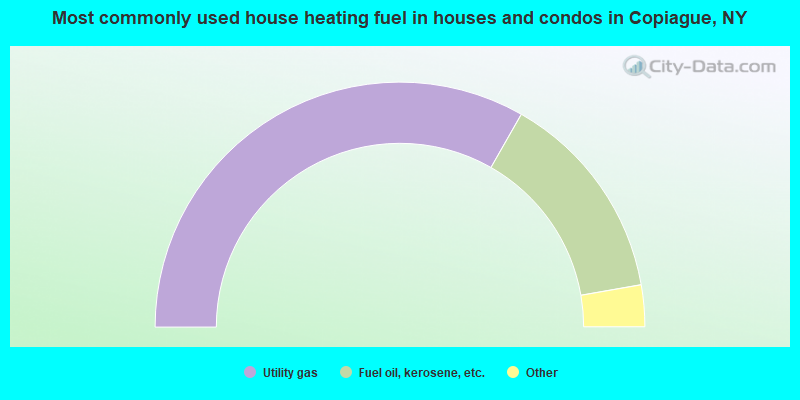
House heating fuel used in houses and condos - Utility gas (%)
House heating fuel used in houses and condos - Bottled, tank, or LP gas (%)
House heating fuel used in houses and condos - Electricity (%)
House heating fuel used in houses and condos - Fuel oil, kerosene, etc. (%)
House heating fuel used in houses and condos - Coal or coke (%)
House heating fuel used in houses and condos - Wood (%)
House heating fuel used in houses and condos - Solar energy (%)
House heating fuel used in houses and condos - Other fuel (%)
House heating fuel used in houses and condos - No fuel used (%)
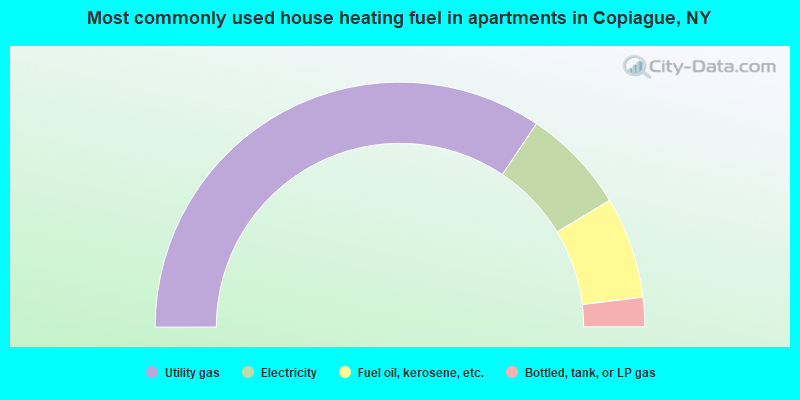
House heating fuel used in apartments - Utility gas (%)
House heating fuel used in apartments - Bottled, tank, or LP gas (%)
House heating fuel used in apartments - Electricity (%)
House heating fuel used in apartments - Fuel oil, kerosene, etc. (%)
House heating fuel used in apartments - Coal or coke (%)
House heating fuel used in apartments - Wood (%)
House heating fuel used in apartments - Solar energy (%)
House heating fuel used in apartments - Other fuel (%)
House heating fuel used in apartments - No fuel used (%)
Armed forces status - In Armed Forces (%)
Armed forces status - Civilian (%)
Armed forces status - Civilian - Veteran (%)
Armed forces status - Civilian - Nonveteran (%)
Fatal accidents locations in years 2005-2021
Fatal accidents locations in 2005
Fatal accidents locations in 2006
Fatal accidents locations in 2007
Fatal accidents locations in 2008
Fatal accidents locations in 2009
Fatal accidents locations in 2010
Fatal accidents locations in 2011
Fatal accidents locations in 2012
Fatal accidents locations in 2013
Fatal accidents locations in 2014
Fatal accidents locations in 2015
Fatal accidents locations in 2016
Fatal accidents locations in 2017
Fatal accidents locations in 2018
Fatal accidents locations in 2019
Fatal accidents locations in 2020
Fatal accidents locations in 2021
Alcohol use - People drinking some alcohol every month (%)
Alcohol use - People not drinking at all (%)
Alcohol use - Average days/month drinking alcohol
Alcohol use - Average drinks/week
Alcohol use - Average days/year people drink much
Audiometry - Average condition of hearing (%)
Audiometry - People that can hear a whisper from across a quiet room (%)
Audiometry - People that can hear normal voice from across a quiet room (%)
Audiometry - Ears ringing, roaring, buzzing (%)
Audiometry - Had a job exposure to loud noise (%)
Audiometry - Had off-work exposure to loud noise (%)
Blood Pressure & Cholesterol - Has high blood pressure (%)
Blood Pressure & Cholesterol - Checking blood pressure at home (%)
Blood Pressure & Cholesterol - Frequently checking blood cholesterol (%)
Blood Pressure & Cholesterol - Has high cholesterol level (%)
Consumer Behavior - Money monthly spent on food at supermarket/grocery store
Consumer Behavior - Money monthly spent on food at other stores
Consumer Behavior - Money monthly spent on eating out
Consumer Behavior - Money monthly spent on carryout/delivered foods
Consumer Behavior - Income spent on food at supermarket/grocery store (%)
Consumer Behavior - Income spent on food at other stores (%)
Consumer Behavior - Income spent on eating out (%)
Consumer Behavior - Income spent on carryout/delivered foods (%)
Current Health Status - General health condition (%)
Current Health Status - Blood donors (%)
Current Health Status - Has blood ever tested for HIV virus (%)
Current Health Status - Left-handed people (%)
Dermatology - People using sunscreen (%)
Diabetes - Diabetics (%)
Diabetes - Had a blood test for high blood sugar (%)
Diabetes - People taking insulin (%)
Diet Behavior & Nutrition - Diet health (%)
Diet Behavior & Nutrition - Milk product consumption (# of products/month)
Diet Behavior & Nutrition - Meals not home prepared (#/week)
Diet Behavior & Nutrition - Meals from fast food or pizza place (#/week)
Diet Behavior & Nutrition - Ready-to-eat foods (#/month)
Diet Behavior & Nutrition - Frozen meals/pizza (#/month)
Drug Use - People that ever used marijuana or hashish (%)
Drug Use - Ever used hard drugs (%)
Drug Use - Ever used any form of cocaine (%)
Drug Use - Ever used heroin (%)
Drug Use - Ever used methamphetamine (%)
Health Insurance - People covered by health insurance (%)
Kidney Conditions-Urology - Avg. # of times urinating at night
Medical Conditions - People with asthma (%)
Medical Conditions - People with anemia (%)
Medical Conditions - People with psoriasis (%)
Medical Conditions - People with overweight (%)
Medical Conditions - Elderly people having difficulties in thinking or remembering (%)
Medical Conditions - People who ever received blood transfusion (%)
Medical Conditions - People having trouble seeing even with glass/contacts (%)
Medical Conditions - People with arthritis (%)
Medical Conditions - People with gout (%)
Medical Conditions - People with congestive heart failure (%)
Medical Conditions - People with coronary heart disease (%)
Medical Conditions - People with angina pectoris (%)
Medical Conditions - People who ever had heart attack (%)
Medical Conditions - People who ever had stroke (%)
Medical Conditions - People with emphysema (%)
Medical Conditions - People with thyroid problem (%)
Medical Conditions - People with chronic bronchitis (%)
Medical Conditions - People with any liver condition (%)
Medical Conditions - People who ever had cancer or malignancy (%)
Mental Health - People who have little interest in doing things (%)
Mental Health - People feeling down, depressed, or hopeless (%)
Mental Health - People who have trouble sleeping or sleeping too much (%)
Mental Health - People feeling tired or having little energy (%)
Mental Health - People with poor appetite or overeating (%)
Mental Health - People feeling bad about themself (%)
Mental Health - People who have trouble concentrating on things (%)
Mental Health - People moving or speaking slowly or too fast (%)
Mental Health - People having thoughts they would be better off dead (%)
Oral Health - Average years since last visit a dentist
Oral Health - People embarrassed because of mouth (%)
Oral Health - People with gum disease (%)
Oral Health - General health of teeth and gums (%)
Oral Health - Average days a week using dental floss/device
Oral Health - Average days a week using mouthwash for dental problem
Oral Health - Average number of teeth
Pesticide Use - Households using pesticides to control insects (%)
Pesticide Use - Households using pesticides to kill weeds (%)
Physical Activity - People doing vigorous-intensity work activities (%)
Physical Activity - People doing moderate-intensity work activities (%)
Physical Activity - People walking or bicycling (%)
Physical Activity - People doing vigorous-intensity recreational activities (%)
Physical Activity - People doing moderate-intensity recreational activities (%)
Physical Activity - Average hours a day doing sedentary activities
Physical Activity - Average hours a day watching TV or videos
Physical Activity - Average hours a day using computer
Physical Functioning - People having limitations keeping them from working (%)
Physical Functioning - People limited in amount of work they can do (%)
Physical Functioning - People that need special equipment to walk (%)
Physical Functioning - People experiencing confusion/memory problems (%)
Physical Functioning - People requiring special healthcare equipment (%)
Prescription Medications - Average number of prescription medicines taking
Preventive Aspirin Use - Adults 40+ taking low-dose aspirin (%)
Reproductive Health - Vaginal deliveries (%)
Reproductive Health - Cesarean deliveries (%)
Reproductive Health - Deliveries resulted in a live birth (%)
Reproductive Health - Pregnancies resulted in a delivery (%)
Reproductive Health - Women breastfeeding newborns (%)
Reproductive Health - Women that had a hysterectomy (%)
Reproductive Health - Women that had both ovaries removed (%)
Reproductive Health - Women that have ever taken birth control pills (%)
Reproductive Health - Women taking birth control pills (%)
Reproductive Health - Women that have ever used Depo-Provera or injectables (%)
Reproductive Health - Women that have ever used female hormones (%)
Sexual Behavior - People 18+ that ever had sex (vaginal, anal, or oral) (%)
Sexual Behavior - Males 18+ that ever had vaginal sex with a woman (%)
Sexual Behavior - Males 18+ that ever performed oral sex on a woman (%)
Sexual Behavior - Males 18+ that ever had anal sex with a woman (%)
Sexual Behavior - Males 18+ that ever had any sex with a man (%)
Sexual Behavior - Females 18+ that ever had vaginal sex with a man (%)
Sexual Behavior - Females 18+ that ever performed oral sex on a man (%)
Sexual Behavior - Females 18+ that ever had anal sex with a man (%)
Sexual Behavior - Females 18+ that ever had any kind of sex with a woman (%)
Sexual Behavior - Average age people first had sex
Sexual Behavior - Average number of female sex partners in lifetime (males 18+)
Sexual Behavior - Average number of female vaginal sex partners in lifetime (males 18+)
Sexual Behavior - Average age people first performed oral sex on a woman (18+)
Sexual Behavior - Average number of woman performed oral sex on in lifetime (18+)
Sexual Behavior - Average number of male sex partners in lifetime (males 18+)
Sexual Behavior - Average number of male anal sex partners in lifetime (males 18+)
Sexual Behavior - Average age people first performed oral sex on a man (18+)
Sexual Behavior - Average number of male oral sex partners in lifetime (18+)
Sexual Behavior - People using protection when performing oral sex (%)
Sexual Behavior - Average number of times people have vaginal or anal sex a year
Sexual Behavior - People having sex without condom (%)
Sexual Behavior - Average number of male sex partners in lifetime (females 18+)
Sexual Behavior - Average number of male vaginal sex partners in lifetime (females 18+)
Sexual Behavior - Average number of female sex partners in lifetime (females 18+)
Sexual Behavior - Circumcised males 18+ (%)
Sleep Disorders - Average hours sleeping at night
Sleep Disorders - People that has trouble sleeping (%)
Smoking-Cigarette Use - People smoking cigarettes (%)
Taste & Smell - People 40+ having problems with smell (%)
Taste & Smell - People 40+ having problems with taste (%)
Taste & Smell - People 40+ that ever had wisdom teeth removed (%)
Taste & Smell - People 40+ that ever had tonsils teeth removed (%)
Taste & Smell - People 40+ that ever had a loss of consciousness because of a head injury (%)
Taste & Smell - People 40+ that ever had a broken nose or other serious injury to face or skull (%)
Taste & Smell - People 40+ that ever had two or more sinus infections (%)
Weight - Average height (inches)
Weight - Average weight (pounds)
Weight - Average BMI
Weight - People that are obese (%)
Weight - People that ever were obese (%)
Weight - People trying to lose weight (%)
According to our research of New York and other state lists, there were 9 registered sex offenders living in Copiague, New York as of July 02, 2024 . The ratio of all residents to sex offenders in Copiague is 2,582 to 1.The ratio of registered sex offenders to all residents in this city is much lower than the state average.
Latest news from Copiague, NY collected exclusively by city-data.com from local newspapers, TV, and radio stations
Ancestries: Italian (17.4%), Polish (6.7%), American (6.1%), Irish (4.7%), German (2.5%), Greek (1.3%).
Current Local Time:
Land area: 3.19 square miles.
Population density: 7,207 people per square mile (high).
6,750 residents are foreign born (22.1% Latin America , 5.4% Europe ).
This place:
28.8%New York:
22.6%
Median real estate property taxes paid for housing units with mortgages in 2022: $10,001 (2.1%)Median real estate property taxes paid for housing units with no mortgage in 2022: $9,738 (2.0%)
Nearest city with pop. 50,000+: Levittown, NY
Nearest city with pop. 200,000+: North Hempstead, NY
Nearest city with pop. 1,000,000+: Queens, NY
Nearest cities:
Gilgo, NY (1.6 miles),
Latitude: 40.67 N, Longitude: 73.39 W
Daytime population change due to commuting: -7,225 (-30.8%)Workers who live and work in this place: 1,743 (14.7%)
Area code commonly used in this area: 631
Unemployment in December 2023:
Most common occupations in Copiague, NY (%)
Both Males Females
Electrical equipment mechanics and other installation, maintenance, and repair workers, including supervisors (4.6%)
Other office and administrative support workers, including supervisors (4.5%)
Other sales and related occupations, including supervisors (4.4%)
Building and grounds cleaning and maintenance occupations (4.2%)
Material recording, scheduling, dispatching, and distributing workers (4.1%)
Other production occupations, including supervisors (4.0%)
Other management occupations, except farmers and farm managers (4.0%)
Electrical equipment mechanics and other installation, maintenance, and repair workers, including supervisors (8.2%)
Driver/sales workers and truck drivers (6.0%)
Building and grounds cleaning and maintenance occupations (5.8%)
Material recording, scheduling, dispatching, and distributing workers (5.6%)
Other management occupations, except farmers and farm managers (5.1%)
Other sales and related occupations, including supervisors (4.6%)
Other production occupations, including supervisors (4.2%)
Secretaries and administrative assistants (8.0%)
Other office and administrative support workers, including supervisors (6.9%)
Information and record clerks, except customer service representatives (4.5%)
Other sales and related occupations, including supervisors (4.2%)
Cashiers (3.9%)
Other production occupations, including supervisors (3.9%)
Sales representatives, services, wholesale and manufacturing (3.2%)
Tornado activity:
Copiague-area historical tornado activity is near New York state average. It is 58% smaller than the overall U.S. average.
On 9/18/1973, a category F2 (max. wind speeds 113-157 mph) tornado 3.0 miles away from the Copiague place center .
On 7/10/1989, a category F4 (max. wind speeds 207-260 mph) tornado 51.0 miles away from the place center injured 40 people and caused between $50,000,000 and $500,000,000 in damages.
Earthquake activity:
Copiague-area historical earthquake activity is significantly above New York state average. It is 71% smaller than the overall U.S. average. On 8/23/2011 at 17:51:04, a magnitude 5.8 (5.8 MW, Depth: 3.7 mi, Class: Moderate, Intensity: VI - VII) earthquake occurred 309.3 miles away from Copiague center On 10/7/1983 at 10:18:46, a magnitude 5.3 (5.1 MB, 5.3 LG, 5.1 ML) earthquake occurred 231.9 miles away from the city center On 4/20/2002 at 10:50:47, a magnitude 5.3 (5.3 ML, Depth: 3.0 mi) earthquake occurred 265.9 miles away from the city center On 1/16/1994 at 01:49:16, a magnitude 4.6 (4.6 MB, 4.6 LG, Depth: 3.1 mi, Class: Light, Intensity: IV - V) earthquake occurred 141.1 miles away from the city center On 4/20/2002 at 10:50:47, a magnitude 5.2 (5.2 MB, 4.2 MS, 5.2 MW, 5.0 MW) earthquake occurred 264.2 miles away from the city center On 8/22/1992 at 12:20:32, a magnitude 4.8 (4.8 MB, 3.8 MS, 4.7 LG, Depth: 6.2 mi) earthquake occurred 195.9 miles away from the city center Magnitude types: regional Lg-wave magnitude (LG), body-wave magnitude (MB), local magnitude (ML), surface-wave magnitude (MS), moment magnitude (MW) Natural disasters: The number of natural disasters in Suffolk County (28) is a lot greater than the US average (15).Major Disasters (Presidential) Declared: 19Emergencies Declared: 7Hurricanes: 9, Floods: 7, Storms: 7, Snowstorms: 4, Winter Storms: 3, Blizzards: 2, Heavy Rain: 1, Power Outage: 1, Tropical Depression: 1, Tropical Storm: 1, Water Shortage: 1, Other: 3 (Note: some incidents may be assigned to more than one category). Main business address for: TII NETWORK TECHNOLOGIES INC SWITCHGEAR & SWITCHBOARD APPARATUS ).
Hospitals and medical centers near Copiague: GOOD SAMARITAN HOSP. @ LINDENHURST (Dialysis Facility, about 1 miles away; LINDENHURST, NY)
FREE, INC (Hospital, about 2 miles away; LINDENHURST, NY)
SOUTH OAKS HOSP (Hospital, about 2 miles away; AMITYVILLE, NY)
BRUNSWICK HOSPITAL CENTER, INC (Hospital, about 2 miles away; AMITYVILLE, NY)
BRUNSWICK NURSING HOME (Nursing Home, about 2 miles away; AMITYVILLE, NY)
BROADLAWN MANOR NH (Nursing Home, about 2 miles away; AMITYVILLE, NY)
BROADLAWN MANOR NURSING AND REHAB CTR (Nursing Home, about 2 miles away; AMITYVILLE, NY)
Colleges/universities with over 2000 students nearest to Copiague:
Farmingdale State College (about 6 miles; Farmingdale, NY ; Full-time enrollment: 6,956)
Briarcliffe College (about 8 miles; Bethpage, NY ; FT enrollment: 2,134)
Nassau Community College (about 11 miles; Garden City, NY ; FT enrollment: 18,552)
Hofstra University (about 12 miles; Hempstead, NY ; FT enrollment: 9,429)
Molloy College (about 13 miles; Rockville Centre, NY ; FT enrollment: 3,962)
SUNY College at Old Westbury (about 13 miles; Old Westbury, NY ; FT enrollment: 4,096)
Dowling College (about 13 miles; Oakdale, NY ; FT enrollment: 2,598)
Public high school in Copiague:
Public elementary/middle schools in Copiague: COPIAGUE MIDDLE SCHOOL Students: 1,068, Location: 2650 GREAT NECK RD, Grades: 6-8)DEAUVILLE GARDENS EAST ELEMENTARY SCHOOL Students: 875, Location: 100 DEAUVILLE BLVD, Grades: KG-5)SUSAN E WILEY SCHOOL Students: 736, Location: SCUDDER AVE, Grades: KG-5)GREAT NECK ROAD ELEMENTARY SCHOOL Students: 490, Location: 1400 GREAT NECK RD, Grades: KG-5)DEAUVILLE GARDENS WEST ELEMENTARY SCHOOL Location: 100 DEAUVILLE BLVD, Grades: KG-5)
Private elementary/middle school in Copiague:
See full list of schools located in Copiague Library in Copiague: COPIAGUE MEMORIAL PUBLIC LIBRARY Operating income: $3,056,747; Location: 50 DEAUVILLE BOULEVARD; 107,537 books ; 4,703 e-books ; 7,524 audio materials ; 19,776 video materials ; 42 local licensed databases ; 14 state licensed databases ; 215 print serial subscriptions )
Birthplace of: Mike James - Professional basketball player, Chris Chetti - Professional wrestler, Hank Webb - Baseball player, James St. Robert - College basketball player (St. Francis (NY) Terriers), Shelton Jones - Basketball player.
Suffolk County has a predicted average indoor radon screening level less than 2 pCi/L (pico curies per liter) - Low Potential Average household size: This place:
3.0 peopleNew York:
2.6 people
Percentage of family households: This place:
71.6%Whole state:
63.5%
Percentage of households with unmarried partners: This place:
7.9%Whole state:
6.8%
Likely homosexual households (counted as self-reported same-sex unmarried-partner households)
Lesbian couples: 0.5% of all households Gay men: 0.5% of all households
46 people in emergency and transitional shelters (with sleeping facilities) for people experiencing homelessness in 2010people in group homes intended for adults in 2010People in group quarters in Copiague in 2000:
38 people in other noninstitutional group quarters
14 people in homes for the mentally retarded
3 people in religious group quarters
Banks with branches in Copiague (2011 data):
Bank of America, National Association: Copiague Branch at 1283 Sunrise Highway, branch established on 1970/06/06. Info updated 2009/11/18: Bank assets: $1,451,969.3 mil, Deposits: $1,077,176.8 mil, headquarters in Charlotte, NC, positive income , 5782 total offices , Holding Company: Bank Of America Corporation
JPMorgan Chase Bank, National Association: Copiague Branch at 980 Merrick Road, branch established on 1962/12/01. Info updated 2011/11/10: Bank assets: $1,811,678.0 mil, Deposits: $1,190,738.0 mil, headquarters in Columbus, OH, positive income , International Specialization, 5577 total offices , Holding Company: Jpmorgan Chase & Co.
For population 15 years and over in Copiague:
Never married: 35.7%Now married: 48.0%Separated: 2.2%Widowed: 4.4%Divorced: 9.6% For population 25 years and over in Copiague:
High school or higher: 84.6%Bachelor's degree or higher: 23.6%Graduate or professional degree: 8.8%Unemployed: 4.9%Mean travel time to work (commute): 27.9 minutes
Education Gini index (Inequality in education) Here:
12.2New York average:
13.9
Religion statistics for Copiague, NY (based on Suffolk County data)
Religion Adherents Congregations Catholic 879,457 75 Mainline Protestant 69,205 182 Evangelical Protestant 58,909 264 Other 50,771 124 Orthodox 10,190 10 Black Protestant 8,298 49 None 416,520 -
Source: Clifford Grammich, Kirk Hadaway, Richard Houseal, Dale E.Jones, Alexei Krindatch, Richie Stanley and Richard H.Taylor. 2012. 2010 U.S.Religion Census: Religious Congregations & Membership Study. Association of Statisticians of American Religious Bodies. Jones, Dale E., et al. 2002. Congregations and Membership in the United States 2000. Nashville, TN: Glenmary Research Center. Graphs represent county-level data
Food Environment Statistics: Number of grocery stores : 514Suffolk County :
3.40 / 10,000 pop.New York :
4.13 / 10,000 pop.
Number of supercenters and club stores : 9Suffolk County :
0.06 / 10,000 pop.New York :
0.06 / 10,000 pop.
Number of convenience stores (no gas) : 217Suffolk County :
1.44 / 10,000 pop.New York :
0.92 / 10,000 pop.
Number of convenience stores (with gas) : 256Suffolk County :
1.69 / 10,000 pop.New York :
1.68 / 10,000 pop.
Number of full-service restaurants : 1,232Suffolk County :
8.15 / 10,000 pop.State :
8.82 / 10,000 pop.
Adult diabetes rate : Suffolk County :
8.1%State :
8.2%
Adult obesity rate : Suffolk County :
23.4%New York :
23.8%
Low-income preschool obesity rate : Suffolk County :
22.3%New York :
15.6%
Health and Nutrition:
Average overall health of teeth and gums : Copiague:
45.1%New York:
48.1%
People feeling badly about themselves : People not drinking alcohol at all : Average hours sleeping at night : General health condition : Copiague:
54.8%New York:
56.5%
Average condition of hearing : Copiague:
79.0%State:
80.2%
More about Health and Nutrition of Copiague, NY Residents
4.14% of this county's 2021 resident taxpayers lived in other counties in 2020 ($206,656 average adjusted gross income )
Here:
4.14%New York average:
5.29%
0.01% of residents moved from foreign countries ($74 average AGI )Suffolk County:
0.01%New York average:
0.01%
Top counties from which taxpayers relocated into this county between 2020 and 2021:
4.28% of this county's 2020 resident taxpayers moved to other counties in 2021 ($141,172 average adjusted gross income )
Here:
4.28%New York average:
6.93%
0.01% of residents moved to foreign countries ($169 average AGI )Suffolk County:
0.01%New York average:
0.02%
Top counties to which taxpayers relocated from this county between 2020 and 2021:
Businesses in Copiague, NY
Name Count Name Count
7-Eleven 1 Papa John's Pizza 1 Bally Total Fitness 1 RadioShack 1 Baskin-Robbins 1 Red Lobster 1 CVS 1 Rite Aid 1 Dunkin Donuts 1 Sprint Nextel 1 FedEx 3 T-Mobile 2 GNC 1 Target 1 Home Depot 1 U-Haul 1 KFC 1 UPS 1 LA Fitness 1 Wendy's 2
Strongest AM radio stations in Copiague:
WGSM (740 AM; 25 kW; HUNTINGTON, NY; Owner: K RADIO LICENSEE, INC.)
WFAN (660 AM; 50 kW; NEW YORK, NY; Owner: INFINITY BROADCASTING OPERATIONS, INC.)
WCBS (880 AM; 50 kW; NEW YORK, NY; Owner: INFINITY BROADCASTING OPERATIONS, INC.)
WNYG (1440 AM; 1 kW; BABYLON, NY; Owner: MULTICULTURAL RADIO BROADCASTING, INC.)
WHLI (1100 AM; daytime; 10 kW; HEMPSTEAD, NY)
WMCA (570 AM; 50 kW; NEW YORK, NY; Owner: SALEM MEDIA OF NEW YORK, LLC)
WOR (710 AM; 50 kW; NEW YORK, NY; Owner: BUCKLEY BROADCASTING CORPORATION)
WABC (770 AM; 50 kW; NEW YORK, NY; Owner: WABC-AM RADIO, INC.)
WQEW (1560 AM; 50 kW; NEW YORK, NY; Owner: THE NEW YORK TIMES ELECTRONIC MEDIA COMPANY)
WLIE (540 AM; 2 kW; ISLIP, NY; Owner: LONG ISLAND MULTIMEDIA, LLC.)
WBBR (1130 AM; 50 kW; NEW YORK, NY; Owner: BLOOMBERG COMMUNICATIONS INC.)
WEPN (1050 AM; 50 kW; NEW YORK, NY; Owner: NEW YORK AM RADIO, LLC)
WINS (1010 AM; 50 kW; NEW YORK, NY; Owner: INFINITY BROADCASTING OPERATIONS, INC.)
Strongest FM radio stations in Copiague:
W217AF (91.3 FM; HUNTINGTON STATION, NY; Owner: SACRED HEART UNIVERSITY, INC.)
WMJC (94.3 FM; SMITHTOWN, NY; Owner: IW LIMITED LIABILITY COMPANY)
WBZO (103.1 FM; BAY SHORE, NY; Owner: MID-ISLAND BROADCASTING LIMITED PARTNERSHIP)
WALK-FM (97.5 FM; PATCHOGUE, NY; Owner: AMFM RADIO LICENSES, L.L.C.)
WKCR-FM (89.9 FM; NEW YORK, NY; Owner: TRUSTEES OF COLUMBIA UNIVERSITY IN NEW YORK)
WQCD (101.9 FM; NEW YORK, NY; Owner: EMMIS RADIO LICENSE CORPORATION)
WKTU (103.5 FM; LAKE SUCCESS, NY; Owner: AMFM RADIO LICENSES, LLC)
WBAB (102.3 FM; BABYLON, NY; Owner: CXR HOLDINGS, INC.)
WNYC-FM (93.9 FM; NEW YORK, NY; Owner: WNYC RADIO)
WCAA (105.9 FM; NEWARK, NJ; Owner: WADO-AM LICENSE CORP. ("WADO"))
WBAI (99.5 FM; NEW YORK, NY; Owner: PACIFICA FOUNDATION, INC.)
WBLS (107.5 FM; NEW YORK, NY; Owner: ICBC BROADCAST HOLDINGS-NY, INC.)
WLTW (106.7 FM; NEW YORK, NY; Owner: AMFM NEW YORK LICENSES, LLC)
WQXR-FM (96.3 FM; NEW YORK, NY; Owner: THE NEW YORK TIMES ELECTRONIC MEDIA COMPANY)
WSKQ-FM (97.9 FM; NEW YORK, NY; Owner: WSKQ LICENSING, INC.)
WXRK (92.3 FM; NEW YORK, NY; Owner: INFINITY BROADCASTING OPERATIONS, INC.)
WPAT-FM (93.1 FM; PATERSON, NJ; Owner: WPAT LICENSING, INC.)
WAXQ (104.3 FM; NEW YORK, NY; Owner: AMFM NEW YORK LICENSES, LLC)
WHTZ (100.3 FM; NEWARK, NJ; Owner: AMFM RADIO LICENSES, L.L.C.)
WWPR-FM (105.1 FM; NEW YORK, NY; Owner: AMFM RADIO LICENSES, L.L.C.)
TV broadcast stations around Copiague:
WNYW (Channel 5; NEW YORK, NY; Owner: FOX TELEVISION STATIONS, INC.)
WCBS-TV (Channel 2; NEW YORK, NY; Owner: CBS BROADCASTING INC.)
WABC-TV (Channel 7; NEW YORK, NY; Owner: AMERICAN BROADCASTING COMPANIES, INC)
WPIX (Channel 11; NEW YORK, NY; Owner: WPIX, INC.)
WWOR-TV (Channel 9; SECAUCUS, NJ; Owner: FOX TELEVISION STATIONS, INC.)
WLIW (Channel 21; GARDEN CITY, NY; Owner: EDUCATIONAL BROADCASTING CORPORATION)
WXNY-LP (Channel 32; NEW YORK, NY; Owner: ISLAND BROADCASTING COMPANY)
WNJU (Channel 47; LINDEN, NJ; Owner: WNJU LICENSE CORPORATION)
WPXN-TV (Channel 31; NEW YORK, NY; Owner: PAXSON COMMUNICATIONS LICENSE COMPANY, LLC)
WFUT (Channel 68; NEWARK, NJ; Owner: UNIVISION NEW YORK LLC)
WNBC (Channel 4; NEW YORK, NY; Owner: NATIONAL BROADCASTING COMPANY, INC.)
WNET (Channel 13; NEWARK, NJ; Owner: EDUCATIONAL BROADCASTING CORPORATION)
WXTV (Channel 41; PATERSON, NJ; Owner: WXTV LICENSE PARTNERSHIP, G.P.)
WNYE-TV (Channel 25; NEW YORK, NY; Owner: NEW YORK CITY BOARD OF EDUCATION)
WKOB-LP (Channel 53; NEW YORK, NY; Owner: WKOB COMMUNICATIONS, INC.)
WEBR-CA (Channel 17; MANHATTAN, NY; Owner: K LICENSEE INC.)
WRNN-LP (Channel 57; NYACK, NY; Owner: LP NYACK LIMITED PARTNERSHIP)
W60AI (Channel 60; NEW YORK, NY; Owner: VENTANA TELEVISION, INC.)
W27CB (Channel 27; HEMPSTEAD, NY; Owner: K LICENSEE INC.)
WPXU-LP (Channel 38; AMITYVILLE, NY; Owner: PAXSON COMMUNICATIONS LPTV, INC.)
WLIG-LP (Channel 54; MINEOLA, NY; Owner: WLNY-TV, INC.)
WFTY (Channel 67; SMITHTOWN, NY; Owner: UNIVISION NEW YORK LLC)
WNYX-LP (Channel 35; NEW YORK, NY; Owner: ISLAND BROADCASTING COMPANY)
W33BS (Channel 33; DARIEN, CT; Owner: CT&T BROADCASTING, INC.)
WNYN-LP (Channel 39; NEW YORK, NY; Owner: ISLAND BROADCASTING COMPANY)
National Bridge Inventory (NBI) Statistics 7 Number of bridges33ft / 9.9m Total length $10,360,000 Total costs77,742 Total average daily traffic718 Total average daily truck traffic
FCC Registered Cell Phone Towers: 1 (
See the full list of FCC Registered Cell Phone Towers in Copiague )
FCC Registered Antenna Towers: 15 (
See the full list of FCC Registered Antenna Towers )
FCC Registered Broadcast Land Mobile Towers: 5
1 Holmes Pl (Lat: 40.679278 Lon: -73.405667), Call Sign: KEE717, Assigned Frequencies: 152.270 MHz, Grant Date: 10/30/1995, Expiration Date: 12/04/2000, Cancellation Date: 02/04/2001, Registrant: F E Smith Family Taxi Services Of Amityville, 1 Holmes Place, Copiague, NY 11726, Phone: (516) 264-0900 2650 Great Neck Road (Lat: 40.670944 Lon: -73.419000), Call Sign: WPSS626, Assigned Frequencies: 461.987 MHz, 466.987 MHz, Grant Date: 07/24/2001, Expiration Date: 07/24/2011, Cancellation Date: 09/24/2011, Certifier: Philip A Bock, Registrant: Federal Licensing Inc, 1588 Fairfield Road, Gettysburg, PA 17325, Phone: (717) 334-9262, Fax: (717) 334-6440 Lat: 40.681528 Lon: -73.397861, Call Sign: WPUS465, Assigned Frequencies: 159.930 MHz, Grant Date: 04/23/2002, Expiration Date: 04/23/2012, Cancellation Date: 06/23/2012, Certifier: Yadolla Mahmoodzadeh, Registrant: Telmobile Inc, 271 Central Ave, Bethpage, NY 11714, Phone: (516) 938-4625, Fax: (516) 938-463335-COPIAGUE, Mta Rail Station - Copiague (Lat: 40.680833 Lon: -73.398889), Type: Bant, Structure height: 15.3 m, Call Sign: WQED391, Assigned Frequencies: 851.037 MHz, 851.537 MHz, 852.037 MHz, 852.537 MHz, 853.037 MHz, Grant Date: 12/30/2005, Expiration Date: 12/30/2015, Cancellation Date: 01/14/2011, Certifier: Thomas J Cowper, Registrant: Nys Dhses Office Of Interoperable And Emergency Communications, State Office Campus Building 22, 1220 Washington Ave, Albany, NY 12226, Phone: (518) 322-4912, Fax: (518) 322-4975, Email:
Lat: 40.671389 Lon: -73.394167, Call Sign: WQMK602, Assigned Frequencies: 460.487 MHz, Grant Date: 08/25/2020, Expiration Date: 09/03/2030, Certifier: Angelo Licata, Registrant: Copiague Fire District, 320 Great Neck Road, Copiague, NY 11726-3805, Phone: (631) 464-4690, Fax: (631) 842-1408, Email:
FCC Registered Microwave Towers: 2
GARFIELD AND LAMBERT, 767 Chettic Avenue (Lat: 40.680500 Lon: -73.390139), Type: Pole, Structure height: 36.6 m, Overall height: 38.4 m, Call Sign: WQJT444, Assigned Frequencies: 11305.0 MHz, Grant Date: 12/23/2008, Expiration Date: 02/01/2018, Cancellation Date: 07/17/2009, Certifier: James J.R. Talbot, Registrant: At&t Corp., 2315 Salem Road, First Floor, H9, Conyers, GA 30013, Phone: (770) 602-2065, Fax: (770) 929-4454, Email:
LI13181B, Tanner Park / Jervis Ave (Lat: 40.657778 Lon: -73.395000), Type: Pole, Structure height: 36.6 m, Call Sign: WQPP428, Assigned Frequencies: 10735.0 MHz, 10855.0 MHz, 10975.0 MHz, 11055.0 MHz, 10735.0 MHz, 10855.0 MHz, 10975.0 MHz, 11055.0 MHz, 10735.0 MHz, 10855.0 MHz... (+30 more), Grant Date: 09/06/2022, Expiration Date: 07/12/2032, Certifier: Dan Menser, Registrant: T-Mobile License LLC, 12920 Se 38th St, Bellevue, WA 98006, Phone: (425) 383-8401, Fax: (425) 383-4040, Email:
FCC Registered Amateur Radio Licenses: 40 (
See the full list of FCC Registered Amateur Radio Licenses in Copiague )
FAA Registered Aircraft Manufacturers and Dealers: 1
NORMAN AVIATION INC, 14 Marlin Dr, Copiague, NY 11726Certificate: D004855 (Corporation), Certificate Issue Date: 11/02/2011, Expiration Date: 11/01/2012 FAA Registered Aircraft: 2
Aircraft: PIPER PA-31-350 (Category: Land, Engines: 2, Seats: 8, Weight: Up to 12,499 Pounds, Speed: 162 mph), Engine: LYCOMING TI0-540 SER (310 HP) (Reciprocating)N-Number: 33MV, N33MV, N-33MV, Serial Number: 31-8252035, Year manufactured: 1982, Airworthiness Date: 03/05/1982, Certificate Issue Date: 02/26/2015Registrant (Corporation): Jna Skyways Inc, 115 Garden St, Copiague, NY 11726Aircraft: CARLEY SONEX (Category: Land, Seats: 2, Weight: Up to 12,499 Pounds), Engine: 4 CycleN-Number: 965SX, N965SX, N-965SX, Serial Number: 0965, Certificate Issue Date: 09/28/2009Registrant (Individual): Edmond G Carley, 305 East Dr, Copiague, NY 11726Deregistered: Cancel Date: 10/23/2018
Home Mortgage Disclosure Act Aggregated Statistics For Year 2009(Based on 4 full tracts) A) FHA, FSA/RHS & VA B) Conventional C) Refinancings D) Home Improvement Loans F) Non-occupant Loans on Number Average Value Number Average Value Number Average Value Number Average Value Number Average Value
LOANS ORIGINATED 52 $288,731 80 $239,975 168 $233,530 16 $94,688 8 $190,000 APPLICATIONS APPROVED, NOT ACCEPTED 9 $257,111 8 $246,875 26 $279,500 7 $156,000 2 $196,000 APPLICATIONS DENIED 11 $279,636 16 $251,312 131 $272,588 18 $45,500 9 $229,000 APPLICATIONS WITHDRAWN 15 $285,533 16 $196,938 82 $254,049 5 $216,400 2 $191,500 FILES CLOSED FOR INCOMPLETENESS 6 $315,000 4 $232,750 22 $292,909 2 $83,500 1 $203,000
Aggregated Statistics For Year 2008(Based on 4 full tracts) A) FHA, FSA/RHS & VA B) Conventional C) Refinancings D) Home Improvement Loans E) Loans on Dwellings For 5+ Families F) Non-occupant Loans on Number Average Value Number Average Value Number Average Value Number Average Value Number Average Value Number Average Value
LOANS ORIGINATED 41 $298,439 107 $274,720 127 $245,827 30 $105,867 1 $30,000,000 12 $232,417 APPLICATIONS APPROVED, NOT ACCEPTED 2 $267,500 16 $228,750 44 $267,773 12 $70,500 0 $0 3 $312,667 APPLICATIONS DENIED 10 $346,200 34 $327,500 165 $283,867 57 $80,456 0 $0 10 $194,300 APPLICATIONS WITHDRAWN 12 $311,083 20 $290,650 64 $285,578 4 $298,000 2 $11,450,000 3 $318,667 FILES CLOSED FOR INCOMPLETENESS 0 $0 7 $409,571 20 $277,750 3 $85,000 0 $0 2 $258,500
Aggregated Statistics For Year 2007(Based on 4 full tracts) A) FHA, FSA/RHS & VA B) Conventional C) Refinancings D) Home Improvement Loans E) Loans on Dwellings For 5+ Families F) Non-occupant Loans on G) Loans On Manufactured Number Average Value Number Average Value Number Average Value Number Average Value Number Average Value Number Average Value Number Average Value
LOANS ORIGINATED 4 $261,250 236 $259,703 354 $250,339 68 $106,221 1 $6,000 27 $247,815 0 $0 APPLICATIONS APPROVED, NOT ACCEPTED 0 $0 60 $264,883 102 $255,794 14 $78,357 0 $0 5 $261,000 1 $82,000 APPLICATIONS DENIED 1 $347,000 121 $291,264 333 $285,991 64 $105,469 0 $0 20 $322,500 0 $0 APPLICATIONS WITHDRAWN 2 $282,500 49 $279,245 131 $247,298 9 $129,111 0 $0 8 $280,875 0 $0 FILES CLOSED FOR INCOMPLETENESS 0 $0 15 $292,400 42 $286,119 2 $190,000 0 $0 1 $368,000 0 $0
Aggregated Statistics For Year 2006(Based on 4 full tracts) A) FHA, FSA/RHS & VA B) Conventional C) Refinancings D) Home Improvement Loans F) Non-occupant Loans on G) Loans On Manufactured Number Average Value Number Average Value Number Average Value Number Average Value Number Average Value Number Average Value
LOANS ORIGINATED 3 $330,667 531 $229,000 489 $243,431 81 $138,000 47 $276,191 0 $0 APPLICATIONS APPROVED, NOT ACCEPTED 0 $0 79 $224,658 122 $227,016 31 $99,290 8 $276,000 0 $0 APPLICATIONS DENIED 1 $355,000 176 $236,278 290 $262,528 79 $120,557 14 $387,214 0 $0 APPLICATIONS WITHDRAWN 1 $365,000 85 $240,035 244 $232,057 14 $129,357 13 $245,077 0 $0 FILES CLOSED FOR INCOMPLETENESS 0 $0 18 $212,833 60 $282,683 4 $101,250 2 $359,500 2 $342,000
Aggregated Statistics For Year 2005(Based on 4 full tracts) A) FHA, FSA/RHS & VA B) Conventional C) Refinancings D) Home Improvement Loans E) Loans on Dwellings For 5+ Families F) Non-occupant Loans on G) Loans On Manufactured Number Average Value Number Average Value Number Average Value Number Average Value Number Average Value Number Average Value Number Average Value
LOANS ORIGINATED 3 $301,000 464 $227,688 561 $230,196 97 $132,546 1 $4,800,000 63 $238,190 1 $28,000 APPLICATIONS APPROVED, NOT ACCEPTED 0 $0 55 $206,564 113 $219,593 19 $68,211 0 $0 6 $221,833 0 $0 APPLICATIONS DENIED 1 $284,000 144 $237,465 264 $242,307 72 $107,042 0 $0 27 $250,222 1 $240,000 APPLICATIONS WITHDRAWN 1 $296,000 142 $234,232 217 $225,654 38 $152,474 0 $0 26 $216,038 1 $200,000 FILES CLOSED FOR INCOMPLETENESS 0 $0 27 $194,000 187 $239,813 11 $104,545 0 $0 5 $230,000 0 $0
Aggregated Statistics For Year 2004(Based on 4 full tracts) A) FHA, FSA/RHS & VA B) Conventional C) Refinancings D) Home Improvement Loans E) Loans on Dwellings For 5+ Families F) Non-occupant Loans on G) Loans On Manufactured Number Average Value Number Average Value Number Average Value Number Average Value Number Average Value Number Average Value Number Average Value
LOANS ORIGINATED 9 $268,667 333 $246,817 637 $198,542 100 $117,100 2 $2,500,000 59 $208,000 1 $10,000 APPLICATIONS APPROVED, NOT ACCEPTED 1 $278,000 61 $232,902 114 $213,158 23 $117,870 0 $0 12 $221,417 0 $0 APPLICATIONS DENIED 3 $268,667 83 $265,386 285 $222,140 78 $96,346 0 $0 28 $214,714 0 $0 APPLICATIONS WITHDRAWN 2 $285,500 63 $222,111 244 $197,090 22 $139,182 1 $1,500,000 9 $212,667 0 $0 FILES CLOSED FOR INCOMPLETENESS 1 $330,000 15 $288,600 133 $231,211 8 $74,750 0 $0 2 $223,500 0 $0
Aggregated Statistics For Year 2003(Based on 4 full tracts) A) FHA, FSA/RHS & VA B) Conventional C) Refinancings D) Home Improvement Loans E) Loans on Dwellings For 5+ Families F) Non-occupant Loans on Number Average Value Number Average Value Number Average Value Number Average Value Number Average Value Number Average Value
LOANS ORIGINATED 30 $232,167 317 $223,457 1,071 $169,872 33 $42,939 2 $2,675,000 50 $177,020 APPLICATIONS APPROVED, NOT ACCEPTED 1 $179,000 40 $226,575 192 $167,656 23 $38,000 0 $0 12 $216,917 APPLICATIONS DENIED 4 $275,750 59 $203,085 364 $176,580 64 $45,844 0 $0 34 $176,265 APPLICATIONS WITHDRAWN 7 $193,000 39 $232,590 343 $178,140 26 $48,115 0 $0 7 $134,286 FILES CLOSED FOR INCOMPLETENESS 1 $202,000 12 $262,667 64 $207,062 2 $54,500 0 $0 5 $149,400
Aggregated Statistics For Year 2002(Based on 4 full tracts) A) FHA, FSA/RHS & VA B) Conventional C) Refinancings D) Home Improvement Loans E) Loans on Dwellings For 5+ Families F) Non-occupant Loans on Number Average Value Number Average Value Number Average Value Number Average Value Number Average Value Number Average Value
LOANS ORIGINATED 36 $195,750 301 $192,967 749 $150,164 77 $44,831 1 $151,000 58 $162,086 APPLICATIONS APPROVED, NOT ACCEPTED 3 $179,667 46 $162,891 155 $134,342 24 $52,125 0 $0 9 $167,778 APPLICATIONS DENIED 7 $194,286 57 $189,175 265 $142,630 73 $33,918 0 $0 19 $159,947 APPLICATIONS WITHDRAWN 8 $205,500 50 $179,920 257 $151,451 36 $45,333 0 $0 5 $152,000 FILES CLOSED FOR INCOMPLETENESS 1 $181,000 16 $193,250 64 $135,766 3 $95,000 0 $0 7 $141,714
Aggregated Statistics For Year 2001(Based on 4 full tracts) A) FHA, FSA/RHS & VA B) Conventional C) Refinancings D) Home Improvement Loans F) Non-occupant Loans on Number Average Value Number Average Value Number Average Value Number Average Value Number Average Value
LOANS ORIGINATED 57 $173,719 199 $162,322 556 $132,701 62 $40,516 30 $126,400 APPLICATIONS APPROVED, NOT ACCEPTED 4 $147,750 30 $160,800 129 $117,233 16 $30,062 3 $137,667 APPLICATIONS DENIED 9 $181,556 41 $174,293 220 $116,855 70 $30,743 9 $98,778 APPLICATIONS WITHDRAWN 15 $190,667 24 $191,833 236 $116,572 38 $36,763 5 $121,600 FILES CLOSED FOR INCOMPLETENESS 1 $202,000 6 $156,667 48 $109,792 2 $162,500 2 $82,500
Aggregated Statistics For Year 2000(Based on 4 full tracts) A) FHA, FSA/RHS & VA B) Conventional C) Refinancings D) Home Improvement Loans F) Non-occupant Loans on Number Average Value Number Average Value Number Average Value Number Average Value Number Average Value
LOANS ORIGINATED 65 $151,615 206 $141,806 178 $103,927 65 $23,985 22 $108,227 APPLICATIONS APPROVED, NOT ACCEPTED 2 $155,000 29 $137,069 53 $102,094 36 $29,528 4 $111,750 APPLICATIONS DENIED 15 $156,667 72 $145,056 202 $103,743 75 $41,800 17 $135,412 APPLICATIONS WITHDRAWN 19 $156,263 23 $114,957 198 $83,995 14 $52,643 6 $87,500 FILES CLOSED FOR INCOMPLETENESS 2 $175,500 5 $135,800 35 $130,686 3 $71,000 0 $0
Aggregated Statistics For Year 1999(Based on 3 full and 1 partial tracts) A) FHA, FSA/RHS & VA B) Conventional C) Refinancings D) Home Improvement Loans E) Loans on Dwellings For 5+ Families F) Non-occupant Loans on Number Average Value Number Average Value Number Average Value Number Average Value Number Average Value Number Average Value
LOANS ORIGINATED 89 $139,951 211 $129,157 262 $106,094 73 $22,838 1 $33,710 25 $105,288 APPLICATIONS APPROVED, NOT ACCEPTED 3 $150,483 31 $130,811 110 $102,922 34 $26,332 0 $0 9 $103,808 APPLICATIONS DENIED 7 $131,309 73 $126,028 181 $91,781 68 $26,548 0 $0 21 $129,837 APPLICATIONS WITHDRAWN 15 $140,576 38 $113,267 180 $90,485 12 $44,156 0 $0 7 $110,197 FILES CLOSED FOR INCOMPLETENESS 3 $121,270 10 $140,018 35 $111,121 1 $49,770 0 $0 1 $82,610
Detailed HMDA statistics for the following Tracts:
1237.01
, 1237.02 , 1238.01 , 1238.02
Private Mortgage Insurance Companies Aggregated Statistics For Year 2009(Based on 4 full tracts) A) Conventional B) Refinancings C) Non-occupant Loans on Number Average Value Number Average Value Number Average Value
LOANS ORIGINATED 12 $270,667 2 $237,000 0 $0 APPLICATIONS APPROVED, NOT ACCEPTED 6 $278,500 2 $309,000 0 $0 APPLICATIONS DENIED 5 $261,800 4 $322,000 1 $280,000 APPLICATIONS WITHDRAWN 1 $191,000 2 $303,500 0 $0 FILES CLOSED FOR INCOMPLETENESS 1 $394,000 1 $236,000 0 $0
Aggregated Statistics For Year 2008(Based on 4 full tracts) A) Conventional B) Refinancings C) Non-occupant Loans on Number Average Value Number Average Value Number Average Value
LOANS ORIGINATED 37 $317,324 12 $369,083 0 $0 APPLICATIONS APPROVED, NOT ACCEPTED 32 $341,375 22 $369,545 1 $192,000 APPLICATIONS DENIED 5 $318,600 7 $375,143 2 $385,000 APPLICATIONS WITHDRAWN 3 $343,667 2 $311,500 0 $0 FILES CLOSED FOR INCOMPLETENESS 1 $328,000 3 $468,667 0 $0
Aggregated Statistics For Year 2007(Based on 4 full tracts) A) Conventional B) Refinancings C) Non-occupant Loans on D) Loans On Manufactured Number Average Value Number Average Value Number Average Value Number Average Value
LOANS ORIGINATED 64 $324,688 24 $356,500 3 $268,667 1 $225,000 APPLICATIONS APPROVED, NOT ACCEPTED 15 $333,733 11 $376,545 4 $345,250 0 $0 APPLICATIONS DENIED 1 $391,000 2 $379,000 0 $0 0 $0 APPLICATIONS WITHDRAWN 4 $331,250 3 $395,667 0 $0 0 $0 FILES CLOSED FOR INCOMPLETENESS 0 $0 1 $563,000 0 $0 0 $0
Aggregated Statistics For Year 2006(Based on 4 full tracts) A) Conventional B) Refinancings C) Non-occupant Loans on D) Loans On Manufactured Number Average Value Number Average Value Number Average Value Number Average Value
LOANS ORIGINATED 37 $340,892 12 $338,750 2 $238,500 0 $0 APPLICATIONS APPROVED, NOT ACCEPTED 6 $344,500 1 $306,000 0 $0 1 $370,000 APPLICATIONS DENIED 0 $0 0 $0 0 $0 0 $0 APPLICATIONS WITHDRAWN 3 $354,333 2 $315,500 0 $0 0 $0 FILES CLOSED FOR INCOMPLETENESS 1 $410,000 1 $351,000 0 $0 0 $0
Aggregated Statistics For Year 2005(Based on 4 full tracts) A) Conventional B) Refinancings C) Non-occupant Loans on Number Average Value Number Average Value Number Average Value
LOANS ORIGINATED 43 $310,465 5 $316,600 0 $0 APPLICATIONS APPROVED, NOT ACCEPTED 11 $324,091 7 $272,714 1 $86,000 APPLICATIONS DENIED 3 $432,000 0 $0 0 $0 APPLICATIONS WITHDRAWN 6 $276,500 0 $0 1 $270,000 FILES CLOSED FOR INCOMPLETENESS 2 $296,500 0 $0 0 $0
Aggregated Statistics For Year 2004(Based on 4 full tracts) A) Conventional B) Refinancings C) Non-occupant Loans on Number Average Value Number Average Value Number Average Value
LOANS ORIGINATED 87 $283,356 14 $250,000 3 $266,333 APPLICATIONS APPROVED, NOT ACCEPTED 23 $265,957 5 $247,000 1 $284,000 APPLICATIONS DENIED 2 $247,000 0 $0 0 $0 APPLICATIONS WITHDRAWN 4 $225,500 1 $298,000 0 $0 FILES CLOSED FOR INCOMPLETENESS 0 $0 0 $0 0 $0
Aggregated Statistics For Year 2003(Based on 4 full tracts) A) Conventional B) Refinancings C) Non-occupant Loans on Number Average Value Number Average Value Number Average Value
LOANS ORIGINATED 134 $240,851 30 $234,833 0 $0 APPLICATIONS APPROVED, NOT ACCEPTED 32 $230,312 11 $217,182 2 $202,500 APPLICATIONS DENIED 2 $250,000 1 $244,000 0 $0 APPLICATIONS WITHDRAWN 16 $252,562 3 $219,333 3 $234,667 FILES CLOSED FOR INCOMPLETENESS 0 $0 0 $0 0 $0
Aggregated Statistics For Year 2002(Based on 4 full tracts) A) Conventional B) Refinancings C) Non-occupant Loans on Number Average Value Number Average Value Number Average Value
LOANS ORIGINATED 127 $204,630 38 $185,158 6 $189,167 APPLICATIONS APPROVED, NOT ACCEPTED 44 $194,114 9 $182,333 1 $275,000 APPLICATIONS DENIED 10 $199,500 1 $157,000 1 $266,000 APPLICATIONS WITHDRAWN 8 $181,500 3 $180,667 1 $165,000 FILES CLOSED FOR INCOMPLETENESS 0 $0 1 $236,000 0 $0
Aggregated Statistics For Year 2001(Based on 4 full tracts) A) Conventional B) Refinancings C) Non-occupant Loans on Number Average Value Number Average Value Number Average Value
LOANS ORIGINATED 106 $174,509 33 $169,485 7 $139,857 APPLICATIONS APPROVED, NOT ACCEPTED 35 $165,171 11 $159,818 7 $140,571 APPLICATIONS DENIED 2 $168,000 5 $170,400 1 $113,000 APPLICATIONS WITHDRAWN 3 $162,667 1 $138,000 1 $158,000 FILES CLOSED FOR INCOMPLETENESS 1 $175,000 0 $0 0 $0
Aggregated Statistics For Year 2000(Based on 4 full tracts) A) Conventional B) Refinancings C) Non-occupant Loans on Number Average Value Number Average Value Number Average Value
LOANS ORIGINATED 93 $151,935 13 $146,385 4 $110,250 APPLICATIONS APPROVED, NOT ACCEPTED 16 $157,875 9 $142,444 1 $158,000 APPLICATIONS DENIED 4 $139,250 1 $164,000 1 $97,000 APPLICATIONS WITHDRAWN 5 $155,600 0 $0 0 $0 FILES CLOSED FOR INCOMPLETENESS 0 $0 0 $0 0 $0
Aggregated Statistics For Year 1999(Based on 3 full and 1 partial tracts) A) Conventional B) Refinancings C) Non-occupant Loans on Number Average Value Number Average Value Number Average Value
LOANS ORIGINATED 89 $140,058 20 $153,680 1 $118,500 APPLICATIONS APPROVED, NOT ACCEPTED 7 $125,623 11 $130,936 0 $0 APPLICATIONS DENIED 7 $131,479 1 $126,170 0 $0 APPLICATIONS WITHDRAWN 6 $115,157 0 $0 1 $61,530 FILES CLOSED FOR INCOMPLETENESS 0 $0 1 $144,470 0 $0
Detailed PMIC statistics for the following Tracts:
1237.01
, 1237.02 , 1238.01 , 1238.02
Most common first names in Copiague, NY among deceased individuals Name Count Lived (average)
John 149 70.4 years Mary 113 79.7 years Joseph 104 72.0 years Frank 83 75.8 years William 82 70.7 years Anna 69 80.8 years Charles 63 74.1 years Rose 50 80.7 years Robert 48 69.2 years Margaret 47 78.1 years
Most common last names in Copiague, NY among deceased individuals Last name Count Lived (average)
Smith 29 68.6 years Brown 15 73.2 years Johnson 15 68.6 years Jackson 15 66.5 years Williams 11 74.3 years Russo 11 76.5 years Rodriguez 10 76.6 years Phillips 9 78.7 years Davis 9 76.1 years Harris 8 75.1 years
Copiague compared to New York state average:
Unemployed percentage significantly below state average. Black race population percentage below state average. Hispanic race population percentage above state average. Renting percentage below state average. Length of stay since moving in above state average.
#18 on the list of "Top 101 cities with the most residents born in Dominican Republic (population 500+)"
#33 on the list of "Top 101 cities with the most residents born in Poland (population 500+)"
#51 on the list of "Top 101 cities with the most residents born in Barbados (population 500+)"
#3 on the list of "Top 101 counties with the most Catholic adherents"
#6 on the list of "Top 101 counties with the lowest percentage of residents relocating from other counties between 2010 and 2011"
#7 on the list of "Top 101 counties with the lowest surface withdrawal of fresh water for public supply (pop. 50,000+)"
#9 on the list of "Top 101 counties with the lowest percentage of residents relocating to other counties in 2011"
#19 on the list of "Top 101 counties with the highest ground withdrawal of fresh water for public supply (pop. 50,000+)"
Top Patent Applicants
John Smith (1)
Michelle Ryan (1)
Craig Geiger (1)
Allan Katz (1)
Ruth B. Jones (1)
Isaak Zaritskiy (1)
Scott A. Jones (1)
Total of 6 patent applications in 2008-2024.


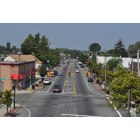

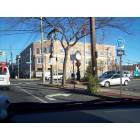
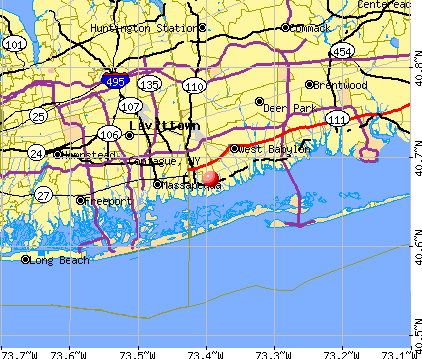


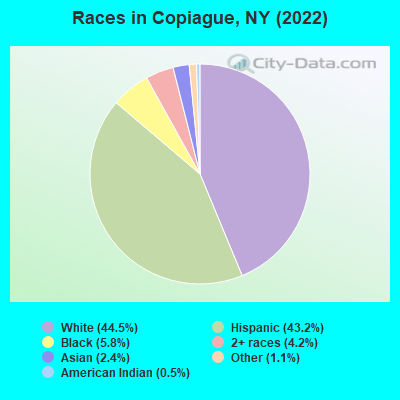
 Recent articles from our blog. Our writers, many of them Ph.D. graduates or candidates, create easy-to-read articles on a wide variety of topics.

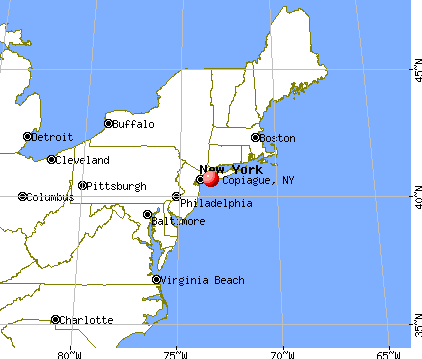
 (7.1 miles
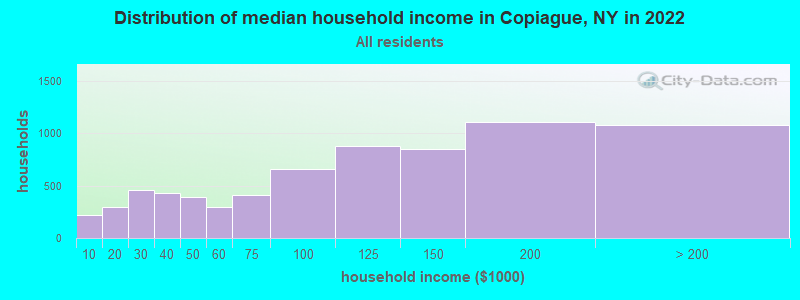
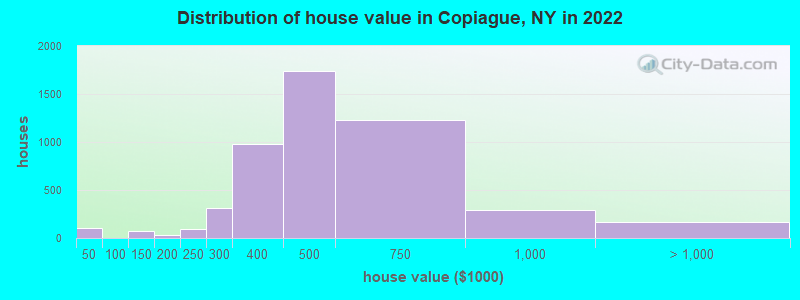
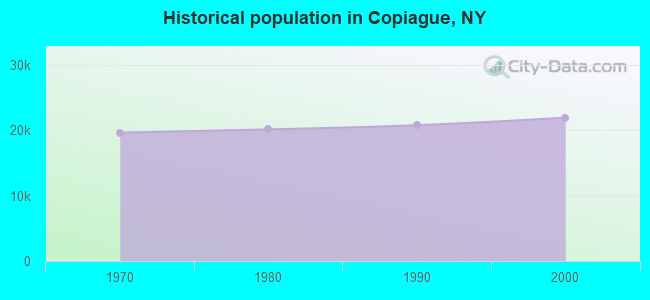
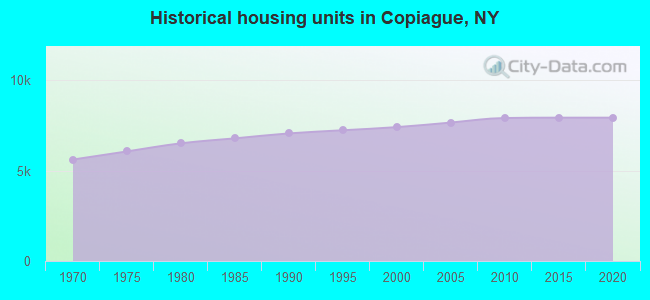
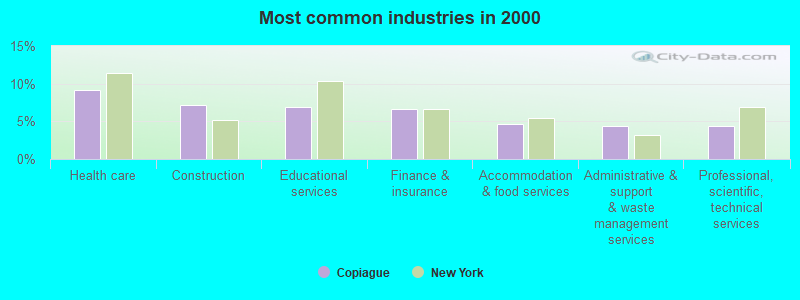
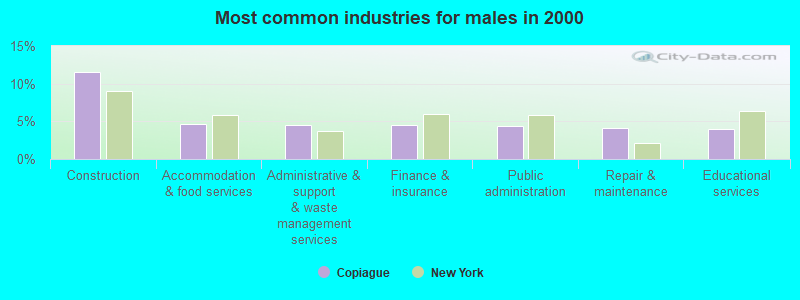
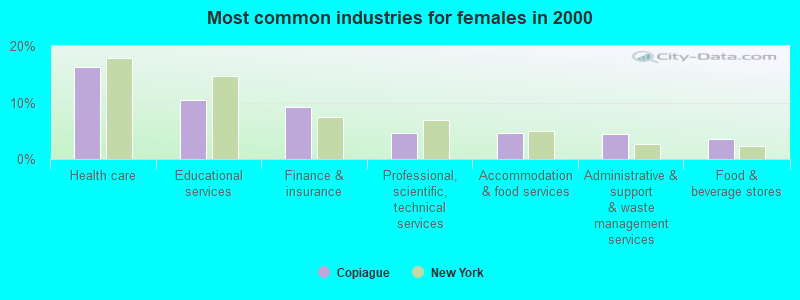
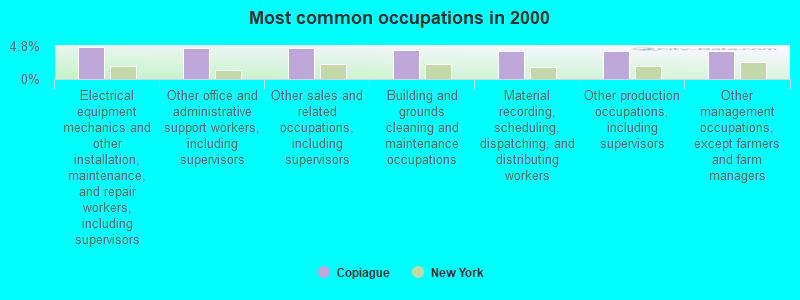
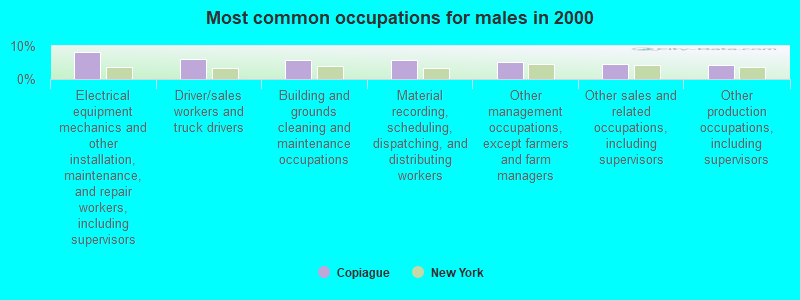
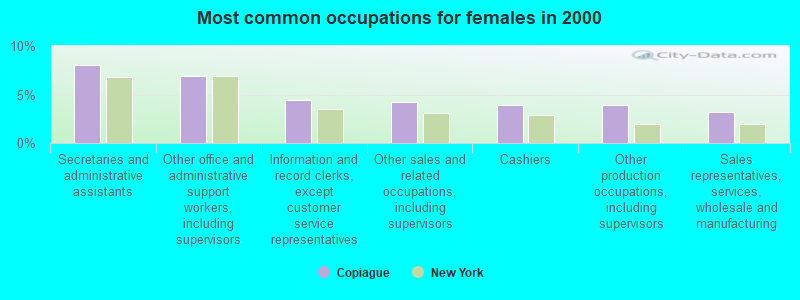

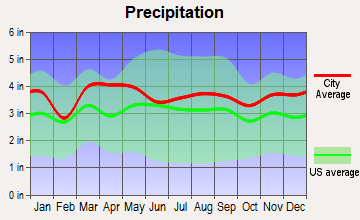


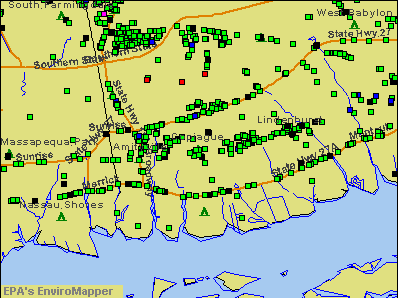

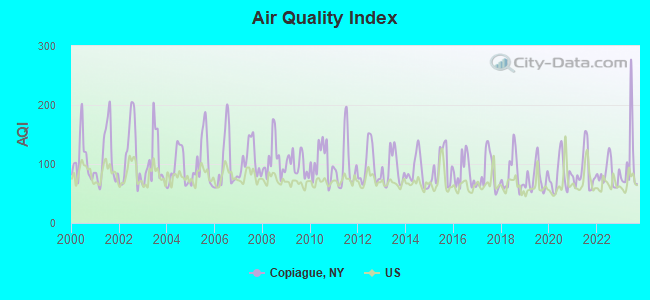
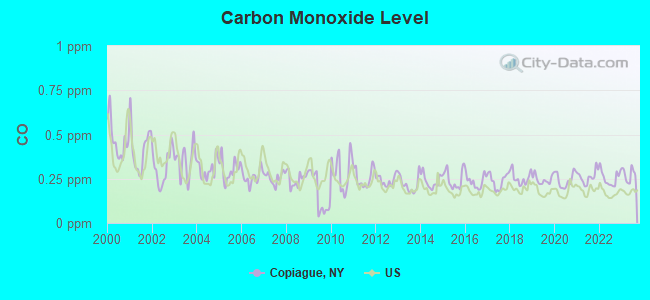
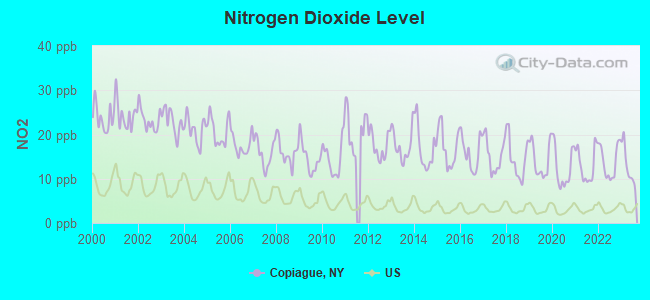
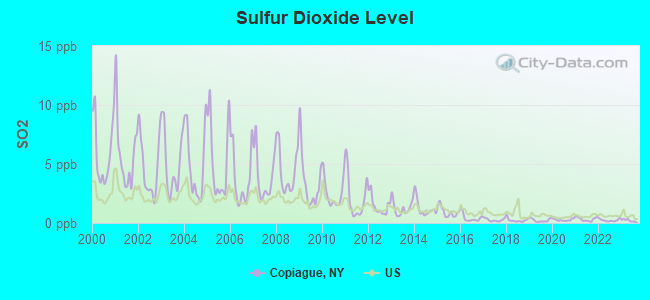
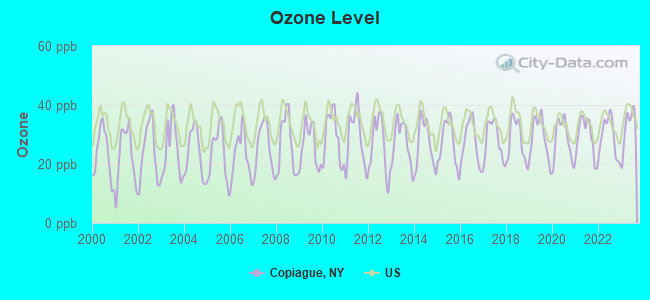
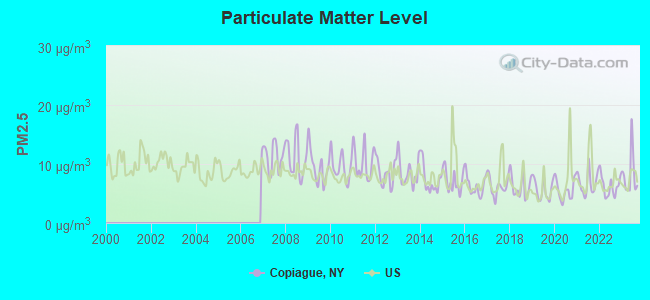
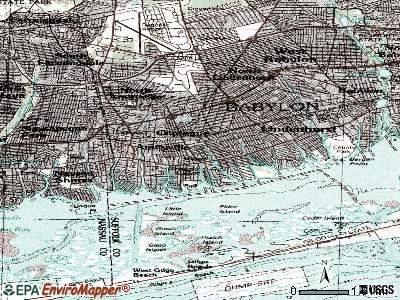
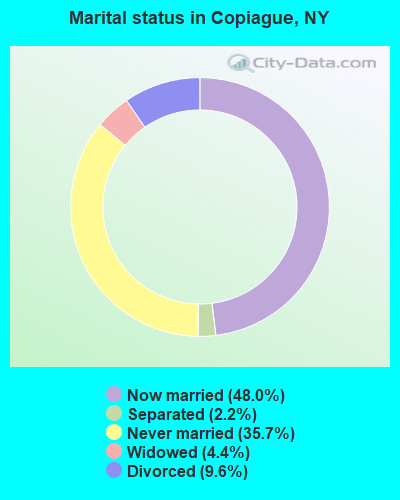
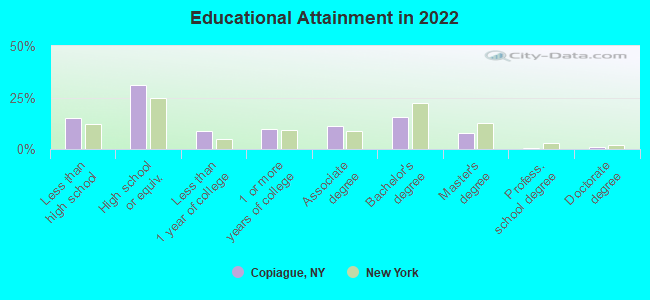
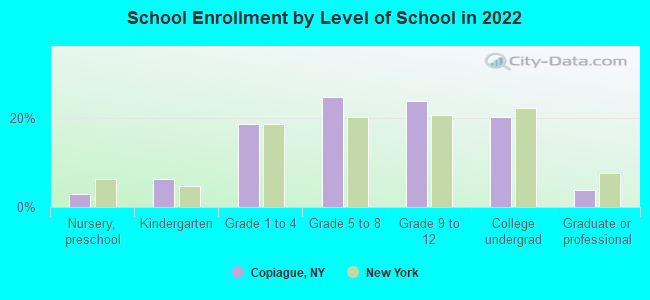
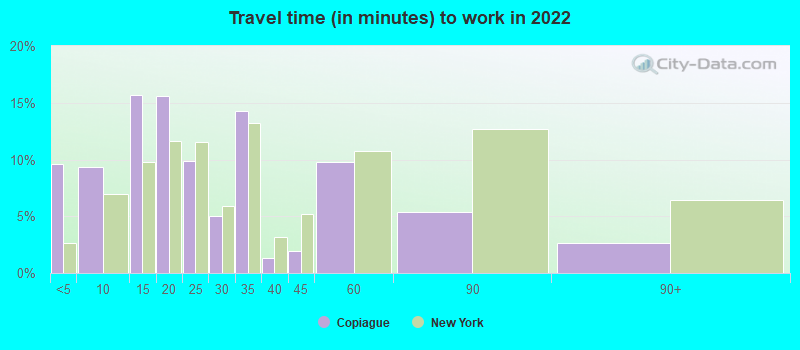
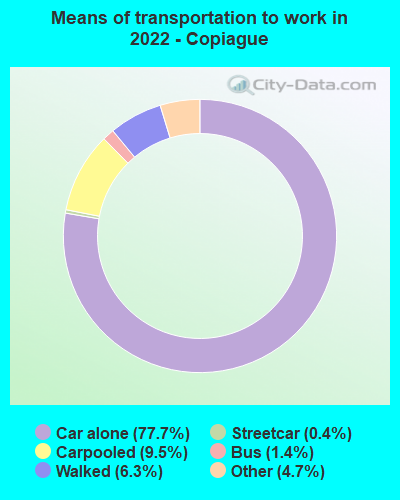


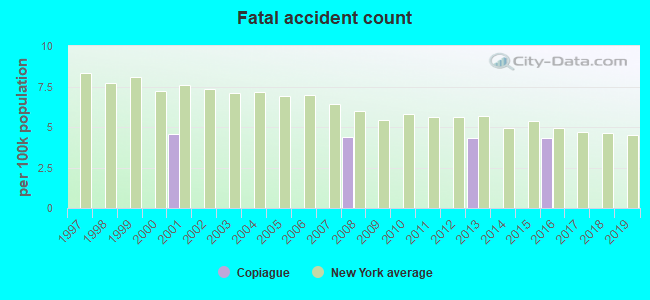
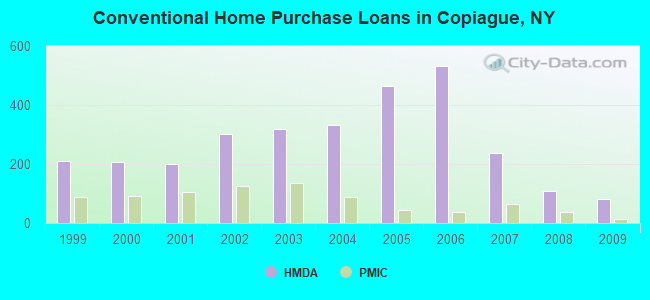
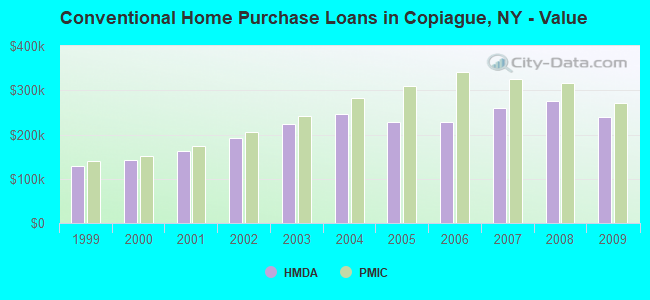
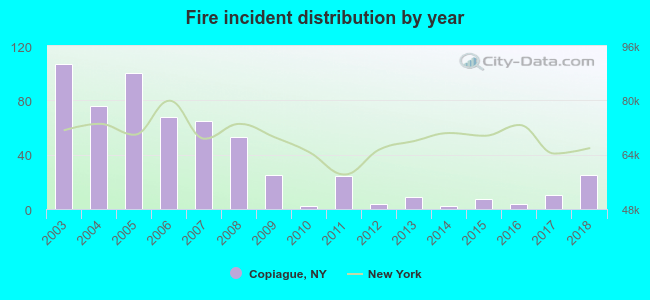 Based on the data from the years 2003 - 2018 the average number of fire incidents per year is 36. The highest number of reported fires - 107 took place in 2003, and the least - 2 in 2010. The data has a dropping trend.
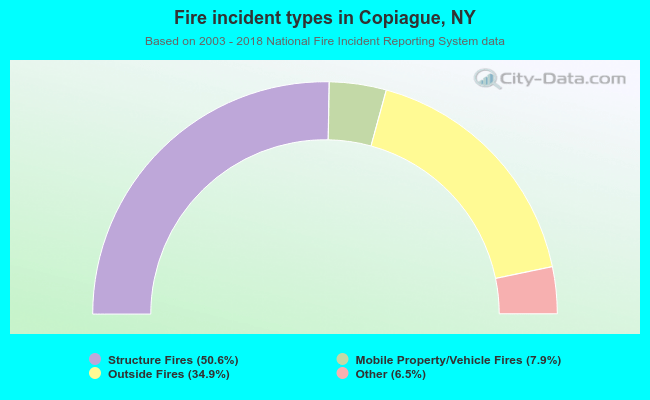 When looking into fire subcategories, the most reports belonged to: Structure Fires (50.6%), and Outside Fires (34.9%).