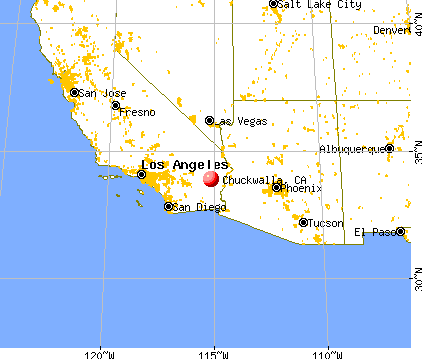
Chuckwalla, California
Submit your own pictures of this place and show them to the world
- OSM Map
- General Map
- Google Map
- MSN Map

| Males: 13,298 | |
| Females: 1,650 |
| Median resident age: | 33.2 years |
| California median age: | 33.3 years |
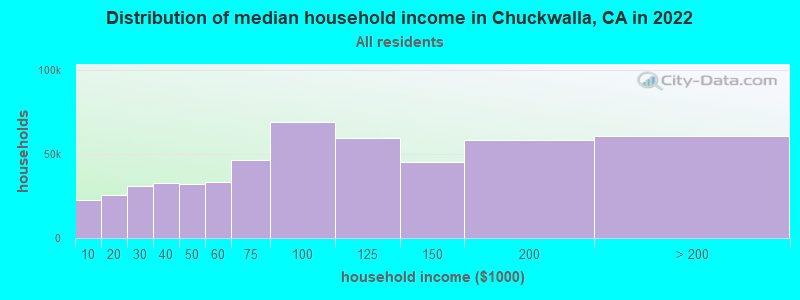
| Chuckwalla: | $58,353 |
| CA: | $91,551 |
Estimated per capita income in 2022: $14,156 (it was $7,459 in 2000)
Chuckwalla CCD income, earnings, and wages data
Estimated median house or condo value in 2022: $292,099 (it was $71,000 in 2000)
| Chuckwalla: | $292,099 |
| CA: | $715,900 |
Mean prices in 2022: all housing units: $586,167; detached houses: $631,165; townhouses or other attached units: $625,082; in 2-unit structures: $464,831; in 3-to-4-unit structures: $482,529; in 5-or-more-unit structures: $526,423; mobile homes: $178,284; occupied boats, rvs, vans, etc.: $86,227
Detailed information about poverty and poor residents in Chuckwalla, CA


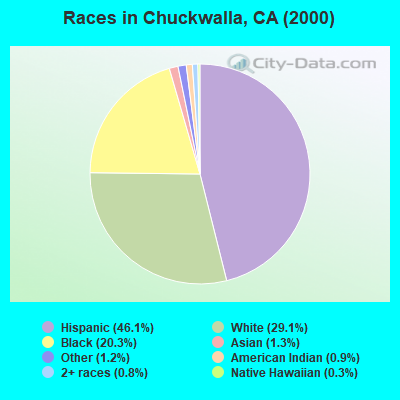
- 5,22246.1%Hispanic
- 3,29629.1%White alone
- 2,30320.3%Black alone
- 1461.3%Asian alone
- 1351.2%Other race alone
- 1000.9%American Indian alone
- 960.8%Two or more races
- 380.3%Native Hawaiian and Other
Pacific Islander alone
 Recent articles from our blog. Our writers, many of them Ph.D. graduates or candidates, create easy-to-read articles on a wide variety of topics.

Current Local Time: PST time zone
Land area: 3838.4 square miles.
Population density: 3.9 people per square mile (very low).
| Chuckwalla CCD: | 1.0% ($694) |
| California: | 0.8% ($1,564) |
Nearest city with pop. 50,000+: Coachella Valley, CA  (59.8 miles , pop. 118,932).
Nearest city with pop. 200,000+: Riverside, CA (128.6 miles , pop. 255,166).
Nearest city with pop. 1,000,000+: San Diego, CA (138.2 miles , pop. 1,223,400).
Nearest cities:
), ), ), ), )Latitude: 33.89 N, Longitude: 115.16 W
Area code commonly used in this area: 760

| Here: | 5.2% |
| California: | 5.1% |
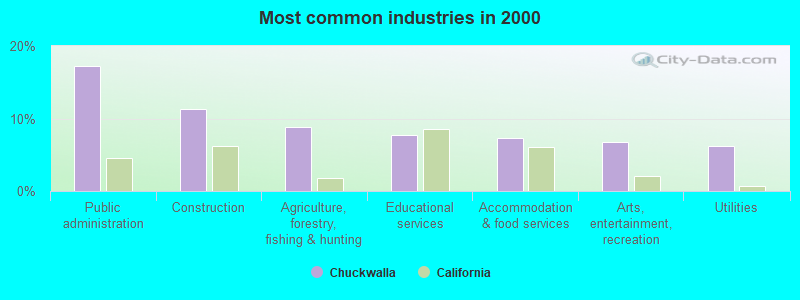
- Public administration (17.2%)
- Construction (11.3%)
- Agriculture, forestry, fishing & hunting (8.8%)
- Educational services (7.8%)
- Accommodation & food services (7.3%)
- Arts, entertainment, recreation (6.8%)
- Utilities (6.3%)
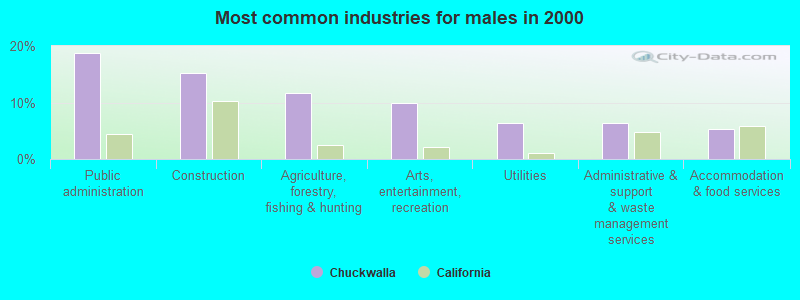
- Public administration (18.8%)
- Construction (15.2%)
- Agriculture, forestry, fishing & hunting (11.6%)
- Arts, entertainment, recreation (9.9%)
- Utilities (6.3%)
- Administrative & support & waste management services (6.3%)
- Accommodation & food services (5.3%)
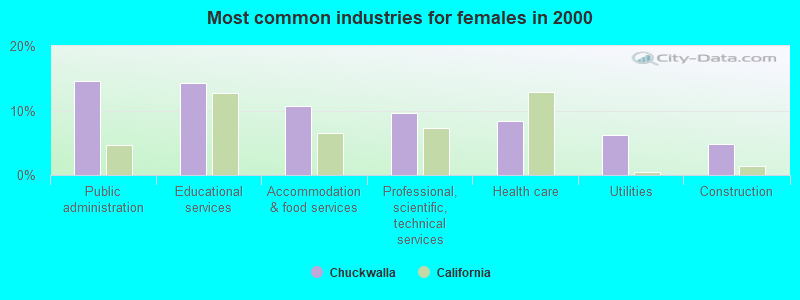
- Public administration (14.6%)
- Educational services (14.3%)
- Accommodation & food services (10.7%)
- Professional, scientific, technical services (9.6%)
- Health care (8.4%)
- Utilities (6.2%)
- Construction (4.8%)
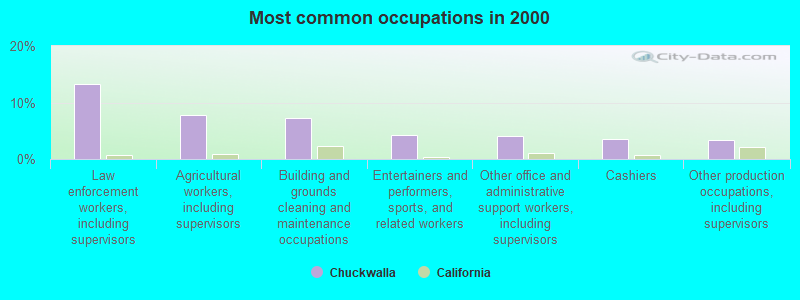
- Law enforcement workers, including supervisors (13.3%)
- Agricultural workers, including supervisors (7.9%)
- Building and grounds cleaning and maintenance occupations (7.3%)
- Entertainers and performers, sports, and related workers (4.3%)
- Other office and administrative support workers, including supervisors (4.1%)
- Cashiers (3.6%)
- Other production occupations, including supervisors (3.3%)
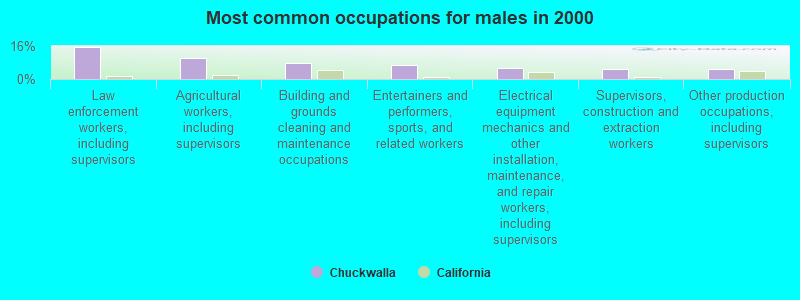
- Law enforcement workers, including supervisors (15.6%)
- Agricultural workers, including supervisors (10.1%)
- Building and grounds cleaning and maintenance occupations (7.7%)
- Entertainers and performers, sports, and related workers (6.8%)
- Electrical equipment mechanics and other installation, maintenance, and repair workers, including supervisors (5.3%)
- Supervisors, construction and extraction workers (5.0%)
- Other production occupations, including supervisors (4.8%)
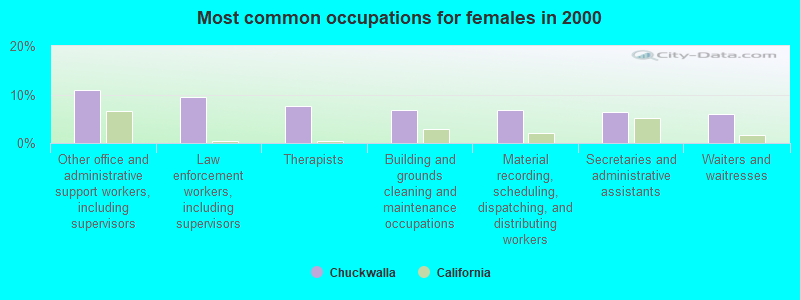
- Other office and administrative support workers, including supervisors (11.0%)
- Law enforcement workers, including supervisors (9.6%)
- Therapists (7.6%)
- Building and grounds cleaning and maintenance occupations (6.7%)
- Material recording, scheduling, dispatching, and distributing workers (6.7%)
- Secretaries and administrative assistants (6.5%)
- Waiters and waitresses (5.9%)
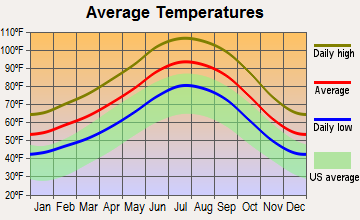
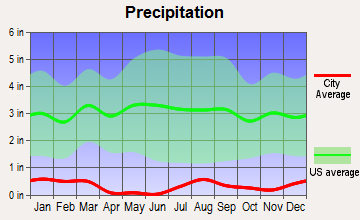
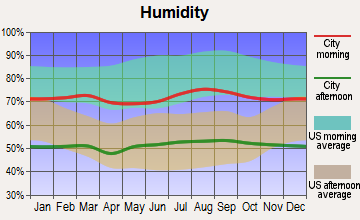
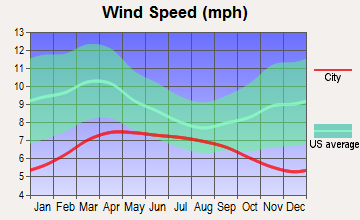
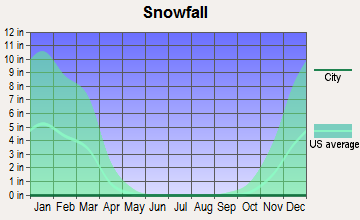
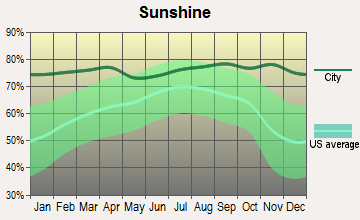
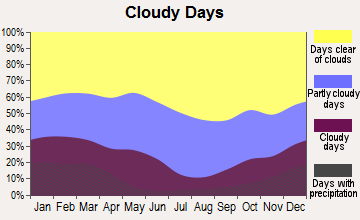
Average climate in Chuckwalla, California
Based on data reported by over 4,000 weather stations
Earthquake activity:
Chuckwalla-area historical earthquake activity is significantly above California state average. It is 5647% greater than the overall U.S. average.On 6/28/1992 at 11:57:34, a magnitude 7.6 (6.2 MB, 7.6 MS, 7.3 MW, Depth: 0.7 mi, Class: Major, Intensity: VIII - XII) earthquake occurred 81.4 miles away from Chuckwalla center, causing 3 deaths (1 shaking deaths, 2 other deaths) and 400 injuries, causing $100,000,000 total damage and $40,000,000 insured losses
On 10/16/1999 at 09:46:44, a magnitude 7.4 (6.3 MB, 7.4 MS, 7.2 MW, 7.3 ML) earthquake occurred 85.0 miles away from the city center
On 5/19/1940 at 04:36:40, a magnitude 7.2 (7.2 UK) earthquake occurred 55.6 miles away from Chuckwalla center, causing $33,000,000 total damage
On 7/21/1952 at 11:52:14, a magnitude 7.7 (7.7 UK) earthquake occurred 232.3 miles away from the city center, causing $50,000,000 total damage
On 12/31/1934 at 18:45:56, a magnitude 7.1 (7.1 UK) earthquake occurred 90.2 miles away from Chuckwalla center
On 10/15/1979 at 23:16:54, a magnitude 7.0 (5.7 MB, 6.9 MS, 7.0 ML, 6.4 MW) earthquake occurred 79.3 miles away from the city center
Magnitude types: body-wave magnitude (MB), local magnitude (ML), surface-wave magnitude (MS), moment magnitude (MW)
Natural disasters:
The number of natural disasters in Riverside County (46) is a lot greater than the US average (15).Major Disasters (Presidential) Declared: 27
Emergencies Declared: 1
Causes of natural disasters: Fires: 22, Floods: 20, Storms: 8, Winter Storms: 8, Landslides: 6, Mudslides: 5, Heavy Rains: 2, Earthquake: 1, Flash Flood: 1, Freeze: 1, Hurricane: 1, Tornado: 1, Tropical Storm: 1, Other: 1 (Note: some incidents may be assigned to more than one category).
Colleges/universities with over 2000 students nearest to Chuckwalla:
- College of the Desert (about 72 miles; Palm Desert, CA; Full-time enrollment: 5,686)
- Imperial Valley College (about 77 miles; Imperial, CA; FT enrollment: 5,313)
- Arizona Western College (about 92 miles; Yuma, AZ; FT enrollment: 5,454)
- Mt San Jacinto Community College District (about 105 miles; San Jacinto, CA; FT enrollment: 8,426)
- Crafton Hills College (about 112 miles; Yucaipa, CA; FT enrollment: 3,222)
- Mohave Community College (about 116 miles; Kingman, AZ; FT enrollment: 3,309)
- University of Redlands (about 116 miles; Redlands, CA; FT enrollment: 4,854)
Points of interest:
Notable locations in Chuckwalla: Skylark Ranch (A), Hell (B), Hidden Valley Campground (C), Hills Ranch (D), Johns Camp (E), Jumbo Rocks Campground (F), Lost Horse Ranger Station (G), Lost Lake Resort (H), Pinkham Well (I), Pinyon Well (J), Ryan Campground (K), Sheep Pass Group Campground (L), Summit (M), Thompsons Camp (N), Blythe Municipal Golf Course (O), Water Wheel Camp (P), Sheep Pass Campground (Q), White Tank Campground (R), Cap Rock (S), Circle E Ranch (T). Display/hide their locations on the map
Lakes and reservoirs: Palen Lake (A), Lost Lake (B), Hidden Tank (C), Eagle Tank (D), Ivanpah Tank (E), Long Tank (F), Spring Tank (G), Live Oak Tank (H). Display/hide their locations on the map
Streams, rivers, and creeks: Fried Liver Wash (A), Eagle Creek (B), Dragon Wash (C), Corn Springs Wash (D), Cholla Wash (E), Big Wash (F), Ship Creek (G), Washington Wash (H), Vidal Wash (I). Display/hide their locations on the map
Parks in Chuckwalla include: Joshua Tree National Park (1), Cactus City Rest Area (2), Edmund C Jaeger Nature Sanctuary (3), Wileys Well Rest Area (4). Display/hide their locations on the map
| This place: | 2.7 people |
| California: | 2.9 people |
| This place: | 49.3% |
| Whole state: | 69.4% |
| This place: | 5.4% |
| Whole state: | 5.9% |
Likely homosexual households (counted as self-reported same-sex unmarried-partner households)
- Lesbian couples: 0.2% of all households
- Gay men: 0.3% of all households
| This place: | 22.4% |
| Whole state: | 14.2% |
| This place: | 7.8% |
| Whole state: | 6.3% |
16 people in other noninstitutional group quarters in 2000
For population 15 years and over in Chuckwalla:
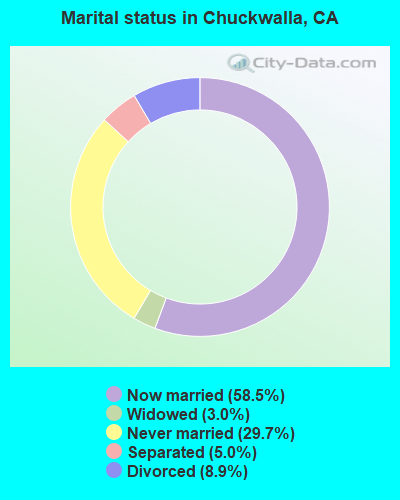
- Never married: 29.7%
- Now married: 58.5%
- Separated: 5.0%
- Widowed: 3.0%
- Divorced: 8.9%
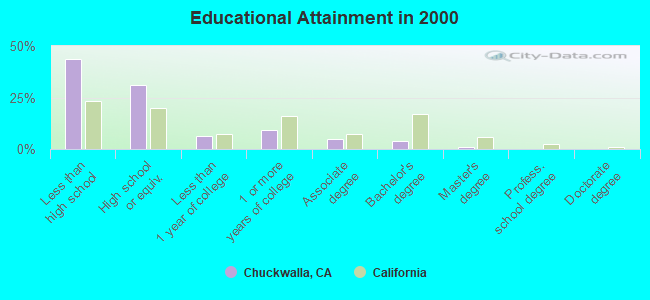
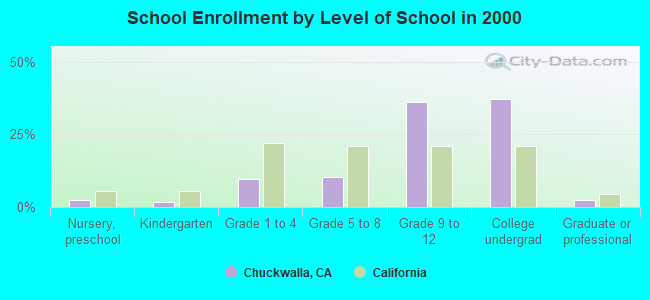
For population 25 years and over in Chuckwalla:
- High school or higher: 56.5%
- Bachelor's degree or higher: 5.1%
- Graduate or professional degree: 1.3%
- Unemployed: 10.5%
- Mean travel time to work (commute): 16.7 minutes
| Here: | 13.9 |
| California average: | 16.1 |


Graphs represent county-level data. Detailed 2008 Election Results
Religion statistics for Chuckwalla, CA (based on Riverside County data)


| Religion | Adherents | Congregations |
|---|---|---|
| Catholic | 602,765 | 51 |
| Evangelical Protestant | 240,306 | 741 |
| Other | 77,581 | 194 |
| Mainline Protestant | 29,535 | 103 |
| Black Protestant | 19,170 | 40 |
| Orthodox | 3,647 | 11 |
| None | 1,216,637 | - |
Food Environment Statistics:
| Riverside County: | 1.60 / 10,000 pop. |
| California: | 2.14 / 10,000 pop. |
| Riverside County: | 0.05 / 10,000 pop. |
| State: | 0.04 / 10,000 pop. |
| Riverside County: | 0.44 / 10,000 pop. |
| California: | 0.62 / 10,000 pop. |
| Here: | 1.51 / 10,000 pop. |
| State: | 1.49 / 10,000 pop. |
| Riverside County: | 5.45 / 10,000 pop. |
| California: | 7.42 / 10,000 pop. |
| This county: | 7.7% |
| California: | 7.3% |
| Riverside County: | 24.5% |
| State: | 21.3% |
| Riverside County: | 15.2% |
| California: | 17.9% |
7.19% of this county's 2021 resident taxpayers lived in other counties in 2020 ($71,521 average adjusted gross income)
| Here: | 7.19% |
| California average: | 5.19% |
0.03% of residents moved from foreign countries ($210 average AGI)
Riverside County: 0.03% California average: 0.03%
Top counties from which taxpayers relocated into this county between 2020 and 2021:
| from Los Angeles County, CA | |
| from San Bernardino County, CA | |
| from Orange County, CA |
6.28% of this county's 2020 resident taxpayers moved to other counties in 2021 ($64,593 average adjusted gross income)
| Here: | 6.28% |
| California average: | 6.14% |
0.02% of residents moved to foreign countries ($200 average AGI)
Riverside County: 0.02% California average: 0.02%
Top counties to which taxpayers relocated from this county between 2020 and 2021:
| to San Bernardino County, CA | |
| to Los Angeles County, CA | |
| to Orange County, CA |
Strongest AM radio stations in Chuckwalla:
- KFMB (760 AM; 50 kW; SAN DIEGO, CA; Owner: MIDWEST TELEVISION, INC.)
- KLAC (570 AM; 50 kW; LOS ANGELES, CA; Owner: AMFM RADIO LICENSES, L.L.C.)
- KPLS (830 AM; 50 kW; ORANGE, CA; Owner: CRN LICENSES, LLC)
- KDWN (720 AM; 50 kW; LAS VEGAS, NV; Owner: RADIO NEVADA CORP.)
- KFI (640 AM; 50 kW; LOS ANGELES, CA; Owner: CAPSTAR TX LIMITED PARTNERSHIP)
- KCBQ (1170 AM; 50 kW; SAN DIEGO, CA; Owner: RADIO 1210, INC.)
- KMIA (710 AM; 50 kW; BLACK CANYON CITY, AZ; Owner: ENTRAVISION HOLDINGS, LLC)
- KSPN (710 AM; 50 kW; LOS ANGELES, CA; Owner: KABC-AM RADIO, INC.)
- KXNT (840 AM; 50 kW; NORTH LAS VEGAS, NV; Owner: INFINITY RADIO OPERATIONS INC.)
- KTNQ (1020 AM; 50 kW; LOS ANGELES, CA; Owner: KTNQ-AM LICENSE CORP.)
- KDIS (1110 AM; 50 kW; PASADENA, CA; Owner: ABC,INC.)
- KFWB (980 AM; 50 kW; LOS ANGELES, CA; Owner: INFINITY BROADCASTING OPERATIONS, INC.)
- KXTA (1150 AM; 50 kW; LOS ANGELES, CA; Owner: CITICASTERS LICENSES, L.P.)
Strongest FM radio stations in Chuckwalla:
- KZAL (105.5 FM; DESERT CENTER, CA; Owner: WORLDWIDE MULTI-MEDIA B/C CO.)
- KRRK (101.1 FM; LAKE HAVASU CITY, AZ; Owner: SMOKE AND MIRRORS, LLC)
- K263AI (100.5 FM; LAKE HAVASU CITY, AZ; Owner: DONALD F. HENDREN)
- KRCY-FM (96.7 FM; LAKE HAVASU CITY, AZ; Owner: RICK L. MURPHY)
- KZUL-FM (104.5 FM; LAKE HAVASU CITY, AZ; Owner: MAD DOG WIRELESS, INC.)
- KJJJ (102.3 FM; LAKE HAVASU CITY, AZ; Owner: STEVEN M. GREELEY)
FCC Registered Antenna Towers:
9 (See the full list of FCC Registered Antenna Towers in Chuckwalla)FCC Registered Microwave Towers:
2- First Solar, Solar Farm (Lat: 33.806417 Lon: -115.401861), Type: Mtower, Structure height: 7.6 m, Overall height: 9.1 m, Call Sign: WQRD452, Licensee ID: L02348852,
Assigned Frequencies: 6197.24 MHz, Grant Date: 05/08/2023, Expiration Date: 04/22/2033, Certifier: Kevin Saville, Registrant: Frontier California Inc.
- CHUCKWALLA, Chuckawalla Mtn Near (Lat: 33.655111 Lon: -115.453917), Type: Ltower, Structure height: 30.5 m, Overall height: 36.9 m, Call Sign: KMV68,
Assigned Frequencies: 5945.20 MHz, 5974.85 MHz, 10795.0 MHz, 6123.10 MHz, 5974.85 MHz, 6142.87 MHz, 10795.0 MHz, Grant Date: 08/23/2022, Expiration Date: 11/12/2032, Registrant: County Of Riverside, 7195 Alessandro Blvd, Riverside, CA 92506, Phone: (951) 955-0582, Fax: (951) 955-0603, Email:
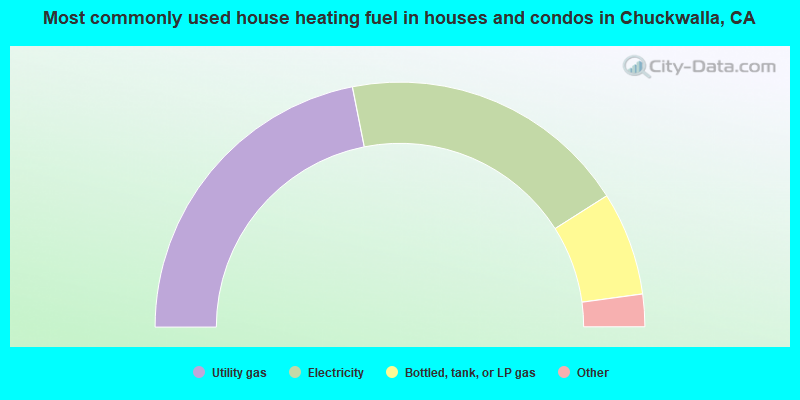
- 43.8%Utility gas
- 38.2%Electricity
- 13.7%Bottled, tank, or LP gas
- 2.1%Other fuel
- 1.2%No fuel used
- 1.0%Wood
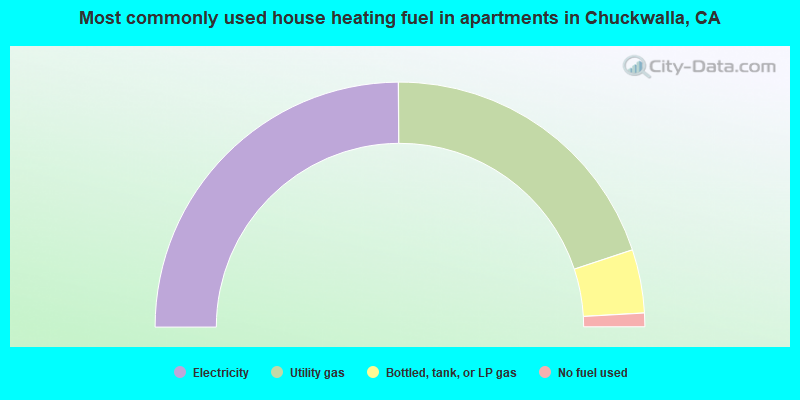
- 49.8%Electricity
- 40.0%Utility gas
- 8.4%Bottled, tank, or LP gas
- 1.8%No fuel used
Chuckwalla compared to California state average:
- Median household income below state average.
- Median house value significantly below state average.
- Black race population percentage significantly above state average.
- Foreign-born population percentage significantly below state average.
- Renting percentage significantly below state average.
- Length of stay since moving in significantly above state average.
- Number of rooms per house significantly below state average.
- House age significantly below state average.
- Institutionalized population percentage significantly above state average.
- Percentage of population with a bachelor's degree or higher significantly below state average.
Chuckwalla on our top lists:
- #1 on the list of "Top 101 cities with largest percentage of females in occupations: therapists (population 5,000+)"
- #1 on the list of "Top 101 cities with largest percentage of males in occupations: entertainers and performers, sports, and related workers (population 5,000+)"
- #2 on the list of "Top 101 cities with largest percentage of males in industries: gasoline stations (population 5,000+)"
- #4 on the list of "Top 101 cities with largest percentage of males in occupations: food and beverage serving workers except waiters/waitresses (population 5,000+)"
- #5 on the list of "Top 101 cities with the largest percentage of people in state prisons (population 1,000+)"
- #6 on the list of "Top 101 cities with largest percentage of females in industries: utilities (population 5,000+)"
- #6 on the list of "Top 101 cities with largest percentage of females in occupations: law enforcement workers including supervisors (population 5,000+)"
- #8 on the list of "Top 101 cities with largest percentage of females in occupations: librarians, curators, and archivists (population 5,000+)"
- #9 on the list of "Top 101 cities with largest percentage of males in occupations: bookkeeping, accounting, and auditing clerks (population 5,000+)"
- #12 on the list of "Top 101 cities with largest percentage of females in industries: data processing, libraries, and other information services (population 5,000+)"
- #14 on the list of "Top 101 cities with largest percentage of females in industries: gasoline stations (population 5,000+)"
- #14 on the list of "Top 101 cities with the largest percentage of mobile homes (2,000+ housing units)"
- #14 on the list of "Top 100 cities with largest land areas"
- #25 on the list of "Top 101 cities with largest percentage of males in industries: miscellaneous nondurable goods merchant wholesalers (population 5,000+)"
- #31 on the list of "Top 101 cities with largest percentage of females in industries: wood products (population 5,000+)"
- #37 on the list of "Top 101 cities with the most people carpooling to work (population 5,000+)"
- #45 on the list of "Top 101 cities with largest percentage of females in industries: radio, tv, and computer stores (population 5,000+)"
- #54 on the list of "Top 101 cities with largest percentage of females in industries: private households (population 5,000+)"
- #59 on the list of "Top 101 cities with largest percentage of males in industries: electrical and electronic goods merchant wholesalers (population 5,000+)"
- #60 on the list of "Top 101 cities with largest percentage of females in industries: personal and laundry services (population 5,000+)"
- #3 on the list of "Top 101 counties with the highest lead air pollution readings in 2012 (µg/m3)"
- #4 on the list of "Top 101 counties with the highest ground withdrawal of fresh water for public supply"
- #11 on the list of "Top 101 counties with the most Catholic adherents"
- #11 on the list of "Top 101 counties with the highest total withdrawal of fresh water for public supply"
- #12 on the list of "Top 101 counties with the highest carbon monoxide air pollution readings in 2012 (ppm)"