Chippewa Falls, Wisconsin Submit your own pictures of this city and show them to the world
OSM Map
General Map
Google Map
MSN Map
OSM Map
General Map
Google Map
MSN Map
OSM Map
General Map
Google Map
MSN Map
OSM Map
General Map
Google Map
MSN Map
Please wait while loading the map...
Population in 2022: 14,645 (97% urban, 3% rural). Population change since 2000: +13.3%Males: 7,194 Females: 7,451
March 2022 cost of living index in Chippewa Falls: 90.1 (less than average, U.S. average is 100) Percentage of residents living in poverty in 2022: 14.2%for White Non-Hispanic residents , 6.8% for Hispanic or Latino residents , 75.3% for American Indian residents , 1.4% for two or more races residents )
Profiles of local businesses
Business Search - 14 Million verified businesses
Data:
Median household income ($)
Median household income (% change since 2000)
Household income diversity
Ratio of average income to average house value (%)
Ratio of average income to average rent
Median household income ($) - White
Median household income ($) - Black or African American
Median household income ($) - Asian
Median household income ($) - Hispanic or Latino
Median household income ($) - American Indian and Alaska Native
Median household income ($) - Multirace
Median household income ($) - Other Race
Median household income for houses/condos with a mortgage ($)
Median household income for apartments without a mortgage ($)
Races - White alone (%)
Races - White alone (% change since 2000)
Races - Black alone (%)
Races - Black alone (% change since 2000)
Races - American Indian alone (%)
Races - American Indian alone (% change since 2000)
Races - Asian alone (%)
Races - Asian alone (% change since 2000)
Races - Hispanic (%)
Races - Hispanic (% change since 2000)
Races - Native Hawaiian and Other Pacific Islander alone (%)
Races - Native Hawaiian and Other Pacific Islander alone (% change since 2000)
Races - Two or more races (%)
Races - Two or more races (% change since 2000)
Races - Other race alone (%)
Races - Other race alone (% change since 2000)
Racial diversity
Unemployment (%)
Unemployment (% change since 2000)
Unemployment (%) - White
Unemployment (%) - Black or African American
Unemployment (%) - Asian
Unemployment (%) - Hispanic or Latino
Unemployment (%) - American Indian and Alaska Native
Unemployment (%) - Multirace
Unemployment (%) - Other Race
Population density (people per square mile)
Population - Males (%)
Population - Females (%)
Population - Males (%) - White
Population - Males (%) - Black or African American
Population - Males (%) - Asian
Population - Males (%) - Hispanic or Latino
Population - Males (%) - American Indian and Alaska Native
Population - Males (%) - Multirace
Population - Males (%) - Other Race
Population - Females (%) - White
Population - Females (%) - Black or African American
Population - Females (%) - Asian
Population - Females (%) - Hispanic or Latino
Population - Females (%) - American Indian and Alaska Native
Population - Females (%) - Multirace
Population - Females (%) - Other Race
Coronavirus confirmed cases (May 08, 2024)
Deaths caused by coronavirus (May 08, 2024)
Coronavirus confirmed cases (per 100k population) (May 08, 2024)
Deaths caused by coronavirus (per 100k population) (May 08, 2024)
Daily increase in number of cases (May 08, 2024)
Weekly increase in number of cases (May 08, 2024)
Cases doubled (in days) (May 08, 2024)
Hospitalized patients (Apr 18, 2022)
Negative test results (Apr 18, 2022)
Total test results (Apr 18, 2022)
COVID Vaccine doses distributed (per 100k population) (Sep 19, 2023)
COVID Vaccine doses administered (per 100k population) (Sep 19, 2023)
COVID Vaccine doses distributed (Sep 19, 2023)
COVID Vaccine doses administered (Sep 19, 2023)
Likely homosexual households (%)
Likely homosexual households (% change since 2000)
Likely homosexual households - Lesbian couples (%)
Likely homosexual households - Lesbian couples (% change since 2000)
Likely homosexual households - Gay men (%)
Likely homosexual households - Gay men (% change since 2000)
Cost of living index
Median gross rent ($)
Median contract rent ($)
Median monthly housing costs ($)
Median house or condo value ($)
Median house or condo value ($ change since 2000)
Mean house or condo value by units in structure - 1, detached ($)
Mean house or condo value by units in structure - 1, attached ($)
Mean house or condo value by units in structure - 2 ($)
Mean house or condo value by units in structure by units in structure - 3 or 4 ($)
Mean house or condo value by units in structure - 5 or more ($)
Mean house or condo value by units in structure - Boat, RV, van, etc. ($)
Mean house or condo value by units in structure - Mobile home ($)
Median house or condo value ($) - White
Median house or condo value ($) - Black or African American
Median house or condo value ($) - Asian
Median house or condo value ($) - Hispanic or Latino
Median house or condo value ($) - American Indian and Alaska Native
Median house or condo value ($) - Multirace
Median house or condo value ($) - Other Race
Median resident age
Resident age diversity
Median resident age - Males
Median resident age - Females
Median resident age - White
Median resident age - Black or African American
Median resident age - Asian
Median resident age - Hispanic or Latino
Median resident age - American Indian and Alaska Native
Median resident age - Multirace
Median resident age - Other Race
Median resident age - Males - White
Median resident age - Males - Black or African American
Median resident age - Males - Asian
Median resident age - Males - Hispanic or Latino
Median resident age - Males - American Indian and Alaska Native
Median resident age - Males - Multirace
Median resident age - Males - Other Race
Median resident age - Females - White
Median resident age - Females - Black or African American
Median resident age - Females - Asian
Median resident age - Females - Hispanic or Latino
Median resident age - Females - American Indian and Alaska Native
Median resident age - Females - Multirace
Median resident age - Females - Other Race
Commute - mean travel time to work (minutes)
Travel time to work - Less than 5 minutes (%)
Travel time to work - Less than 5 minutes (% change since 2000)
Travel time to work - 5 to 9 minutes (%)
Travel time to work - 5 to 9 minutes (% change since 2000)
Travel time to work - 10 to 19 minutes (%)
Travel time to work - 10 to 19 minutes (% change since 2000)
Travel time to work - 20 to 29 minutes (%)
Travel time to work - 20 to 29 minutes (% change since 2000)
Travel time to work - 30 to 39 minutes (%)
Travel time to work - 30 to 39 minutes (% change since 2000)
Travel time to work - 40 to 59 minutes (%)
Travel time to work - 40 to 59 minutes (% change since 2000)
Travel time to work - 60 to 89 minutes (%)
Travel time to work - 60 to 89 minutes (% change since 2000)
Travel time to work - 90 or more minutes (%)
Travel time to work - 90 or more minutes (% change since 2000)
Marital status - Never married (%)
Marital status - Now married (%)
Marital status - Separated (%)
Marital status - Widowed (%)
Marital status - Divorced (%)
Median family income ($)
Median family income (% change since 2000)
Median non-family income ($)
Median non-family income (% change since 2000)
Median per capita income ($)
Median per capita income (% change since 2000)
Median family income ($) - White
Median family income ($) - Black or African American
Median family income ($) - Asian
Median family income ($) - Hispanic or Latino
Median family income ($) - American Indian and Alaska Native
Median family income ($) - Multirace
Median family income ($) - Other Race
Median year house/condo built
Median year apartment built
Year house built - Built 2005 or later (%)
Year house built - Built 2000 to 2004 (%)
Year house built - Built 1990 to 1999 (%)
Year house built - Built 1980 to 1989 (%)
Year house built - Built 1970 to 1979 (%)
Year house built - Built 1960 to 1969 (%)
Year house built - Built 1950 to 1959 (%)
Year house built - Built 1940 to 1949 (%)
Year house built - Built 1939 or earlier (%)
Average household size
Household density (households per square mile)
Average household size - White
Average household size - Black or African American
Average household size - Asian
Average household size - Hispanic or Latino
Average household size - American Indian and Alaska Native
Average household size - Multirace
Average household size - Other Race
Occupied housing units (%)
Vacant housing units (%)
Owner occupied housing units (%)
Renter occupied housing units (%)
Vacancy status - For rent (%)
Vacancy status - For sale only (%)
Vacancy status - Rented or sold, not occupied (%)
Vacancy status - For seasonal, recreational, or occasional use (%)
Vacancy status - For migrant workers (%)
Vacancy status - Other vacant (%)
Residents with income below the poverty level (%)
Residents with income below 50% of the poverty level (%)
Children below poverty level (%)
Poor families by family type - Married-couple family (%)
Poor families by family type - Male, no wife present (%)
Poor families by family type - Female, no husband present (%)
Poverty status for native-born residents (%)
Poverty status for foreign-born residents (%)
Poverty among high school graduates not in families (%)
Poverty among people who did not graduate high school not in families (%)
Residents with income below the poverty level (%) - White
Residents with income below the poverty level (%) - Black or African American
Residents with income below the poverty level (%) - Asian
Residents with income below the poverty level (%) - Hispanic or Latino
Residents with income below the poverty level (%) - American Indian and Alaska Native
Residents with income below the poverty level (%) - Multirace
Residents with income below the poverty level (%) - Other Race
Air pollution - Air Quality Index (AQI)
Air pollution - CO
Air pollution - NO2
Air pollution - SO2
Air pollution - Ozone
Air pollution - PM10
Air pollution - PM25
Air pollution - Pb
Crime - Murders per 100,000 population
Crime - Rapes per 100,000 population
Crime - Robberies per 100,000 population
Crime - Assaults per 100,000 population
Crime - Burglaries per 100,000 population
Crime - Thefts per 100,000 population
Crime - Auto thefts per 100,000 population
Crime - Arson per 100,000 population
Crime - City-data.com crime index
Crime - Violent crime index
Crime - Property crime index
Crime - Murders per 100,000 population (5 year average)
Crime - Rapes per 100,000 population (5 year average)
Crime - Robberies per 100,000 population (5 year average)
Crime - Assaults per 100,000 population (5 year average)
Crime - Burglaries per 100,000 population (5 year average)
Crime - Thefts per 100,000 population (5 year average)
Crime - Auto thefts per 100,000 population (5 year average)
Crime - Arson per 100,000 population (5 year average)
Crime - City-data.com crime index (5 year average)
Crime - Violent crime index (5 year average)
Crime - Property crime index (5 year average)
1996 Presidential Elections Results (%) - Democratic Party (Clinton)
1996 Presidential Elections Results (%) - Republican Party (Dole)
1996 Presidential Elections Results (%) - Other
2000 Presidential Elections Results (%) - Democratic Party (Gore)
2000 Presidential Elections Results (%) - Republican Party (Bush)
2000 Presidential Elections Results (%) - Other
2004 Presidential Elections Results (%) - Democratic Party (Kerry)
2004 Presidential Elections Results (%) - Republican Party (Bush)
2004 Presidential Elections Results (%) - Other
2008 Presidential Elections Results (%) - Democratic Party (Obama)
2008 Presidential Elections Results (%) - Republican Party (McCain)
2008 Presidential Elections Results (%) - Other
2012 Presidential Elections Results (%) - Democratic Party (Obama)
2012 Presidential Elections Results (%) - Republican Party (Romney)
2012 Presidential Elections Results (%) - Other
2016 Presidential Elections Results (%) - Democratic Party (Clinton)
2016 Presidential Elections Results (%) - Republican Party (Trump)
2016 Presidential Elections Results (%) - Other
2020 Presidential Elections Results (%) - Democratic Party (Biden)
2020 Presidential Elections Results (%) - Republican Party (Trump)
2020 Presidential Elections Results (%) - Other
Ancestries Reported - Arab (%)
Ancestries Reported - Czech (%)
Ancestries Reported - Danish (%)
Ancestries Reported - Dutch (%)
Ancestries Reported - English (%)
Ancestries Reported - French (%)
Ancestries Reported - French Canadian (%)
Ancestries Reported - German (%)
Ancestries Reported - Greek (%)
Ancestries Reported - Hungarian (%)
Ancestries Reported - Irish (%)
Ancestries Reported - Italian (%)
Ancestries Reported - Lithuanian (%)
Ancestries Reported - Norwegian (%)
Ancestries Reported - Polish (%)
Ancestries Reported - Portuguese (%)
Ancestries Reported - Russian (%)
Ancestries Reported - Scotch-Irish (%)
Ancestries Reported - Scottish (%)
Ancestries Reported - Slovak (%)
Ancestries Reported - Subsaharan African (%)
Ancestries Reported - Swedish (%)
Ancestries Reported - Swiss (%)
Ancestries Reported - Ukrainian (%)
Ancestries Reported - United States (%)
Ancestries Reported - Welsh (%)
Ancestries Reported - West Indian (%)
Ancestries Reported - Other (%)
Educational Attainment - No schooling completed (%)
Educational Attainment - Less than high school (%)
Educational Attainment - High school or equivalent (%)
Educational Attainment - Less than 1 year of college (%)
Educational Attainment - 1 or more years of college (%)
Educational Attainment - Associate degree (%)
Educational Attainment - Bachelor's degree (%)
Educational Attainment - Master's degree (%)
Educational Attainment - Professional school degree (%)
Educational Attainment - Doctorate degree (%)
School Enrollment - Nursery, preschool (%)
School Enrollment - Kindergarten (%)
School Enrollment - Grade 1 to 4 (%)
School Enrollment - Grade 5 to 8 (%)
School Enrollment - Grade 9 to 12 (%)
School Enrollment - College undergrad (%)
School Enrollment - Graduate or professional (%)
School Enrollment - Not enrolled in school (%)
School enrollment - Public schools (%)
School enrollment - Private schools (%)
School enrollment - Not enrolled (%)
Median number of rooms in houses and condos
Median number of rooms in apartments
Housing units lacking complete plumbing facilities (%)
Housing units lacking complete kitchen facilities (%)
Density of houses
Urban houses (%)
Rural houses (%)
Households with people 60 years and over (%)
Households with people 65 years and over (%)
Households with people 75 years and over (%)
Households with one or more nonrelatives (%)
Households with no nonrelatives (%)
Population in households (%)
Family households (%)
Nonfamily households (%)
Population in families (%)
Family households with own children (%)
Median number of bedrooms in owner occupied houses
Mean number of bedrooms in owner occupied houses
Median number of bedrooms in renter occupied houses
Mean number of bedrooms in renter occupied houses
Median number of vehichles in owner occupied houses
Mean number of vehichles in owner occupied houses
Median number of vehichles in renter occupied houses
Mean number of vehichles in renter occupied houses
Mortgage status - with mortgage (%)
Mortgage status - with second mortgage (%)
Mortgage status - with home equity loan (%)
Mortgage status - with both second mortgage and home equity loan (%)
Mortgage status - without a mortgage (%)
Average family size
Average family size - White
Average family size - Black or African American
Average family size - Asian
Average family size - Hispanic or Latino
Average family size - American Indian and Alaska Native
Average family size - Multirace
Average family size - Other Race
Geographical mobility - Same house 1 year ago (%)
Geographical mobility - Moved within same county (%)
Geographical mobility - Moved from different county within same state (%)
Geographical mobility - Moved from different state (%)
Geographical mobility - Moved from abroad (%)
Place of birth - Born in state of residence (%)
Place of birth - Born in other state (%)
Place of birth - Native, outside of US (%)
Place of birth - Foreign born (%)
Housing units in structures - 1, detached (%)
Housing units in structures - 1, attached (%)
Housing units in structures - 2 (%)
Housing units in structures - 3 or 4 (%)
Housing units in structures - 5 to 9 (%)
Housing units in structures - 10 to 19 (%)
Housing units in structures - 20 to 49 (%)
Housing units in structures - 50 or more (%)
Housing units in structures - Mobile home (%)
Housing units in structures - Boat, RV, van, etc. (%)
House/condo owner moved in on average (years ago)
Renter moved in on average (years ago)
Year householder moved into unit - Moved in 1999 to March 2000 (%)
Year householder moved into unit - Moved in 1995 to 1998 (%)
Year householder moved into unit - Moved in 1990 to 1994 (%)
Year householder moved into unit - Moved in 1980 to 1989 (%)
Year householder moved into unit - Moved in 1970 to 1979 (%)
Year householder moved into unit - Moved in 1969 or earlier (%)
Means of transportation to work - Drove car alone (%)
Means of transportation to work - Carpooled (%)
Means of transportation to work - Public transportation (%)
Means of transportation to work - Bus or trolley bus (%)
Means of transportation to work - Streetcar or trolley car (%)
Means of transportation to work - Subway or elevated (%)
Means of transportation to work - Railroad (%)
Means of transportation to work - Ferryboat (%)
Means of transportation to work - Taxicab (%)
Means of transportation to work - Motorcycle (%)
Means of transportation to work - Bicycle (%)
Means of transportation to work - Walked (%)
Means of transportation to work - Other means (%)
Working at home (%)
Industry diversity
Most Common Industries - Agriculture, forestry, fishing and hunting, and mining (%)
Most Common Industries - Agriculture, forestry, fishing and hunting (%)
Most Common Industries - Mining, quarrying, and oil and gas extraction (%)
Most Common Industries - Construction (%)
Most Common Industries - Manufacturing (%)
Most Common Industries - Wholesale trade (%)
Most Common Industries - Retail trade (%)
Most Common Industries - Transportation and warehousing, and utilities (%)
Most Common Industries - Transportation and warehousing (%)
Most Common Industries - Utilities (%)
Most Common Industries - Information (%)
Most Common Industries - Finance and insurance, and real estate and rental and leasing (%)
Most Common Industries - Finance and insurance (%)
Most Common Industries - Real estate and rental and leasing (%)
Most Common Industries - Professional, scientific, and management, and administrative and waste management services (%)
Most Common Industries - Professional, scientific, and technical services (%)
Most Common Industries - Management of companies and enterprises (%)
Most Common Industries - Administrative and support and waste management services (%)
Most Common Industries - Educational services, and health care and social assistance (%)
Most Common Industries - Educational services (%)
Most Common Industries - Health care and social assistance (%)
Most Common Industries - Arts, entertainment, and recreation, and accommodation and food services (%)
Most Common Industries - Arts, entertainment, and recreation (%)
Most Common Industries - Accommodation and food services (%)
Most Common Industries - Other services, except public administration (%)
Most Common Industries - Public administration (%)
Occupation diversity
Most Common Occupations - Management, business, science, and arts occupations (%)
Most Common Occupations - Management, business, and financial occupations (%)
Most Common Occupations - Management occupations (%)
Most Common Occupations - Business and financial operations occupations (%)
Most Common Occupations - Computer, engineering, and science occupations (%)
Most Common Occupations - Computer and mathematical occupations (%)
Most Common Occupations - Architecture and engineering occupations (%)
Most Common Occupations - Life, physical, and social science occupations (%)
Most Common Occupations - Education, legal, community service, arts, and media occupations (%)
Most Common Occupations - Community and social service occupations (%)
Most Common Occupations - Legal occupations (%)
Most Common Occupations - Education, training, and library occupations (%)
Most Common Occupations - Arts, design, entertainment, sports, and media occupations (%)
Most Common Occupations - Healthcare practitioners and technical occupations (%)
Most Common Occupations - Health diagnosing and treating practitioners and other technical occupations (%)
Most Common Occupations - Health technologists and technicians (%)
Most Common Occupations - Service occupations (%)
Most Common Occupations - Healthcare support occupations (%)
Most Common Occupations - Protective service occupations (%)
Most Common Occupations - Fire fighting and prevention, and other protective service workers including supervisors (%)
Most Common Occupations - Law enforcement workers including supervisors (%)
Most Common Occupations - Food preparation and serving related occupations (%)
Most Common Occupations - Building and grounds cleaning and maintenance occupations (%)
Most Common Occupations - Personal care and service occupations (%)
Most Common Occupations - Sales and office occupations (%)
Most Common Occupations - Sales and related occupations (%)
Most Common Occupations - Office and administrative support occupations (%)
Most Common Occupations - Natural resources, construction, and maintenance occupations (%)
Most Common Occupations - Farming, fishing, and forestry occupations (%)
Most Common Occupations - Construction and extraction occupations (%)
Most Common Occupations - Installation, maintenance, and repair occupations (%)
Most Common Occupations - Production, transportation, and material moving occupations (%)
Most Common Occupations - Production occupations (%)
Most Common Occupations - Transportation occupations (%)
Most Common Occupations - Material moving occupations (%)
People in Group quarters - Institutionalized population (%)
People in Group quarters - Correctional institutions (%)
People in Group quarters - Federal prisons and detention centers (%)
People in Group quarters - Halfway houses (%)
People in Group quarters - Local jails and other confinement facilities (including police lockups) (%)
People in Group quarters - Military disciplinary barracks (%)
People in Group quarters - State prisons (%)
People in Group quarters - Other types of correctional institutions (%)
People in Group quarters - Nursing homes (%)
People in Group quarters - Hospitals/wards, hospices, and schools for the handicapped (%)
People in Group quarters - Hospitals/wards and hospices for chronically ill (%)
People in Group quarters - Hospices or homes for chronically ill (%)
People in Group quarters - Military hospitals or wards for chronically ill (%)
People in Group quarters - Other hospitals or wards for chronically ill (%)
People in Group quarters - Hospitals or wards for drug/alcohol abuse (%)
People in Group quarters - Mental (Psychiatric) hospitals or wards (%)
People in Group quarters - Schools, hospitals, or wards for the mentally retarded (%)
People in Group quarters - Schools, hospitals, or wards for the physically handicapped (%)
People in Group quarters - Institutions for the deaf (%)
People in Group quarters - Institutions for the blind (%)
People in Group quarters - Orthopedic wards and institutions for the physically handicapped (%)
People in Group quarters - Wards in general hospitals for patients who have no usual home elsewhere (%)
People in Group quarters - Wards in military hospitals for patients who have no usual home elsewhere (%)
People in Group quarters - Juvenile institutions (%)
People in Group quarters - Long-term care (%)
People in Group quarters - Homes for abused, dependent, and neglected children (%)
People in Group quarters - Residential treatment centers for emotionally disturbed children (%)
People in Group quarters - Training schools for juvenile delinquents (%)
People in Group quarters - Short-term care, detention or diagnostic centers for delinquent children (%)
People in Group quarters - Type of juvenile institution unknown (%)
People in Group quarters - Noninstitutionalized population (%)
People in Group quarters - College dormitories (includes college quarters off campus) (%)
People in Group quarters - Military quarters (%)
People in Group quarters - On base (%)
People in Group quarters - Barracks, unaccompanied personnel housing (UPH), (Enlisted/Officer), ;and similar group living quarters for military personnel (%)
People in Group quarters - Transient quarters for temporary residents (%)
People in Group quarters - Military ships (%)
People in Group quarters - Group homes (%)
People in Group quarters - Homes or halfway houses for drug/alcohol abuse (%)
People in Group quarters - Homes for the mentally ill (%)
People in Group quarters - Homes for the mentally retarded (%)
People in Group quarters - Homes for the physically handicapped (%)
People in Group quarters - Other group homes (%)
People in Group quarters - Religious group quarters (%)
People in Group quarters - Dormitories (%)
People in Group quarters - Agriculture workers' dormitories on farms (%)
People in Group quarters - Job Corps and vocational training facilities (%)
People in Group quarters - Other workers' dormitories (%)
People in Group quarters - Crews of maritime vessels (%)
People in Group quarters - Other nonhousehold living situations (%)
People in Group quarters - Other noninstitutional group quarters (%)
Residents speaking English at home (%)
Residents speaking English at home - Born in the United States (%)
Residents speaking English at home - Native, born elsewhere (%)
Residents speaking English at home - Foreign born (%)
Residents speaking Spanish at home (%)
Residents speaking Spanish at home - Born in the United States (%)
Residents speaking Spanish at home - Native, born elsewhere (%)
Residents speaking Spanish at home - Foreign born (%)
Residents speaking other language at home (%)
Residents speaking other language at home - Born in the United States (%)
Residents speaking other language at home - Native, born elsewhere (%)
Residents speaking other language at home - Foreign born (%)
Class of Workers - Employee of private company (%)
Class of Workers - Self-employed in own incorporated business (%)
Class of Workers - Private not-for-profit wage and salary workers (%)
Class of Workers - Local government workers (%)
Class of Workers - State government workers (%)
Class of Workers - Federal government workers (%)
Class of Workers - Self-employed workers in own not incorporated business and Unpaid family workers (%)
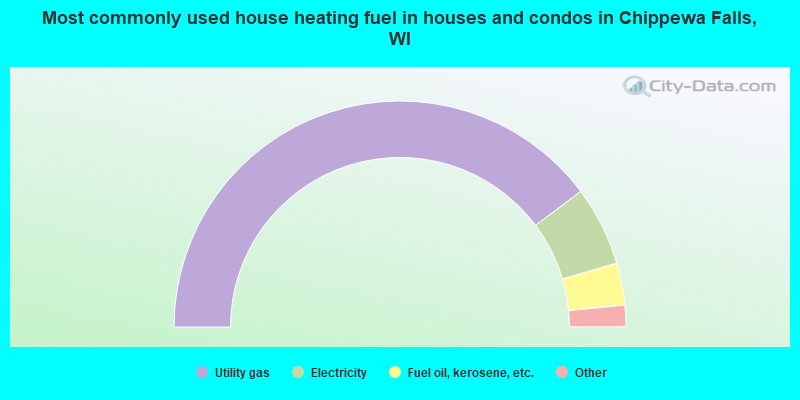
House heating fuel used in houses and condos - Utility gas (%)
House heating fuel used in houses and condos - Bottled, tank, or LP gas (%)
House heating fuel used in houses and condos - Electricity (%)
House heating fuel used in houses and condos - Fuel oil, kerosene, etc. (%)
House heating fuel used in houses and condos - Coal or coke (%)
House heating fuel used in houses and condos - Wood (%)
House heating fuel used in houses and condos - Solar energy (%)
House heating fuel used in houses and condos - Other fuel (%)
House heating fuel used in houses and condos - No fuel used (%)
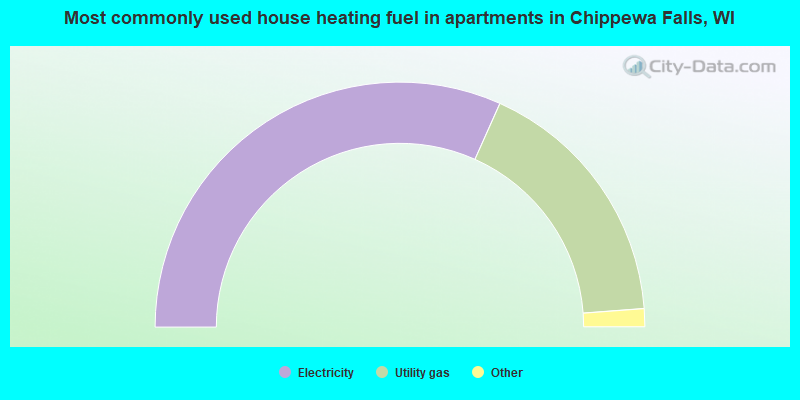
House heating fuel used in apartments - Utility gas (%)
House heating fuel used in apartments - Bottled, tank, or LP gas (%)
House heating fuel used in apartments - Electricity (%)
House heating fuel used in apartments - Fuel oil, kerosene, etc. (%)
House heating fuel used in apartments - Coal or coke (%)
House heating fuel used in apartments - Wood (%)
House heating fuel used in apartments - Solar energy (%)
House heating fuel used in apartments - Other fuel (%)
House heating fuel used in apartments - No fuel used (%)
Armed forces status - In Armed Forces (%)
Armed forces status - Civilian (%)
Armed forces status - Civilian - Veteran (%)
Armed forces status - Civilian - Nonveteran (%)
Fatal accidents locations in years 2005-2021
Fatal accidents locations in 2005
Fatal accidents locations in 2006
Fatal accidents locations in 2007
Fatal accidents locations in 2008
Fatal accidents locations in 2009
Fatal accidents locations in 2010
Fatal accidents locations in 2011
Fatal accidents locations in 2012
Fatal accidents locations in 2013
Fatal accidents locations in 2014
Fatal accidents locations in 2015
Fatal accidents locations in 2016
Fatal accidents locations in 2017
Fatal accidents locations in 2018
Fatal accidents locations in 2019
Fatal accidents locations in 2020
Fatal accidents locations in 2021
Alcohol use - People drinking some alcohol every month (%)
Alcohol use - People not drinking at all (%)
Alcohol use - Average days/month drinking alcohol
Alcohol use - Average drinks/week
Alcohol use - Average days/year people drink much
Audiometry - Average condition of hearing (%)
Audiometry - People that can hear a whisper from across a quiet room (%)
Audiometry - People that can hear normal voice from across a quiet room (%)
Audiometry - Ears ringing, roaring, buzzing (%)
Audiometry - Had a job exposure to loud noise (%)
Audiometry - Had off-work exposure to loud noise (%)
Blood Pressure & Cholesterol - Has high blood pressure (%)
Blood Pressure & Cholesterol - Checking blood pressure at home (%)
Blood Pressure & Cholesterol - Frequently checking blood cholesterol (%)
Blood Pressure & Cholesterol - Has high cholesterol level (%)
Consumer Behavior - Money monthly spent on food at supermarket/grocery store
Consumer Behavior - Money monthly spent on food at other stores
Consumer Behavior - Money monthly spent on eating out
Consumer Behavior - Money monthly spent on carryout/delivered foods
Consumer Behavior - Income spent on food at supermarket/grocery store (%)
Consumer Behavior - Income spent on food at other stores (%)
Consumer Behavior - Income spent on eating out (%)
Consumer Behavior - Income spent on carryout/delivered foods (%)
Current Health Status - General health condition (%)
Current Health Status - Blood donors (%)
Current Health Status - Has blood ever tested for HIV virus (%)
Current Health Status - Left-handed people (%)
Dermatology - People using sunscreen (%)
Diabetes - Diabetics (%)
Diabetes - Had a blood test for high blood sugar (%)
Diabetes - People taking insulin (%)
Diet Behavior & Nutrition - Diet health (%)
Diet Behavior & Nutrition - Milk product consumption (# of products/month)
Diet Behavior & Nutrition - Meals not home prepared (#/week)
Diet Behavior & Nutrition - Meals from fast food or pizza place (#/week)
Diet Behavior & Nutrition - Ready-to-eat foods (#/month)
Diet Behavior & Nutrition - Frozen meals/pizza (#/month)
Drug Use - People that ever used marijuana or hashish (%)
Drug Use - Ever used hard drugs (%)
Drug Use - Ever used any form of cocaine (%)
Drug Use - Ever used heroin (%)
Drug Use - Ever used methamphetamine (%)
Health Insurance - People covered by health insurance (%)
Kidney Conditions-Urology - Avg. # of times urinating at night
Medical Conditions - People with asthma (%)
Medical Conditions - People with anemia (%)
Medical Conditions - People with psoriasis (%)
Medical Conditions - People with overweight (%)
Medical Conditions - Elderly people having difficulties in thinking or remembering (%)
Medical Conditions - People who ever received blood transfusion (%)
Medical Conditions - People having trouble seeing even with glass/contacts (%)
Medical Conditions - People with arthritis (%)
Medical Conditions - People with gout (%)
Medical Conditions - People with congestive heart failure (%)
Medical Conditions - People with coronary heart disease (%)
Medical Conditions - People with angina pectoris (%)
Medical Conditions - People who ever had heart attack (%)
Medical Conditions - People who ever had stroke (%)
Medical Conditions - People with emphysema (%)
Medical Conditions - People with thyroid problem (%)
Medical Conditions - People with chronic bronchitis (%)
Medical Conditions - People with any liver condition (%)
Medical Conditions - People who ever had cancer or malignancy (%)
Mental Health - People who have little interest in doing things (%)
Mental Health - People feeling down, depressed, or hopeless (%)
Mental Health - People who have trouble sleeping or sleeping too much (%)
Mental Health - People feeling tired or having little energy (%)
Mental Health - People with poor appetite or overeating (%)
Mental Health - People feeling bad about themself (%)
Mental Health - People who have trouble concentrating on things (%)
Mental Health - People moving or speaking slowly or too fast (%)
Mental Health - People having thoughts they would be better off dead (%)
Oral Health - Average years since last visit a dentist
Oral Health - People embarrassed because of mouth (%)
Oral Health - People with gum disease (%)
Oral Health - General health of teeth and gums (%)
Oral Health - Average days a week using dental floss/device
Oral Health - Average days a week using mouthwash for dental problem
Oral Health - Average number of teeth
Pesticide Use - Households using pesticides to control insects (%)
Pesticide Use - Households using pesticides to kill weeds (%)
Physical Activity - People doing vigorous-intensity work activities (%)
Physical Activity - People doing moderate-intensity work activities (%)
Physical Activity - People walking or bicycling (%)
Physical Activity - People doing vigorous-intensity recreational activities (%)
Physical Activity - People doing moderate-intensity recreational activities (%)
Physical Activity - Average hours a day doing sedentary activities
Physical Activity - Average hours a day watching TV or videos
Physical Activity - Average hours a day using computer
Physical Functioning - People having limitations keeping them from working (%)
Physical Functioning - People limited in amount of work they can do (%)
Physical Functioning - People that need special equipment to walk (%)
Physical Functioning - People experiencing confusion/memory problems (%)
Physical Functioning - People requiring special healthcare equipment (%)
Prescription Medications - Average number of prescription medicines taking
Preventive Aspirin Use - Adults 40+ taking low-dose aspirin (%)
Reproductive Health - Vaginal deliveries (%)
Reproductive Health - Cesarean deliveries (%)
Reproductive Health - Deliveries resulted in a live birth (%)
Reproductive Health - Pregnancies resulted in a delivery (%)
Reproductive Health - Women breastfeeding newborns (%)
Reproductive Health - Women that had a hysterectomy (%)
Reproductive Health - Women that had both ovaries removed (%)
Reproductive Health - Women that have ever taken birth control pills (%)
Reproductive Health - Women taking birth control pills (%)
Reproductive Health - Women that have ever used Depo-Provera or injectables (%)
Reproductive Health - Women that have ever used female hormones (%)
Sexual Behavior - People 18+ that ever had sex (vaginal, anal, or oral) (%)
Sexual Behavior - Males 18+ that ever had vaginal sex with a woman (%)
Sexual Behavior - Males 18+ that ever performed oral sex on a woman (%)
Sexual Behavior - Males 18+ that ever had anal sex with a woman (%)
Sexual Behavior - Males 18+ that ever had any sex with a man (%)
Sexual Behavior - Females 18+ that ever had vaginal sex with a man (%)
Sexual Behavior - Females 18+ that ever performed oral sex on a man (%)
Sexual Behavior - Females 18+ that ever had anal sex with a man (%)
Sexual Behavior - Females 18+ that ever had any kind of sex with a woman (%)
Sexual Behavior - Average age people first had sex
Sexual Behavior - Average number of female sex partners in lifetime (males 18+)
Sexual Behavior - Average number of female vaginal sex partners in lifetime (males 18+)
Sexual Behavior - Average age people first performed oral sex on a woman (18+)
Sexual Behavior - Average number of woman performed oral sex on in lifetime (18+)
Sexual Behavior - Average number of male sex partners in lifetime (males 18+)
Sexual Behavior - Average number of male anal sex partners in lifetime (males 18+)
Sexual Behavior - Average age people first performed oral sex on a man (18+)
Sexual Behavior - Average number of male oral sex partners in lifetime (18+)
Sexual Behavior - People using protection when performing oral sex (%)
Sexual Behavior - Average number of times people have vaginal or anal sex a year
Sexual Behavior - People having sex without condom (%)
Sexual Behavior - Average number of male sex partners in lifetime (females 18+)
Sexual Behavior - Average number of male vaginal sex partners in lifetime (females 18+)
Sexual Behavior - Average number of female sex partners in lifetime (females 18+)
Sexual Behavior - Circumcised males 18+ (%)
Sleep Disorders - Average hours sleeping at night
Sleep Disorders - People that has trouble sleeping (%)
Smoking-Cigarette Use - People smoking cigarettes (%)
Taste & Smell - People 40+ having problems with smell (%)
Taste & Smell - People 40+ having problems with taste (%)
Taste & Smell - People 40+ that ever had wisdom teeth removed (%)
Taste & Smell - People 40+ that ever had tonsils teeth removed (%)
Taste & Smell - People 40+ that ever had a loss of consciousness because of a head injury (%)
Taste & Smell - People 40+ that ever had a broken nose or other serious injury to face or skull (%)
Taste & Smell - People 40+ that ever had two or more sinus infections (%)
Weight - Average height (inches)
Weight - Average weight (pounds)
Weight - Average BMI
Weight - People that are obese (%)
Weight - People that ever were obese (%)
Weight - People trying to lose weight (%)
Officers per 1,000 residents here:
1.59Wisconsin average:
2.11
Latest news from Chippewa Falls, WI collected exclusively by city-data.com from local newspapers, TV, and radio stations
Ancestries: German (30.4%), Norwegian (12.5%), American (7.0%), Irish (6.7%), English (3.4%), Czech (3.3%).
Current Local Time:
Land area: 10.9 square miles.
Population density: 1,350 people per square mile (low).
301 residents are foreign born (0.9% Asia , 0.4% Africa , 0.4% Europe , 0.3% Latin America ).
This city:
2.0%Wisconsin:
5.0%
Median real estate property taxes paid for housing units with mortgages in 2022: $2,703 (1.3%)Median real estate property taxes paid for housing units with no mortgage in 2022: $2,258 (1.4%)
Nearest city with pop. 50,000+: Eau Claire, WI
Nearest city with pop. 200,000+: St. Paul, MN
Nearest city with pop. 1,000,000+: Chicago, IL
Nearest cities:
Latitude: 44.93 N, Longitude: 91.39 W
Nickname or alias (official or unofficial): Naturally the World's Purest Water
Daytime population change due to commuting: +4,560 (+30.9%)Workers who live and work in this city: 3,500 (50.1%)
Chippewa Falls tourist attractions:
Single-family new house construction building permits:
2022: 8 buildings , average cost: $326,9002021: 11 buildings , average cost: $333,8002020: 16 buildings , average cost: $270,2002019: 20 buildings , average cost: $204,5002018: 17 buildings , average cost: $186,0002017: 12 buildings , average cost: $169,0002016: 15 buildings , average cost: $162,0002015: 9 buildings , average cost: $182,1002014: 7 buildings , average cost: $228,4002013: 10 buildings , average cost: $135,0002012: 5 buildings , average cost: $143,0002011: 4 buildings , average cost: $94,3002010: 7 buildings , average cost: $112,2002009: 4 buildings , average cost: $167,5002008: 7 buildings , average cost: $167,1002007: 14 buildings , average cost: $161,4002006: 20 buildings , average cost: $155,4002005: 24 buildings , average cost: $147,1002004: 17 buildings , average cost: $145,7002003: 14 buildings , average cost: $149,7002002: 17 buildings , average cost: $122,7002001: 20 buildings , average cost: $162,0002000: 9 buildings , average cost: $139,1001999: 19 buildings , average cost: $130,6001998: 40 buildings , average cost: $117,4001997: 37 buildings , average cost: $88,100Unemployment in December 2023:
Most common occupations in Chippewa Falls, WI (%)
Both Males Females
Other production occupations, including supervisors (8.4%)
Metal workers and plastic workers (4.3%)
Nursing, psychiatric, and home health aides (3.8%)
Assemblers and fabricators (3.3%)
Material recording, scheduling, dispatching, and distributing workers (3.3%)
Other management occupations, except farmers and farm managers (3.3%)
Other office and administrative support workers, including supervisors (3.1%)
Other production occupations, including supervisors (11.7%)
Metal workers and plastic workers (7.0%)
Building and grounds cleaning and maintenance occupations (4.2%)
Driver/sales workers and truck drivers (4.0%)
Engineers (3.7%)
Other sales and related occupations, including supervisors (3.6%)
Material recording, scheduling, dispatching, and distributing workers (3.6%)
Nursing, psychiatric, and home health aides (7.3%)
Other office and administrative support workers, including supervisors (5.1%)
Other production occupations, including supervisors (5.1%)
Secretaries and administrative assistants (5.0%)
Information and record clerks, except customer service representatives (4.9%)
Assemblers and fabricators (4.3%)
Customer service representatives (3.8%)
Air pollution and air quality trends(lower is better)
AQI PM10 PM2.5
Tornado activity:
Chippewa Falls-area historical tornado activity is near Wisconsin state average. It is 7% greater than the overall U.S. average.
On 6/4/1958, a category F5 (max. wind speeds 261-318 mph) tornado 15.7 miles away from the Chippewa Falls city center killed 21 people and injured 74 people and caused between $5,000,000 and $50,000,000 in damages.
On 6/4/1958, a category F4 (max. wind speeds 207-260 mph) tornado 3.8 miles away from the city center killed 3 people and injured 50 people and caused between $50,000 and $500,000 in damages.
Earthquake activity:
Chippewa Falls-area historical earthquake activity is significantly above Wisconsin state average. It is 70% smaller than the overall U.S. average. On 7/9/1975 at 14:54:15, a magnitude 4.6 (4.6 MB, Class: Light, Intensity: IV - V) earthquake occurred 231.7 miles away from the city center On 6/5/1993 at 01:24:53, a magnitude 4.1 (4.1 LG, Depth: 6.2 mi) earthquake occurred 243.8 miles away from the city center On 6/28/2004 at 06:10:52, a magnitude 4.2 (4.2 MW, Depth: 6.2 mi) earthquake occurred 271.2 miles away from Chippewa Falls center On 2/10/2010 at 09:59:35, a magnitude 3.8 (3.8 MW, Depth: 6.2 mi, Class: Light, Intensity: II - III) earthquake occurred 251.3 miles away from Chippewa Falls center On 3/4/1983 at 06:32:18, a magnitude 4.6 (4.4 MB, 4.6 LG, 4.4 ML) earthquake occurred 397.9 miles away from the city center On 2/7/2020 at 18:30:28, a magnitude 3.3 (3.3 ML) earthquake occurred 187.2 miles away from Chippewa Falls center Magnitude types: regional Lg-wave magnitude (LG), body-wave magnitude (MB), local magnitude (ML), moment magnitude (MW) Natural disasters: The number of natural disasters in Chippewa County (10) is smaller than the US average (15).Major Disasters (Presidential) Declared: 8Emergencies Declared: 2Floods: 7, Storms: 6, Tornadoes: 2, Drought: 1, Hurricane: 1, Mudslide: 1, Other: 1 (Note: some incidents may be assigned to more than one category). Hospitals and medical centers in Chippewa Falls: NORTHERN WI CTR FDD (2820 E PARK AVE PO BOX 340) ST JOSEPHS HSPTL (Voluntary non-profit - Church, 2661 CTY HWY I) CHIPPEWA MANOR NURSING HOME (222 CHAPMAN RD)
RUTLEDGE HOME (300 BRIDGEWATER AVE)
WISSOTA HEALTH AND REGIONAL VENT CENTER (2815 COUNTY HIGHWAY I)
SACRED HEART DIALYSIS AT ST JOSEPHS HOSP (2661 COUNTY TRUNK I)
CHIPPEWA CTY PUBLIC HLTH (711 N BRIDGE ST RM 222)
NORTHWEST WI HOMECARE (4033 123RD STREET)
Amtrak station near Chippewa Falls: 10 miles: EAU CLARE (101 N. FARWELL ST.) - Bus Station Services: enclosed waiting area, public restrooms, public payphones.
Colleges/universities with over 2000 students nearest to Chippewa Falls:
University of Wisconsin-Eau Claire (about 11 miles; Eau Claire, WI ; Full-time enrollment: 10,143)
Chippewa Valley Technical College (about 12 miles; Eau Claire, WI ; FT enrollment: 4,038)
University of Wisconsin-Stout (about 27 miles; Menomonie, WI ; FT enrollment: 8,120)
University of Wisconsin-River Falls (about 61 miles; River Falls, WI ; FT enrollment: 5,868)
Wisconsin Indianhead Technical College (about 62 miles; Shell Lake, WI ; FT enrollment: 2,414)
Winona State University (about 63 miles; Winona, MN ; FT enrollment: 8,397)
Saint Mary's University of Minnesota (about 64 miles; Winona, MN ; FT enrollment: 4,022)
Public high schools in Chippewa Falls: CHIPPEWA FALLS HIGH Students: 1,452, Location: 735 TERRILL ST, Grades: 9-12)NORTHERN WISCONSIN CENTER Location: 2820 E PARK AVE, Grades: KG-12)
Private high school in Chippewa Falls: MCDONELL CENTRAL CATHOLIC HIGH SCHOOL Students: 146, Location: 1316 BEL AIR BLVD, Grades: 9-12)
Public elementary/middle schools in Chippewa Falls: CHIPPEWA FALLS MIDDLE Students: 1,046, Location: 750 TROPICANA BLVD, Grades: 6-8)STILLSON ELEMENTARY Students: 392, Location: 17250 COUNTY HIGHWAY J, Grades: KG-5)HALMSTAD ELEMENTARY Students: 347, Location: 565 E SOUTH AVE, Grades: KG-5)SOUTHVIEW ELEMENTARY Students: 323, Location: 615 A ST, Grades: PK-5)HILLCREST ELEMENTARY Location: 1200 MILES ST, Grades: KG-5)
PARKVIEW ELEMENTARY Location: 501 JEFFERSON AVE, Grades: KG-5)
Private elementary/middle schools in Chippewa Falls: ST CHARLES BORROMEO PRIMARY SCHOOL Students: 179, Location: 1316 BEL AIR BLVD, Grades: PK-2)
NOTRE DAME MIDDLE SCHOOL Students: 92, Location: 1316 BEL AIR BLVD, Grades: 6-8)
HOLY GHOST SCHOOL Students: 78, Location: 436 S MAIN ST, Grades: 3-5)
ST PETER ELEMENTARY SCHOOL Students: 67, Location: 11370 COUNTY HIGHWAY Q, Grades: 1-8)
CHRIST LUTHERAN SCHOOL Students: 66, Location: 467 E COLOME ST, Grades: PK-7)
See full list of schools located in Chippewa Falls Library in Chippewa Falls: CHIPPEWA FALLS PUBLIC LIBRARY Operating income: $984,569; Location: 105 W. CENTRAL ST.; 90,897 books ; 4,723 e-books ; 12,459 audio materials ; 6,097 video materials ; 3 local licensed databases ; 28 state licensed databases ; 7 other licensed databases ; 190 print serial subscriptions )
Notable locations in Chippewa Falls: (A) , Hannah M Rutledge Home for the Aged (B) , Cook Rutledge Historical Mansion (C) , Chippewa Falls Public Library (D) , Chippewa Falls City Hall (E) , Chippewa County Jail (F) , Chippewa County Courthouse (G) , Chippewa Falls Fire Department and Emergency Services Station 2 (H) , Chippewa Falls Fire Department and Emergency Services Station 1 (I) . Display/hide their locations on the map
Churches in Chippewa Falls include: (A) , Christ Church (B) , Christ Episcopal Church (C) , Christian Gospel Chapel (D) , Faith Lutheran Church (E) , First Assembly of God Church (F) , First Presbyterian Church (G) , Holy Ghost Roman Catholic Church (H) , Saint Charles Borromeo Catholic Church (I) . Display/hide their locations on the map
Cemeteries: (1) , Hope Cemetery (2) , Forest Hill Cemetery (3) , Calvary Cemetery (4) . Display/hide their locations on the map
Reservoirs: (A) , Chippewa Falls Flowage 5555 (B) , Glen Loch Flowage 116.5 (C) , Glen Lock Lake (D) . Display/hide their locations on the map
Creek: (A) . Display/hide its location on the map
Parks in Chippewa Falls include: (1) , Northern Wisconsin State Fairgrounds (2) . Display/hide their locations on the map
Tourist attractions: (1) , Chippewa Falls Museum of Industry & Technology (21 East Grand Avenue) (2) , Cook Rutledge Mansion (Historical Places & Services; 505 West Grand Avenue) (3) , Betty Larson Tours Inc (Tours & Charters; 100 North Bridge Street Suite 104) (4) , Krumenauer Kevin W (Tours & Charters; 16529 County Highway J) (5) , Chippewa Trails - Charter Reservations (Tours & Charters; 510 East South Avenue) (6) . Display/hide their approximate locations on the map
Hotels: (1) , Deluxe Motel (1727 County Highway J) (2) , Country Villa Motel (10765 County Highway Q) (3) , Badger Motel (12181 County Highway Oo) (4) , Country Inn - Chippewa Falls (1021 West Park Avenue) (5) , Indianhead Motel (501 Summit Avenue) (6) , Lake Wissota Inn (5732 183rd Street) (7) , Americlnn Motel (11 West South Avenue) (8) , Americinn of Chippewa (11 West South Avenue) (9) . Display/hide their approximate locations on the map
Court: (1) . Display/hide its approximate location on the map
Birthplace of: Seymour Cray - Applied mathematician, Gene Ellenson - College football player, Gus Dorais - Football player and coach, Judy Henske - Folk singer, Leo Macdonell - Sportswriter, Wayne Grudem - Theologian, Alexander Wiley - Politician, Charles E. Mower - Army Medal of Honor recipient, Eddy Waller - Actor, Howard Luedtke - Male singer.
Chippewa County has a predicted average indoor radon screening level between 2 and 4 pCi/L (pico curies per liter) - Moderate Potential Drinking water stations with addresses in Chippewa Falls and their reported violations in the past:
CHIPPEWA FALLS WATERWORKS (Population served: 13,375, Groundwater):
Past monitoring violations:
123 regular monitoring violations
Address: 13033 30TH AVE Population served: 6,534, Groundwater):
Past health violations:
MCL, Monthly (TCR) - In OCT-2009, Contaminant: Coliform. Follow-up actions: St Public Notif requested (OCT-21-2009), St Violation/Reminder Notice (OCT-21-2009), St Compliance achieved (OCT-24-2009), St Public Notif received (OCT-27-2009)
MCL, Monthly (TCR) - In JUL-2008, Contaminant: Coliform. Follow-up actions: St Public Notif requested (JUL-10-2008), St Boil Water Order (JUL-10-2008), St Violation/Reminder Notice (JUL-10-2008), St Compliance achieved (JUL-12-2008), St Other (JUL-14-2008), St Public Notif received (JUL-17-2008)
MCL, Monthly (TCR) - In JUL-2006, Contaminant: Coliform. Follow-up actions: St Public Notif requested (JUL-19-2006), St Violation/Reminder Notice (JUL-19-2006), St Public Notif received (JUL-20-2006), St Boil Water Order (JUL-20-2006), St Compliance achieved (JUL-22-2006)
Past monitoring violations:
One regular monitoring violation
Population served: 126, Groundwater):
Past monitoring violations:
Lead Consumer Notice - In JAN-01-2013, Contaminant: Lead and Copper Rule. Follow-up actions: St Other (JAN-18-2013), St Compliance achieved (DEC-17-2013)
Population served: 83, Groundwater):
Past health violations:
MCL, Monthly (TCR) - In OCT-2007, Contaminant: Coliform. Follow-up actions: St Boil Water Order (OCT-05-2007), St Public Notif requested (OCT-08-2007), St Violation/Reminder Notice (OCT-08-2007), St Compliance achieved (OCT-10-2007), St Public Notif received (OCT-11-2007)
MCL, Monthly (TCR) - In AUG-2007, Contaminant: Coliform. Follow-up actions: St Public Notif requested (AUG-23-2007), St Violation/Reminder Notice (AUG-23-2007), St Boil Water Order (AUG-23-2007), St Public Notif received (AUG-30-2007), St Compliance achieved (SEP-06-2007)
Population served: 70, Groundwater):
Past monitoring violations:
Lead Consumer Notice - In JAN-01-2013, Contaminant: Lead and Copper Rule. Follow-up actions: St Other (JAN-18-2013), St Compliance achieved (MAR-08-2013)
4 regular monitoring violations
Population served: 51, Groundwater):
Past health violations:
MCL, Monthly (TCR) - In OCT-2012, Contaminant: Coliform. Follow-up actions: St Public Notif received (NOV-02-2012), St Violation/Reminder Notice (NOV-02-2012), St Boil Water Order (NOV-02-2012), St Public Notif requested (NOV-02-2012), St Compliance achieved (NOV-14-2012)
MCL, Monthly (TCR) - In AUG-2011, Contaminant: Coliform. Follow-up actions: St Boil Water Order (AUG-23-2011), St Violation/Reminder Notice (AUG-23-2011), St Public Notif requested (AUG-23-2011), St Public Notif received (AUG-26-2011), St Compliance achieved (SEP-01-2011)
Past monitoring violations:
Lead Consumer Notice - In JAN-01-2013, Contaminant: Lead and Copper Rule. Follow-up actions: St Other (JAN-18-2013), St Compliance achieved (MAR-08-2013)
Monitoring, Source Water (GWR) - In SEP-2011, Contaminant: E. COLI. Follow-up actions: St Public Notif requested (OCT-21-2011), St Violation/Reminder Notice (OCT-21-2011), St Public Notif received (OCT-21-2011), St Compliance achieved (OCT-24-2011)
Monitoring, Repeat Major (TCR) - Between JUL-2011 and SEP-2011, Contaminant: Coliform (TCR). Follow-up actions: St Public Notif requested (OCT-21-2011), St Violation/Reminder Notice (OCT-21-2011), St Public Notif received (OCT-21-2011), St Compliance achieved (OCT-24-2011)
Population served: 50, Groundwater):
Past health violations:
MCL, Monthly (TCR) - In OCT-2006, Contaminant: Coliform. Follow-up actions: St Violation/Reminder Notice (OCT-13-2006), St Boil Water Order (OCT-13-2006), St Public Notif requested (OCT-13-2006), St Public Notif received (OCT-16-2006), St Other (JAN-08-2007), St Tech Assistance Visit (FEB-08-2007), St Compliance achieved (MAR-13-2007)
Population served: 25, Groundwater):
Past health violations:
MCL, Monthly (TCR) - In SEP-2008, Contaminant: Coliform. Follow-up actions: St Public Notif requested (SEP-12-2008), St Violation/Reminder Notice (SEP-12-2008), St Public Notif received (SEP-12-2008), St Compliance achieved (SEP-30-2008)
Drinking water stations with addresses in Chippewa Falls that have no violations reported:
WISSOTA EXPRESS (Population served: 400, Primary Water Source Type: Groundwater)
OJIBWA GOLF & BOWL (Population served: 150, Primary Water Source Type: Groundwater)
LOOPYS (Population served: 100, Primary Water Source Type: Groundwater)
MALLARD RESORT 2 - CABINS (Population served: 80, Primary Water Source Type: Groundwater)
RIVER INN BOTTOMS UP (Population served: 75, Primary Water Source Type: Groundwater)
TOWN & COUNTRY SALOON (Population served: 75, Primary Water Source Type: Groundwater)
MALLARD RESORT 1 -BAR (Population served: 75, Primary Water Source Type: Groundwater)
NORMAS (Address: 3077 CTY. RD. OO Population served: 60, Primary Water Source Type: Groundwater)
PINE HARBOR CMPGD RES & CMPGD WELL (Population served: 50, Primary Water Source Type: Groundwater)
SHERRI JOS WAYSIDE (Population served: 50, Primary Water Source Type: Groundwater)
Average household size: This city:
2.2 peopleWisconsin:
2.4 people
Percentage of family households: This city:
55.5%Whole state:
64.4%
Percentage of households with unmarried partners: This city:
8.4%Whole state:
7.3%
Likely homosexual households (counted as self-reported same-sex unmarried-partner households)
Lesbian couples: 0.2% of all households Gay men: 0.2% of all households
People in group quarters in Chippewa Falls in 2010:
485 people in state prisons
141 people in local jails and other municipal confinement facilities
60 people in other noninstitutional facilities
51 people in nursing facilities/skilled-nursing facilities
38 people in group homes intended for adults
36 people in emergency and transitional shelters (with sleeping facilities) for people experiencing homelessness
10 people in residential schools for people with disabilities
4 people in group homes for juveniles (non-correctional)
People in group quarters in Chippewa Falls in 2000:
210 people in schools, hospitals, or wards for the intellectually disabled
159 people in nursing homes
71 people in local jails and other confinement facilities (including police lockups)
19 people in other noninstitutional group quarters
14 people in homes or halfway houses for drug/alcohol abuse
14 people in homes for the mentally ill
8 people in homes for the mentally retarded
5 people in other group homes
4 people in religious group quarters
Banks with most branches in Chippewa Falls (2011 data):
Northwestern Bank: at 202 Bridge Street, branch established on 1904/01/01; Chippewa Drive-Up Branch at 20 East Central Street, branch established on 1962/09/10. Info updated 2006/11/03: Bank assets: $376.9 mil, Deposits: $318.6 mil, local headquarters , positive income , Commercial Lending Specialization, 7 total offices , Holding Company: Nw Bancshares, Inc.
Citizens State Bank: Chippewa Falls Branch at 15036 Cty Hwy S, branch established on 1985/11/04; County Trunk J Branch at 17153 County Trynk J, branch established on 1968/09/16. Info updated 2006/11/03: Bank assets: $104.3 mil, Deposits: $93.7 mil, headquarters in Cadott, WI, positive income , Commercial Lending Specialization, 4 total offices , Holding Company: Citizens Bancorp, Inc.
Bank Mutual: Chippewa Falls Branch at 303 Prairie View Road, branch established on 1997/04/01; 35 W Columbia St Branch at 35 W Columbia St, branch established on 1943/09/01. Info updated 2011/07/21: Bank assets: $2,497.0 mil, Deposits: $2,046.0 mil, headquarters in Brown Deer, WI, negative income in the last year , Mortgage Lending Specialization, 79 total offices
AnchorBank, fsb: Chippewa Falls Branch at 302 Bay St, branch established on 1902/01/01. Info updated 2011/07/21: Bank assets: $3,067.4 mil, Deposits: $2,481.9 mil, headquarters in Madison, WI, negative income in the last year , Commercial Lending Specialization, 56 total offices
U.S. Bank National Association: Eau Claire Hallie Branch at 1660 County Highway J, branch established on 1968/05/29. Info updated 2012/01/30: Bank assets: $330,470.8 mil, Deposits: $236,091.5 mil, headquarters in Cincinnati, OH, positive income , 3121 total offices , Holding Company: U.S. Bancorp
Citizens Community Federal: Chippewa Falls Branch at 2786 Commercial Blvd, branch established on 1990/06/13. Info updated 2011/07/21: Bank assets: $530.8 mil, Deposits: $444.7 mil, headquarters in Eau Claire, WI, positive income , Mortgage Lending Specialization, 28 total offices
BMO Harris Bank National Association: Chippewa Falls Branch at 411 North Bridge Street, branch established on 1873/05/01. Info updated 2011/07/14: Bank assets: $97,264.0 mil, Deposits: $75,624.6 mil, headquarters in Chicago, IL, positive income , 717 total offices , Holding Company: Bank Of Montreal
Independence State Bank: Chippewa Falls Branch at 2495 Commercial Boulevard, branch established on 2006/11/16. Info updated 2006/11/01: Bank assets: $65.6 mil, Deposits: $59.1 mil, headquarters in Independence, WI, positive income , Agricultural Specialization, 3 total offices , Holding Company: Northern Financial Corporation
Associated Bank, National Association: Chippewa Falls Gordys Branch at 212 Bay Street, branch established on 2004/06/30. Info updated 2008/09/12: Bank assets: $21,715.0 mil, Deposits: $15,244.4 mil, headquarters in Green Bay, WI, positive income , Commercial Lending Specialization, 282 total offices , Holding Company: Associated Banc-Corp
For population 15 years and over in Chippewa Falls:
Never married: 38.9%Now married: 36.9%Separated: 1.0%Widowed: 8.4%Divorced: 14.8% For population 25 years and over in Chippewa Falls:
High school or higher: 91.7%Bachelor's degree or higher: 20.9%Graduate or professional degree: 5.9%Unemployed: 5.4%Mean travel time to work (commute): 18.9 minutes
Education Gini index (Inequality in education) Here:
9.3Wisconsin average:
10.4
Religion statistics for Chippewa Falls, WI (based on Chippewa County data)
Religion Adherents Congregations Catholic 14,850 12 Mainline Protestant 7,989 28 Evangelical Protestant 6,296 42 Other 201 4 Orthodox 25 1 None 33,054 -
Source: Clifford Grammich, Kirk Hadaway, Richard Houseal, Dale E.Jones, Alexei Krindatch, Richie Stanley and Richard H.Taylor. 2012. 2010 U.S.Religion Census: Religious Congregations & Membership Study. Association of Statisticians of American Religious Bodies. Jones, Dale E., et al. 2002. Congregations and Membership in the United States 2000. Nashville, TN: Glenmary Research Center. Graphs represent county-level data
Food Environment Statistics: Number of grocery stores : 12This county :
2.00 / 10,000 pop.Wisconsin :
1.86 / 10,000 pop.
Number of supercenters and club stores : 1Chippewa County :
0.17 / 10,000 pop.Wisconsin :
0.11 / 10,000 pop.
Number of convenience stores (no gas) : 3This county :
0.50 / 10,000 pop.State :
0.38 / 10,000 pop.
Number of convenience stores (with gas) : 29Chippewa County :
4.83 / 10,000 pop.State :
4.12 / 10,000 pop.
Number of full-service restaurants : 52Chippewa County :
8.67 / 10,000 pop.Wisconsin :
8.64 / 10,000 pop.
Adult obesity rate : Chippewa County :
28.4%Wisconsin :
27.5%
Low-income preschool obesity rate : Here :
11.5%Wisconsin :
13.0%
Health and Nutrition: Healthy diet rate : This city:
56.7%Wisconsin:
49.5%
Average overall health of teeth and gums : This city:
57.2%Wisconsin:
46.6%
People feeling badly about themselves : Chippewa Falls:
17.9%Wisconsin:
21.4%
People not drinking alcohol at all : Chippewa Falls:
7.5%State:
10.2%
Average hours sleeping at night : Overweight people : Here:
32.2%Wisconsin:
34.0%
General health condition : Chippewa Falls:
63.6%State:
56.3%
Average condition of hearing : This city:
80.8%State:
78.5%
More about Health and Nutrition of Chippewa Falls, WI Residents
Local government employment and payroll (March 2022)
Function
Full-time employees
Monthly full-time payroll
Average yearly full-time wage
Part-time employees
Monthly part-time payroll
Firefighters
27 $174,766 $77,674 0 $0 Police Protection - Officers
23 $140,184 $73,139 0 $0 Streets and Highways
16 $114,089 $85,567 1 $2,661 Local Libraries
12 $46,319 $46,319 5 $4,547 Other Government Administration
11 $16,684 $18,201 7 $2,849 Parks and Recreation
9 $40,920 $54,560 6 $991 Police - Other
3 $12,288 $49,152 1 $1,969 Financial Administration
3 $16,899 $67,596 0 $0 Other and Unallocable
2 $11,792 $70,752 8 $1,438 Fire - Other
0 $0 1 $2,454
Totals for Government
106 $573,941 $64,974 29 $16,909
Chippewa Falls government finances - Expenditure in 2021 (per resident):
Construction - Regular Highways: $1,205,000 ($82.28)
Police Protection: $398,000 ($27.18)Parks and Recreation: $109,000 ($7.44)General - Other: $56,000 ($3.82)Health - Other: $33,000 ($2.25)Local Fire Protection: $13,000 ($0.89)Current Operations - Local Fire Protection: $3,329,000 ($227.31)
Police Protection: $2,957,000 ($201.91)Regular Highways: $2,405,000 ($164.22)Water Utilities: $2,350,000 ($160.46)Sewerage: $2,349,000 ($160.40)General - Other: $1,967,000 ($134.31)Parks and Recreation: $1,134,000 ($77.43)Libraries: $1,066,000 ($72.79)Central Staff Services: $481,000 ($32.84)Financial Administration: $391,000 ($26.70)Transit Utilities: $384,000 ($26.22)Solid Waste Management: $274,000 ($18.71)General Public Buildings: $130,000 ($8.88)Protective Inspection and Regulation - Other: $123,000 ($8.40)Natural Resources - Other: $121,000 ($8.26)Judicial and Legal Services: $82,000 ($5.60)Housing and Community Development: $70,000 ($4.78)Health - Other: $18,000 ($1.23)General - Interest on Debt: $1,068,000 ($72.93)
Other Capital Outlay - Regular Highways: $248,000 ($16.93)
Transit Utilities: $156,000 ($10.65)
Chippewa Falls government finances - Revenue in 2021 (per resident):
Charges - Sewerage: $2,380,000 ($162.51)
Other: $1,121,000 ($76.54)Regular Highways: $606,000 ($41.38)Solid Waste Management: $267,000 ($18.23)Parks and Recreation: $16,000 ($1.09)Federal Intergovernmental - Other: $1,000 ($0.07)
Local Intergovernmental - Other: $835,000 ($57.02)
Sewerage: $191,000 ($13.04)Health and Hospitals: $162,000 ($11.06)Miscellaneous - General Revenue - Other: $1,497,000 ($102.22)
Donations From Private Sources: $488,000 ($33.32)Special Assessments: $234,000 ($15.98)Interest Earnings: $179,000 ($12.22)Sale of Property: $83,000 ($5.67)Fines and Forfeits: $76,000 ($5.19)Rents: $5,000 ($0.34)Revenue - Water Utilities: $2,409,000 ($164.49)
Transit Utilities: $2,000 ($0.14)State Intergovernmental - General Local Government Support: $4,164,000 ($284.33)
Highways: $736,000 ($50.26)Transit Utilities: $383,000 ($26.15)Education: $378,000 ($25.81)Other: $309,000 ($21.10)Tax - Property: $11,145,000 ($761.01)
Other License: $250,000 ($17.07)Occupation and Business License - Other: $178,000 ($12.15)Other Selective Sales: $152,000 ($10.38)Other: $29,000 ($1.98)
Chippewa Falls government finances - Debt in 2021 (per resident):
Long Term Debt - Beginning Outstanding - Unspecified Public Purpose: $38,039,000 ($2597.41)
Outstanding Unspecified Public Purpose: $37,832,000 ($2583.27)Retired Unspecified Public Purpose: $6,752,000 ($461.04)Issue, Unspecified Public Purpose: $6,545,000 ($446.91)Beginning Outstanding - Public Debt for Private Purpose: $3,904,000 ($266.58)Outstanding Nonguaranteed - Industrial Revenue: $3,646,000 ($248.96)Retired Nonguaranteed - Public Debt for Private Purpose: $259,000 ($17.69)Short Term Debt Outstanding - Beginning: $4,889,000 ($333.83)
End of Fiscal Year: $4,405,000 ($300.79)
Chippewa Falls government finances - Cash and Securities in 2021 (per resident):
Sinking Funds - Cash and Securities: $3,646,000 ($248.96)
Businesses in Chippewa Falls, WI
Name Count Name Count
ALDI 1 Kmart 1 AT&T 1 Lane Furniture 1 Advance Auto Parts 1 MasterBrand Cabinets 2 AmericInn 1 Mazda 1 Arby's 2 McDonald's 1 Blockbuster 1 Nike 1 Burger King 2 Pizza Hut 1 Curves 1 Subway 4 Dairy Queen 1 Toyota 1 Domino's Pizza 1 True Value 2 Fashion Bug 1 U-Haul 1 FedEx 1 UPS 4 GNC 1 Verizon Wireless 1 GameStop 1 Walgreens 1 H&R Block 1 Walmart 1 Holiday Inn 1 Wendy's 1 Jones New York 1 YMCA 1 KFC 1
Strongest AM radio stations in Chippewa Falls:
WEAQ (1150 AM; 5 kW; CHIPPEWA FALLS, WI; Owner: MAVERICK MEDIA OF EAU CLAIRE LICENSE LLC)
WOGO (680 AM; 2 kW; HALLIE, WI; Owner: STEWARDS OF SOUND, INC.)
WAYY (790 AM; 5 kW; EAU CLAIRE, WI; Owner: MAVERICK MEDIA OF EAU CLAIRE LICENSE LLC)
WMEQ (880 AM; 10 kW; MENOMONIE, WI; Owner: CAPSTAR TX LIMITED PARTNERSHIP)
WCTS (1030 AM; 50 kW; MAPLEWOOD, MN; Owner: CNTL. BAPT. THEO/AL SEMI MINNEAPOLIS)
WDVM (1050 AM; 1 kW; EAU CLAIRE, WI; Owner: STARBOARD BROADCASTING, INC.)
WBIZ (1400 AM; 1 kW; EAU CLAIRE, WI; Owner: CAPSTAR TX LIMITED PARTNERSHIP)
WCCO (830 AM; 50 kW; MINNEAPOLIS, MN; Owner: INFINITY MEDIA CORPORATION)
WSPT (1010 AM; 50 kW; STEVENS POINT, WI)
WEBC (560 AM; 50 kW; DULUTH, MN)
KSTP (1500 AM; 50 kW; ST. PAUL, MN; Owner: KSTP-AM, LLC (DELAWARE))
KTIS (900 AM; 25 kW; MINNEAPOLIS, MN; Owner: NORTHWESTERN COLLEGE)
KFAN (1130 AM; 50 kW; MINNEAPOLIS, MN; Owner: AMFM RADIO LICENSES, L.L.C.)
Strongest FM radio stations in Chippewa Falls:
WVCF (90.5 FM; EAU CLAIRE, WI; Owner: VCY AMERICA, INC.)
WQRB (95.1 FM; BLOOMER, WI; Owner: CAPSTAR TX LIMITED PARTNERSHIP)
WUEC (89.7 FM; EAU CLAIRE, WI; Owner: BOARD OF REGENTS, UNIVERSITY OF WISCONSIN SYSTEM)
W256AE (99.1 FM; CHIPPEWA FALLS, WI; Owner: BUSHLAND RADIO SPECIALTIES/ WCFW)
WWIB (103.7 FM; HALLIE, WI; Owner: STEWARDS OF SOUND, INC.)
WCFW (105.7 FM; CHIPPEWA FALLS, WI; Owner: BUSHLAND RADIO SPECIALTIES/WCFW)
WIAL (94.1 FM; EAU CLAIRE, WI; Owner: MAVERICK MEDIA OF EAU CLAIRE LICENSE LLC)
WBIZ-FM (100.7 FM; EAU CLAIRE, WI; Owner: CAPSTAR TX LIMITED PARTNERSHIP)
WAXX (104.5 FM; EAU CLAIRE, WI; Owner: MAVERICK MEDIA OF EAU CLAIRE LICENSE LLC)
WECL (92.9 FM; ELK MOUND, WI; Owner: MAVERICK MEDIA OF EAU CLAIRE LICENSE LLC)
WMEQ-FM (92.1 FM; MENOMONIE, WI; Owner: CAPSTAR TX LIMITED PARTNERSHIP)
WHWC (88.3 FM; MENOMONIE, WI; Owner: STATE OF WISCONSIN - EDUCATIONAL COMMUNICATIONS BOARD)
WISM-FM (98.1 FM; ALTOONA, WI; Owner: CLEAR CHANNEL BROADCASTING LICENSES, INC.)
WHEM (91.3 FM; EAU CLAIRE, WI; Owner: FOURTH DIMENSION, INC.)
WDRK (99.9 FM; CORNELL, WI; Owner: MAVERICK MEDIA OF EAU CLAIRE LICENSE LLC)
WATQ (106.7 FM; CHETEK, WI; Owner: CAPSTAR TX LIMITED PARTNERSHIP)
W206AH (89.1 FM; EAU CLAIRE, WI; Owner: FAMILY STATIONS, INC.)
TV broadcast stations around Chippewa Falls:
WQOW-TV (Channel 18; EAU CLAIRE, WI; Owner: WXOW-WQOW TELEVISION, INC.)
WEAU-TV (Channel 13; EAU CLAIRE, WI; Owner: WEAU LICENSEE CORP.)
WHWC-TV (Channel 28; MENOMONIE, WI; Owner: STATE OF WISCONSIN - EDUCATIONAL COMMUNICATIONS BOARD)
WEUX (Channel 48; CHIPPEWA FALLS, WI; Owner: GRANT MEDIA INC.)
Medal of Honor Recipients
Medal of Honor Recipient born in Chippewa Falls: Charles E. Mower.
National Bridge Inventory (NBI) Statistics 37 Number of bridges889ft / 271m Total length $12,838,000 Total costs207,980 Total average daily traffic13,002 Total average daily truck traffic
New bridges - historical statistics
2 1910-1919 1 1920-1929 2 1930-1939 1 1950-1959 3 1960-1969 10 1970-1979 1 1980-1989 11 1990-1999 6 2000-2009
See full National Bridge Inventory statistics for Chippewa Falls, WI
Home Mortgage Disclosure Act Aggregated Statistics For Year 2009(Based on 4 partial tracts) A) FHA, FSA/RHS & VA B) Conventional C) Refinancings D) Home Improvement Loans E) Loans on Dwellings For 5+ Families F) Non-occupant Loans on G) Loans On Manufactured Number Average Value Number Average Value Number Average Value Number Average Value Number Average Value Number Average Value Number Average Value
LOANS ORIGINATED 36 $112,986 56 $106,999 272 $124,738 18 $49,707 3 $693,177 39 $154,156 1 $39,200 APPLICATIONS APPROVED, NOT ACCEPTED 1 $225,670 6 $79,020 44 $123,672 2 $77,590 0 $0 4 $80,215 0 $0 APPLICATIONS DENIED 2 $143,745 6 $104,957 57 $104,407 2 $118,870 0 $0 4 $101,522 1 $8,630 APPLICATIONS WITHDRAWN 3 $99,757 6 $142,707 41 $130,932 2 $51,290 1 $1,537,430 2 $386,460 0 $0 FILES CLOSED FOR INCOMPLETENESS 0 $0 2 $79,145 9 $103,562 0 $0 0 $0 1 $61,760 0 $0
Aggregated Statistics For Year 2008(Based on 4 partial tracts) A) FHA, FSA/RHS & VA B) Conventional C) Refinancings D) Home Improvement Loans E) Loans on Dwellings For 5+ Families F) Non-occupant Loans on G) Loans On Manufactured Number Average Value Number Average Value Number Average Value Number Average Value Number Average Value Number Average Value Number Average Value
LOANS ORIGINATED 12 $118,887 93 $110,255 152 $117,371 28 $54,410 8 $701,751 43 $125,760 3 $65,543 APPLICATIONS APPROVED, NOT ACCEPTED 0 $0 10 $103,415 31 $115,482 3 $78,937 0 $0 5 $126,796 1 $49,210 APPLICATIONS DENIED 6 $98,722 10 $110,580 74 $122,854 9 $54,203 0 $0 7 $192,909 2 $26,435 APPLICATIONS WITHDRAWN 2 $101,290 7 $107,269 31 $128,294 1 $50,060 0 $0 3 $133,060 0 $0 FILES CLOSED FOR INCOMPLETENESS 0 $0 1 $152,050 7 $131,331 1 $85,400 0 $0 1 $152,050 0 $0
Aggregated Statistics For Year 2007(Based on 4 partial tracts) A) FHA, FSA/RHS & VA B) Conventional C) Refinancings D) Home Improvement Loans E) Loans on Dwellings For 5+ Families F) Non-occupant Loans on G) Loans On Manufactured Number Average Value Number Average Value Number Average Value Number Average Value Number Average Value Number Average Value Number Average Value
LOANS ORIGINATED 10 $115,794 131 $113,009 136 $107,331 30 $40,840 4 $324,668 36 $108,435 3 $28,273 APPLICATIONS APPROVED, NOT ACCEPTED 0 $0 13 $127,082 33 $106,375 4 $61,748 0 $0 6 $101,138 1 $76,090 APPLICATIONS DENIED 1 $99,820 24 $99,635 75 $106,683 12 $21,211 0 $0 14 $114,669 2 $38,420 APPLICATIONS WITHDRAWN 0 $0 12 $132,132 40 $103,430 3 $145,413 0 $0 3 $180,610 0 $0 FILES CLOSED FOR INCOMPLETENESS 0 $0 2 $102,350 10 $107,689 1 $43,500 0 $0 1 $126,670 0 $0
Aggregated Statistics For Year 2006(Based on 4 partial tracts) A) FHA, FSA/RHS & VA B) Conventional C) Refinancings D) Home Improvement Loans E) Loans on Dwellings For 5+ Families F) Non-occupant Loans on G) Loans On Manufactured Number Average Value Number Average Value Number Average Value Number Average Value Number Average Value Number Average Value Number Average Value
LOANS ORIGINATED 6 $118,415 142 $108,759 146 $104,190 38 $29,135 3 $809,860 47 $102,770 2 $66,520 APPLICATIONS APPROVED, NOT ACCEPTED 1 $137,450 9 $97,178 26 $103,157 2 $100,050 0 $0 2 $208,915 0 $0 APPLICATIONS DENIED 1 $67,110 22 $77,254 90 $106,108 15 $32,650 0 $0 5 $86,396 2 $39,225 APPLICATIONS WITHDRAWN 0 $0 9 $116,474 46 $118,652 4 $37,088 1 $926,330 4 $124,948 0 $0 FILES CLOSED FOR INCOMPLETENESS 0 $0 3 $81,120 18 $161,516 0 $0 0 $0 0 $0 0 $0
Aggregated Statistics For Year 2005(Based on 4 partial tracts) A) FHA, FSA/RHS & VA B) Conventional C) Refinancings D) Home Improvement Loans E) Loans on Dwellings For 5+ Families F) Non-occupant Loans on G) Loans On Manufactured Number Average Value Number Average Value Number Average Value Number Average Value Number Average Value Number Average Value Number Average Value
LOANS ORIGINATED 8 $97,499 159 $108,861 190 $97,091 32 $33,440 4 $243,088 52 $123,032 3 $77,930 APPLICATIONS APPROVED, NOT ACCEPTED 1 $75,830 14 $84,051 27 $91,542 3 $31,297 0 $0 4 $115,132 3 $58,637 APPLICATIONS DENIED 0 $0 20 $80,782 77 $107,161 18 $27,392 0 $0 5 $90,154 3 $50,350 APPLICATIONS WITHDRAWN 1 $45,020 13 $91,144 55 $105,943 3 $504,723 0 $0 6 $99,678 0 $0 FILES CLOSED FOR INCOMPLETENESS 0 $0 2 $106,600 20 $100,384 1 $30,950 0 $0 1 $115,980 0 $0
Aggregated Statistics For Year 2004(Based on 4 partial tracts) A) FHA, FSA/RHS & VA B) Conventional C) Refinancings D) Home Improvement Loans E) Loans on Dwellings For 5+ Families F) Non-occupant Loans on G) Loans On Manufactured Number Average Value Number Average Value Number Average Value Number Average Value Number Average Value Number Average Value Number Average Value
LOANS ORIGINATED 11 $134,549 163 $107,612 224 $97,828 47 $41,584 4 $486,790 54 $100,300 2 $39,760 APPLICATIONS APPROVED, NOT ACCEPTED 1 $95,140 10 $102,028 20 $111,984 4 $29,995 0 $0 2 $79,620 2 $41,495 APPLICATIONS DENIED 1 $45,270 14 $78,991 76 $91,110 19 $43,748 0 $0 5 $95,418 3 $74,757 APPLICATIONS WITHDRAWN 1 $150,990 6 $126,433 47 $92,546 3 $82,387 0 $0 2 $111,225 1 $92,710 FILES CLOSED FOR INCOMPLETENESS 0 $0 2 $101,460 18 $129,994 1 $19,540 0 $0 0 $0 0 $0
Aggregated Statistics For Year 2003(Based on 4 partial tracts) A) FHA, FSA/RHS & VA B) Conventional C) Refinancings D) Home Improvement Loans E) Loans on Dwellings For 5+ Families F) Non-occupant Loans on Number Average Value Number Average Value Number Average Value Number Average Value Number Average Value Number Average Value
LOANS ORIGINATED 15 $92,149 126 $93,671 543 $91,054 28 $19,341 3 $184,860 48 $86,654 APPLICATIONS APPROVED, NOT ACCEPTED 0 $0 7 $110,036 18 $101,776 2 $10,740 0 $0 1 $124,870 APPLICATIONS DENIED 1 $47,910 16 $100,349 97 $84,975 9 $19,077 1 $86,900 3 $118,003 APPLICATIONS WITHDRAWN 1 $65,990 9 $85,304 72 $88,572 1 $16,530 0 $0 6 $89,407 FILES CLOSED FOR INCOMPLETENESS 1 $164,030 2 $79,040 6 $85,398 1 $11,160 0 $0 0 $0
Aggregated Statistics For Year 2002(Based on 4 partial tracts) A) FHA, FSA/RHS & VA B) Conventional C) Refinancings D) Home Improvement Loans E) Loans on Dwellings For 5+ Families F) Non-occupant Loans on Number Average Value Number Average Value Number Average Value Number Average Value Number Average Value Number Average Value
LOANS ORIGINATED 12 $103,145 134 $87,635 431 $88,538 26 $18,777 7 $276,506 50 $94,873 APPLICATIONS APPROVED, NOT ACCEPTED 2 $90,360 14 $70,101 29 $83,991 1 $30,950 1 $540,280 2 $66,985 APPLICATIONS DENIED 1 $51,820 13 $67,726 61 $80,645 14 $13,919 1 $99,880 3 $110,383 APPLICATIONS WITHDRAWN 1 $99,030 9 $78,238 44 $85,901 2 $90,785 0 $0 2 $83,130 FILES CLOSED FOR INCOMPLETENESS 1 $60,140 1 $50,580 6 $115,430 0 $0 0 $0 0 $0
Aggregated Statistics For Year 2001(Based on 4 partial tracts) A) FHA, FSA/RHS & VA B) Conventional C) Refinancings D) Home Improvement Loans E) Loans on Dwellings For 5+ Families F) Non-occupant Loans on Number Average Value Number Average Value Number Average Value Number Average Value Number Average Value Number Average Value
LOANS ORIGINATED 13 $84,840 135 $79,888 297 $80,204 43 $17,635 5 $167,512 51 $93,457 APPLICATIONS APPROVED, NOT ACCEPTED 1 $75,720 6 $84,123 15 $65,548 1 $8,530 0 $0 1 $77,550 APPLICATIONS DENIED 5 $65,192 18 $72,684 57 $63,293 9 $15,049 0 $0 7 $102,314 APPLICATIONS WITHDRAWN 0 $0 9 $81,780 33 $68,333 3 $18,770 0 $0 1 $138,070 FILES CLOSED FOR INCOMPLETENESS 0 $0 1 $40,700 9 $57,572 0 $0 0 $0 0 $0
Aggregated Statistics For Year 2000(Based on 4 partial tracts) A) FHA, FSA/RHS & VA B) Conventional C) Refinancings D) Home Improvement Loans E) Loans on Dwellings For 5+ Families F) Non-occupant Loans on Number Average Value Number Average Value Number Average Value Number Average Value Number Average Value Number Average Value
LOANS ORIGINATED 8 $71,401 115 $82,120 75 $75,475 44 $18,598 2 $167,390 32 $104,794 APPLICATIONS APPROVED, NOT ACCEPTED 1 $96,460 12 $65,346 8 $54,376 4 $14,780 0 $0 1 $84,950 APPLICATIONS DENIED 0 $0 22 $55,945 45 $62,035 5 $18,864 1 $46,720 4 $60,418 APPLICATIONS WITHDRAWN 0 $0 4 $65,952 20 $56,275 3 $13,237 0 $0 3 $93,983 FILES CLOSED FOR INCOMPLETENESS 1 $34,910 0 $0 7 $84,110 1 $20,930 0 $0 0 $0
Aggregated Statistics For Year 1999(Based on 5 partial tracts) A) FHA, FSA/RHS & VA B) Conventional C) Refinancings D) Home Improvement Loans F) Non-occupant Loans on Number Average Value Number Average Value Number Average Value Number Average Value Number Average Value
LOANS ORIGINATED 4 $86,840 135 $79,483 170 $62,079 39 $16,316 35 $85,211 APPLICATIONS APPROVED, NOT ACCEPTED 0 $0 9 $72,237 17 $60,275 3 $12,767 1 $186,830 APPLICATIONS DENIED 0 $0 19 $59,748 29 $64,492 6 $9,033 0 $0 APPLICATIONS WITHDRAWN 0 $0 15 $58,533 18 $55,362 2 $76,355 1 $106,460 FILES CLOSED FOR INCOMPLETENESS 0 $0 3 $54,280 1 $60,410 0 $0 0 $0
Detailed HMDA statistics for the following Tracts:
0102.00
, 0103.00 , 0104.00 , 0105.00
Private Mortgage Insurance Companies Aggregated Statistics For Year 2009(Based on 4 partial tracts) A) Conventional B) Refinancings Number Average Value Number Average Value
LOANS ORIGINATED 15 $127,955 29 $130,747 APPLICATIONS APPROVED, NOT ACCEPTED 2 $130,225 5 $147,314 APPLICATIONS DENIED 4 $99,338 3 $125,047 APPLICATIONS WITHDRAWN 1 $92,600 3 $134,700 FILES CLOSED FOR INCOMPLETENESS 0 $0 1 $56,000
Aggregated Statistics For Year 2008(Based on 4 partial tracts) A) Conventional B) Refinancings C) Non-occupant Loans on Number Average Value Number Average Value Number Average Value
LOANS ORIGINATED 30 $113,359 21 $138,358 2 $70,935 APPLICATIONS APPROVED, NOT ACCEPTED 5 $84,232 3 $144,580 1 $59,470 APPLICATIONS DENIED 1 $165,450 0 $0 0 $0 APPLICATIONS WITHDRAWN 0 $0 0 $0 0 $0 FILES CLOSED FOR INCOMPLETENESS 1 $42,480 0 $0 1 $42,480
Aggregated Statistics For Year 2007(Based on 4 partial tracts) A) Conventional B) Refinancings C) Non-occupant Loans on Number Average Value Number Average Value Number Average Value
LOANS ORIGINATED 55 $117,670 23 $130,329 2 $108,740 APPLICATIONS APPROVED, NOT ACCEPTED 3 $195,603 1 $170,290 0 $0 APPLICATIONS DENIED 1 $57,100 0 $0 0 $0 APPLICATIONS WITHDRAWN 1 $91,330 1 $68,870 0 $0 FILES CLOSED FOR INCOMPLETENESS 0 $0 0 $0 0 $0
Aggregated Statistics For Year 2006(Based on 4 partial tracts) A) Conventional B) Refinancings C) Non-occupant Loans on Number Average Value Number Average Value Number Average Value
LOANS ORIGINATED 53 $115,741 12 $129,278 1 $191,050 APPLICATIONS APPROVED, NOT ACCEPTED 1 $80,640 2 $137,640 1 $114,380 APPLICATIONS DENIED 0 $0 0 $0 0 $0 APPLICATIONS WITHDRAWN 2 $95,050 0 $0 0 $0 FILES CLOSED FOR INCOMPLETENESS 0 $0 0 $0 0 $0
Aggregated Statistics For Year 2005(Based on 4 partial tracts) A) Conventional B) Refinancings C) Non-occupant Loans on D) Loans On Manufactured Number Average Value Number Average Value Number Average Value Number Average Value
LOANS ORIGINATED 48 $107,738 24 $120,814 3 $78,393 1 $80,630 APPLICATIONS APPROVED, NOT ACCEPTED 1 $169,190 4 $142,352 0 $0 0 $0 APPLICATIONS DENIED 0 $0 1 $258,250 0 $0 0 $0 APPLICATIONS WITHDRAWN 2 $130,135 3 $125,413 0 $0 0 $0 FILES CLOSED FOR INCOMPLETENESS 0 $0 1 $258,250 0 $0 0 $0
Aggregated Statistics For Year 2004(Based on 4 partial tracts) A) Conventional B) Refinancings C) Non-occupant Loans on Number Average Value Number Average Value Number Average Value
LOANS ORIGINATED 32 $110,454 18 $129,516 4 $95,968 APPLICATIONS APPROVED, NOT ACCEPTED 2 $172,945 3 $109,397 1 $104,900 APPLICATIONS DENIED 0 $0 1 $67,960 0 $0 APPLICATIONS WITHDRAWN 2 $120,835 3 $152,483 0 $0 FILES CLOSED FOR INCOMPLETENESS 0 $0 0 $0 0 $0
Aggregated Statistics For Year 2003(Based on 4 partial tracts) A) Conventional B) Refinancings C) Non-occupant Loans on Number Average Value Number Average Value Number Average Value
LOANS ORIGINATED 40 $93,835 37 $111,688 1 $81,090 APPLICATIONS APPROVED, NOT ACCEPTED 6 $87,917 1 $158,720 0 $0 APPLICATIONS DENIED 0 $0 1 $201,370 0 $0 APPLICATIONS WITHDRAWN 0 $0 1 $136,600 0 $0 FILES CLOSED FOR INCOMPLETENESS 0 $0 0 $0 0 $0
Aggregated Statistics For Year 2002(Based on 4 partial tracts) A) Conventional B) Refinancings C) Non-occupant Loans on Number Average Value Number Average Value Number Average Value
LOANS ORIGINATED 25 $90,598 28 $103,206 2 $86,830 APPLICATIONS APPROVED, NOT ACCEPTED 5 $72,522 0 $0 0 $0 APPLICATIONS DENIED 1 $35,440 0 $0 0 $0 APPLICATIONS WITHDRAWN 1 $55,540 2 $176,530 2 $65,835 FILES CLOSED FOR INCOMPLETENESS 0 $0 0 $0 0 $0
Aggregated Statistics For Year 2001(Based on 4 partial tracts) A) Conventional B) Refinancings C) Non-occupant Loans on Number Average Value Number Average Value Number Average Value
LOANS ORIGINATED 30 $94,572 17 $90,425 1 $42,480 APPLICATIONS APPROVED, NOT ACCEPTED 2 $94,385 1 $106,160 0 $0 APPLICATIONS DENIED 0 $0 1 $71,710 1 $55,310 APPLICATIONS WITHDRAWN 1 $102,650 1 $176,950 0 $0 FILES CLOSED FOR INCOMPLETENESS 0 $0 0 $0 0 $0
Aggregated Statistics For Year 2000(Based on 4 partial tracts) A) Conventional B) Refinancings C) Non-occupant Loans on Number Average Value Number Average Value Number Average Value
LOANS ORIGINATED 34 $90,188 1 $47,920 1 $26,850 APPLICATIONS APPROVED, NOT ACCEPTED 2 $96,620 0 $0 0 $0 APPLICATIONS DENIED 0 $0 0 $0 0 $0 APPLICATIONS WITHDRAWN 1 $97,540 1 $41,350 0 $0 FILES CLOSED FOR INCOMPLETENESS 0 $0 0 $0 0 $0
Aggregated Statistics For Year 1999(Based on 4 partial tracts) A) Conventional B) Refinancings C) Non-occupant Loans on Number Average Value Number Average Value Number Average Value
LOANS ORIGINATED 39 $71,847 9 $75,561 1 $29,270 APPLICATIONS APPROVED, NOT ACCEPTED 3 $66,857 2 $63,350 1 $29,270 APPLICATIONS DENIED 1 $66,290 0 $0 0 $0 APPLICATIONS WITHDRAWN 0 $0 0 $0 0 $0 FILES CLOSED FOR INCOMPLETENESS 0 $0 0 $0 0 $0
Detailed PMIC statistics for the following Tracts:
0102.00
, 0103.00 , 0104.00 , 0105.00 Fire-safe hotels and motels in Chippewa Falls, Wisconsin:
Holiday Inn Express Hotel & Suites, 12858 26th Ave, Chippewa Falls, Wisconsin 54729 Phone: (715) 834-2449, Fax: (715) 834-8099
Country Inn, 1021 W Park Ave, Chippewa Falls, Wisconsin 54729 Phone: (715) 720-1414, Fax: (715) 720-1122
Hampton Inn and Suites, 12707 30th Ave, Chippewa falls, Wisconsin 54729 Phone: (715) 726-3000, Fax: (715) 726-3930
cobblestone hotel and suites, 100 N Bridge St, Chippewa falls, Wisconsin 54729 Phone: (888) 693-8262
All 4 fire-safe hotels and motels in Chippewa Falls, Wisconsin
Most common first names in Chippewa Falls, WI among deceased individuals Name Count Lived (average)
John 196 77.5 years Mary 144 79.7 years William 139 76.5 years Robert 134 69.3 years George 114 76.7 years Margaret 104 81.0 years Frank 96 79.7 years James 95 68.9 years Anna 89 84.9 years Helen 87 81.4 years
Most common last names in Chippewa Falls, WI among deceased individuals Last name Count Lived (average)
Johnson 96 77.1 years Anderson 78 75.4 years Olson 71 75.7 years Smith 62 74.2 years Bowe 62 77.1 years Nelson 55 79.1 years Peterson 46 76.9 years Larson 45 77.1 years Hanson 36 77.5 years Geissler 31 77.4 years
Chippewa Falls compared to Wisconsin state average:
Unemployed percentage below state average. Black race population percentage below state average. Hispanic race population percentage significantly below state average. Median age below state average. Foreign-born population percentage below state average. Length of stay since moving in below state average. Institutionalized population percentage above state average. Chippewa Falls on our top lists :
#39 on the list of "Top 101 cities with the largest percentage of people in schools, hospitals, or wards for the mentally retarded (population 1,000+)"
#42 on the list of "Top 101 cities with the most full-time local library workers per 1000 residents (population 5,000+)"
#47 (54729) on the list of "Top 101 zip codes with the most alcohol drinking places in 2005"
Top Patent Applicants
Steven L. Scott (19)
Mark S. Birrittella (9)
James T. Kirchen (8)
Timothy J. Johnson (7)
Gregory J. Faanes (7)
Martin F. Hoenigmann (6)
Michael K. Truscott (6)
Eric D. Lakin (5)
Jordan L. Sedivy (5)
Phillip P. Normand (5)
Total of 180 patent applications in 2008-2024.


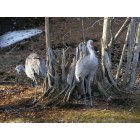
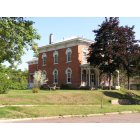
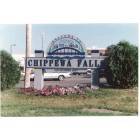
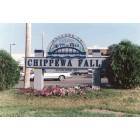


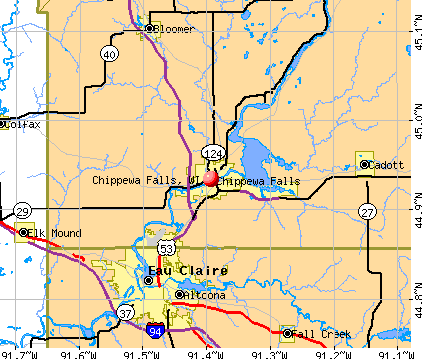


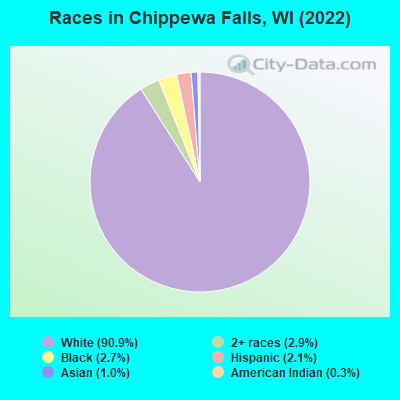
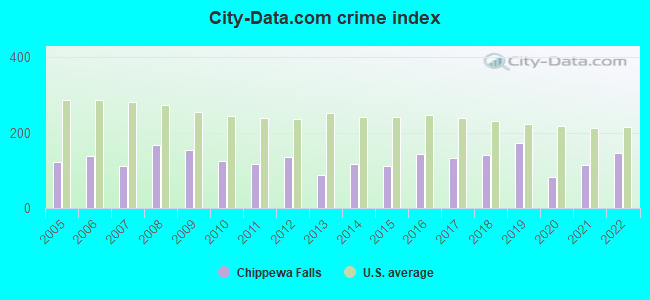
 Recent articles from our blog. Our writers, many of them Ph.D. graduates or candidates, create easy-to-read articles on a wide variety of topics.


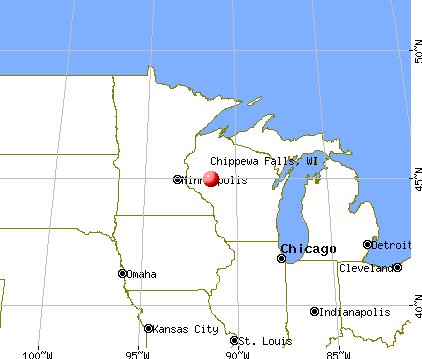
 (9.6 miles
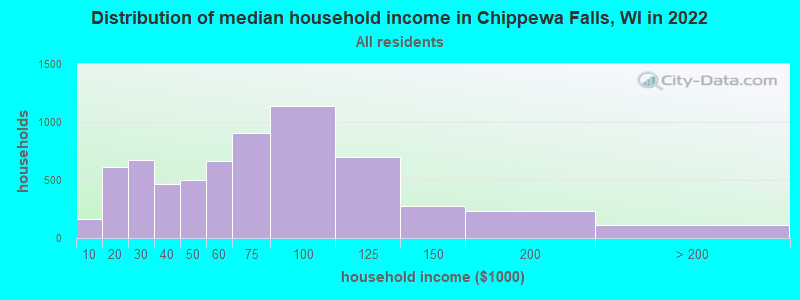


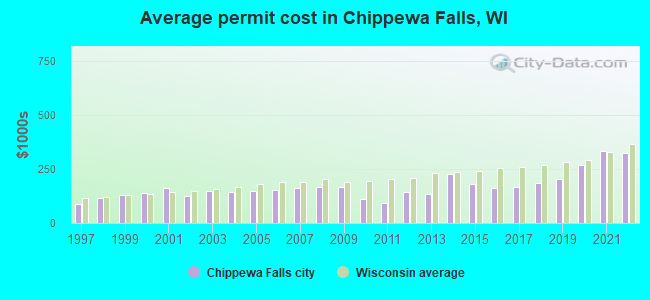
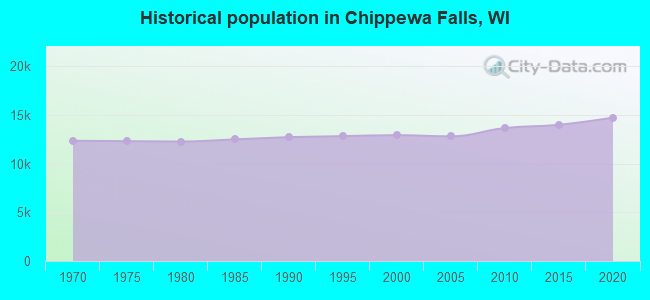
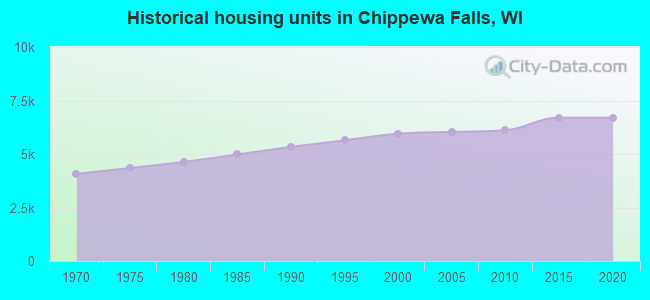
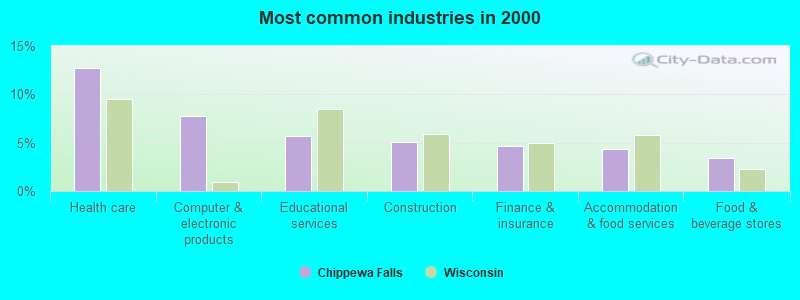
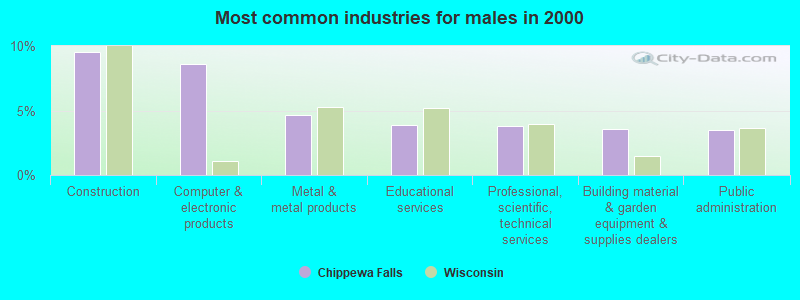
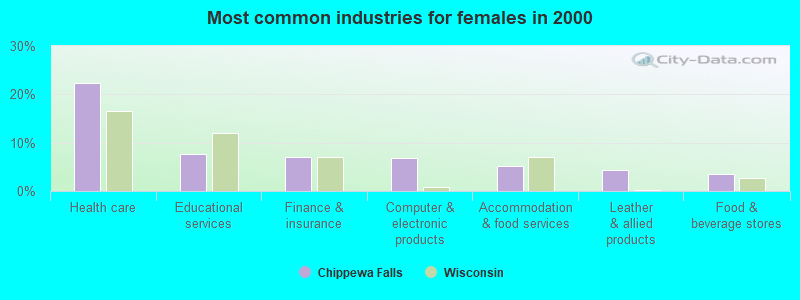
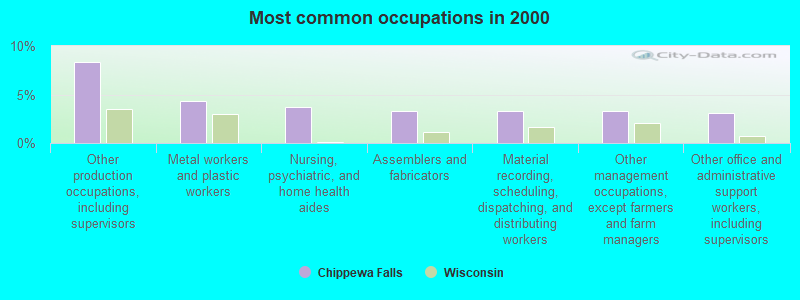

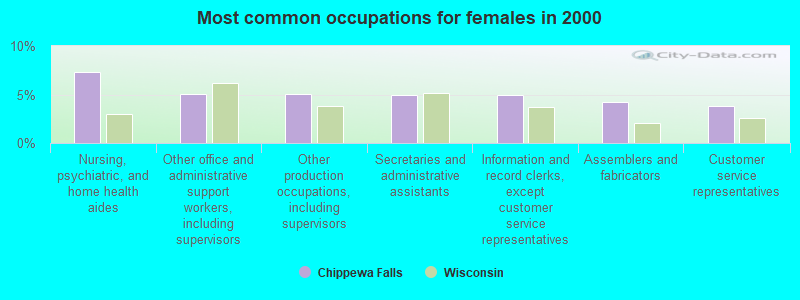


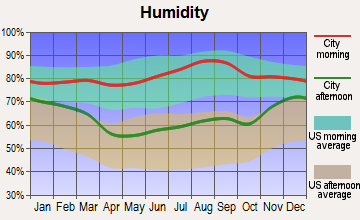

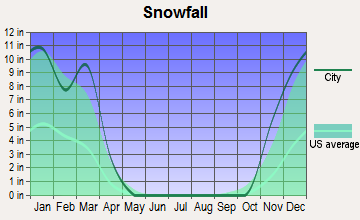
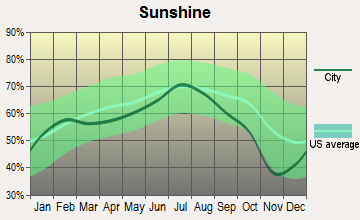
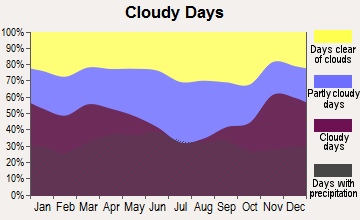
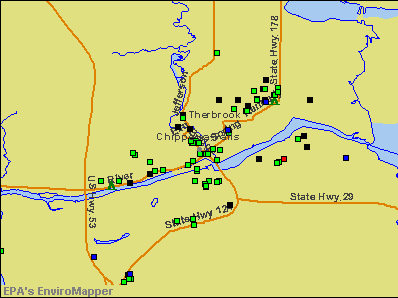


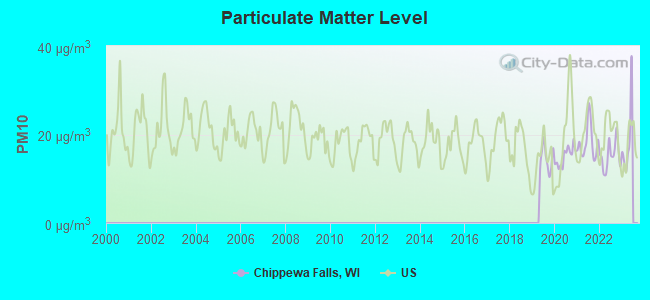
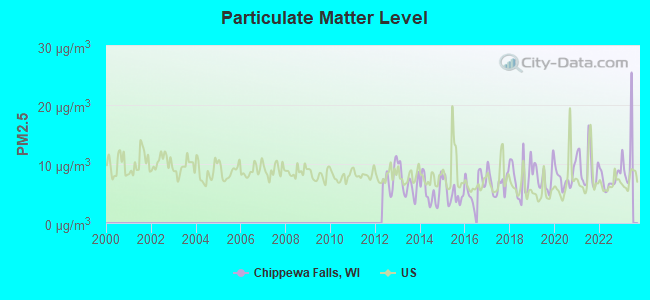
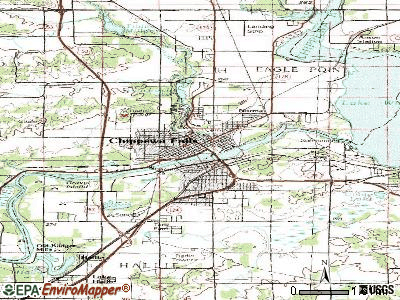

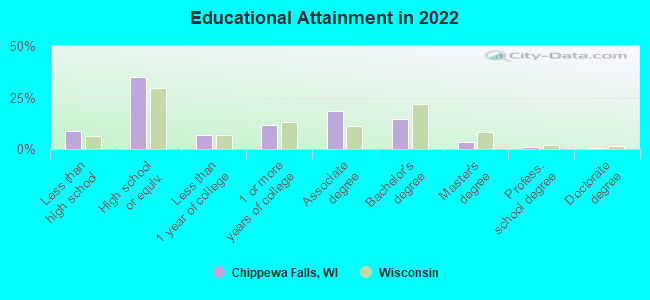
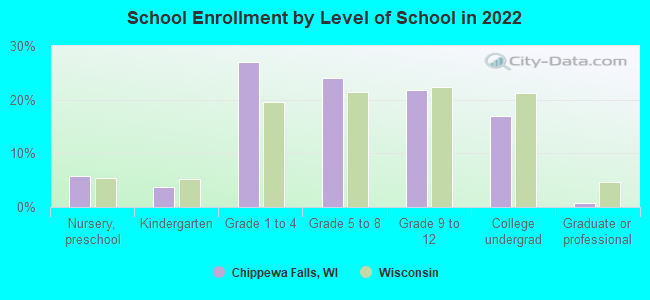
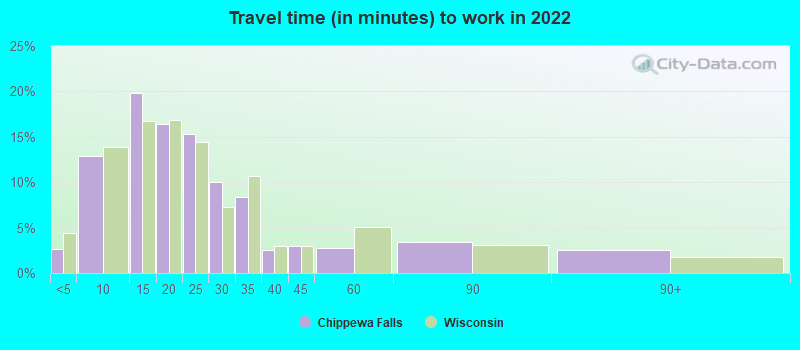
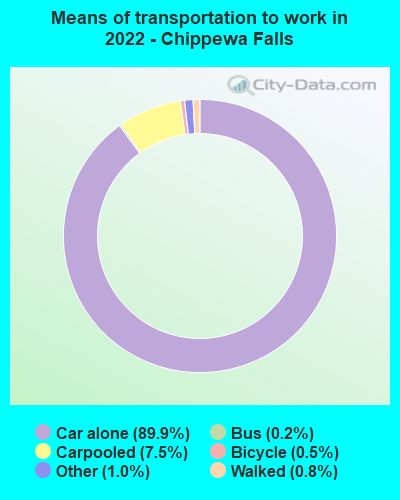
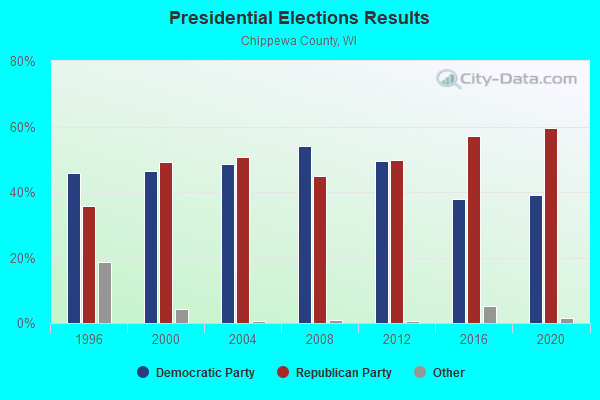
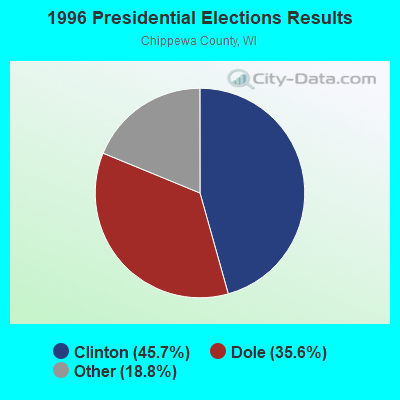
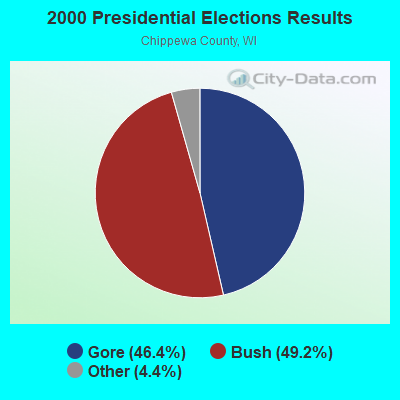
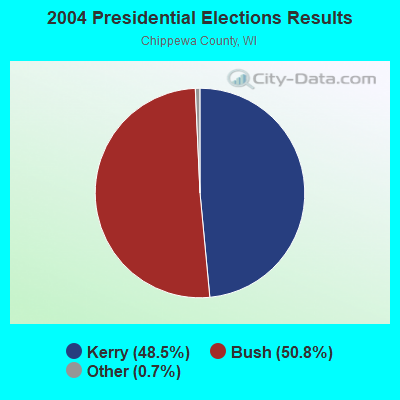
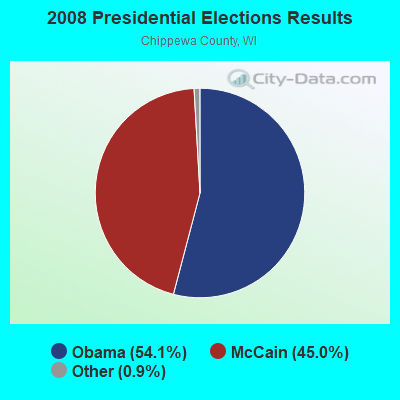
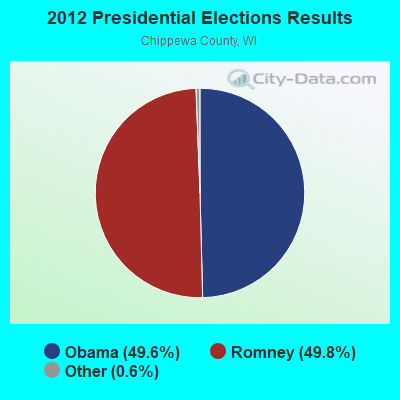
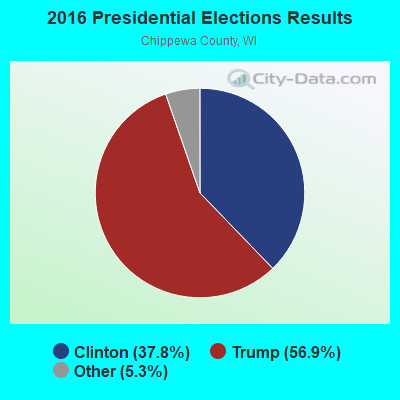
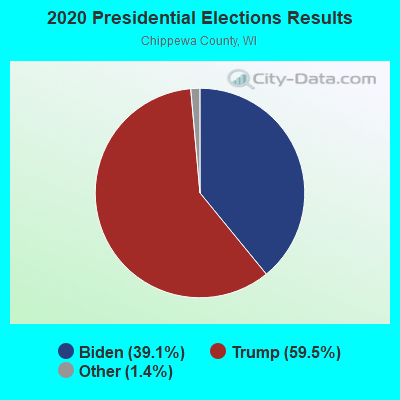
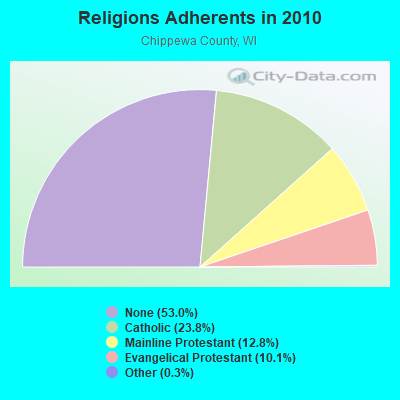
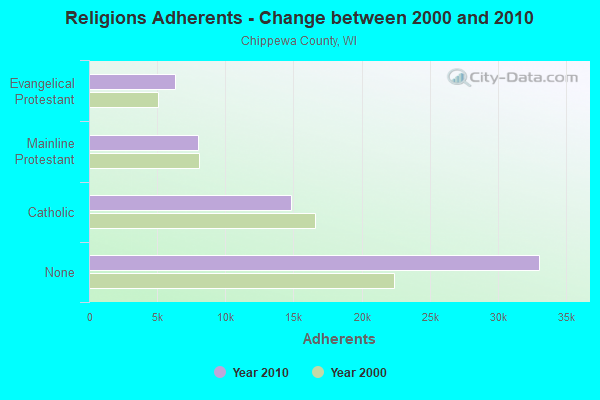
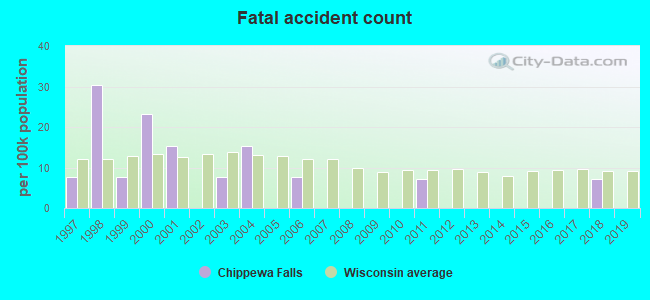


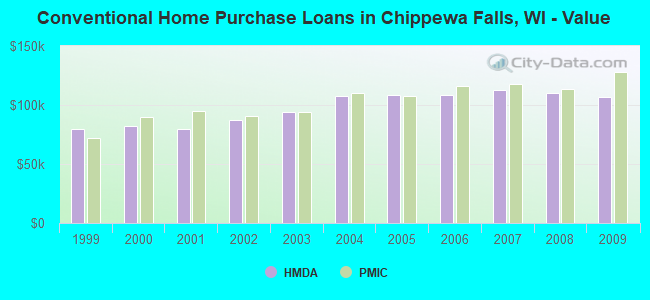
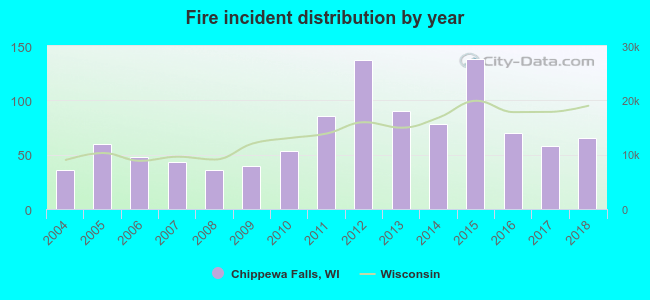 Based on the data from the years 2004 - 2018 the average number of fires per year is 69. The highest number of fires - 138 took place in 2015, and the least - 36 in 2004. The data has an increasing trend.
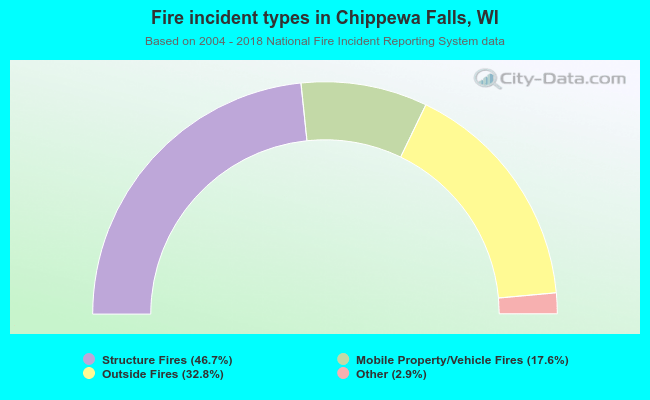 When looking into fire subcategories, the most incidents belonged to: Structure Fires (46.7%), and Outside Fires (32.8%).