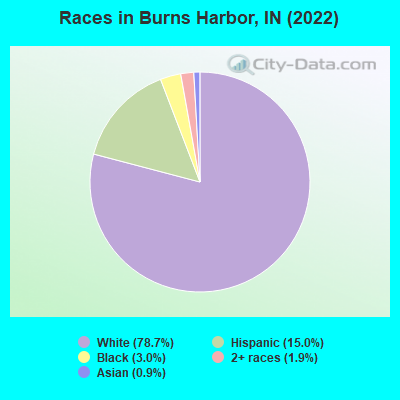
Percentage of residents living in poverty in 2022: 12.4%
(7.4% for White Non-Hispanic residents, 45.3% for Hispanic or Latino residents, 36.5% for two or more races residents)
According to our research of Indiana and other state lists, there was 1 registered sex offender living in Burns Harbor, Indiana as of July 02, 2024. The ratio of all residents to sex offenders in Burns Harbor is 1,307 to 1. The ratio of registered sex offenders to all residents in this city is lower than the state average.
Crime rates in Burns Harbor by year
Type
2009
2010
2011
2012
2013
Murders (per 100,000)
0 (0.0)
0 (0.0)
1 (86.1)
0 (0.0)
0 (0.0)
Rapes (per 100,000)
0 (0.0)
0 (0.0)
0 (0.0)
0 (0.0)
0 (0.0)
Robberies (per 100,000)
0 (0.0)
0 (0.0)
1 (86.1)
0 (0.0)
0 (0.0)
Assaults (per 100,000)
0 (0.0)
2 (173.0)
0 (0.0)
1 (85.5)
2 (161.0)
Burglaries (per 100,000)
5 (435.5)
4 (346.0)
5 (430.3)
2 (171.1)
1 (80.5)
Thefts (per 100,000)
19 (1,655)
16 (1,384)
23 (1,979)
29 (2,481)
15 (1,208)
Auto thefts (per 100,000)
5 (435.5)
3 (259.5)
2 (172.1)
2 (171.1)
1 (80.5)
Arson (per 100,000)
0 (0.0)
0 (0.0)
0 (0.0)
0 (0.0)
0 (0.0)
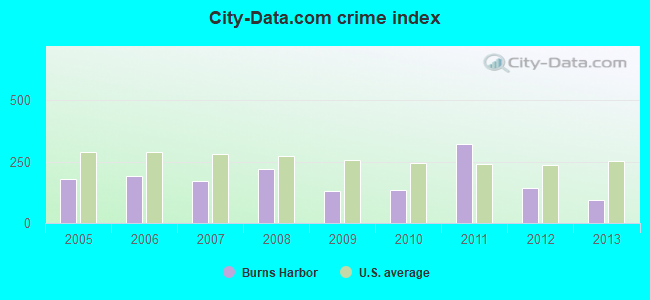
City-Data.com crime index
131.5
134.9
321.0
142.0
92.6
The City-Data.com crime index weighs serious crimes and violent crimes more heavily. Higher means more crime, U.S. average is 246.1. It adjusts for the number of visitors and daily workers commuting into cities.
Latest news from Burns Harbor, IN collected exclusively by city-data.com from local newspapers, TV, and radio stations
Ancestries: American (18.0%), Polish (10.6%), German (9.4%), Irish (6.2%), Italian (6.2%), English (4.6%).
Current Local Time: CST time zone
Incorporated in 1967
Elevation: 620 feet
Land area: 6.83 square miles.
Population density: 312 people per square mile (very low).
142 residents are foreign born (2.2% Latin America, 1.9% Europe, 1.2% Asia).
This town:
5.8%
Indiana:
5.6%
Median real estate property taxes paid for housing units with mortgages in 2022: $1,859 (0.7%) Median real estate property taxes paid for housing units with no mortgage in 2022: $1,247 (0.8%)
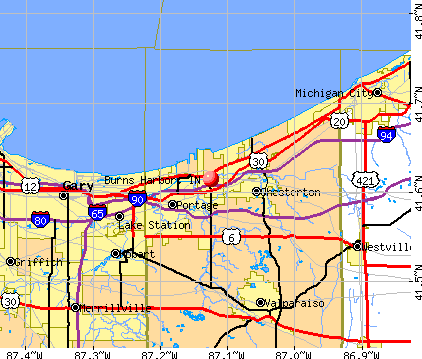
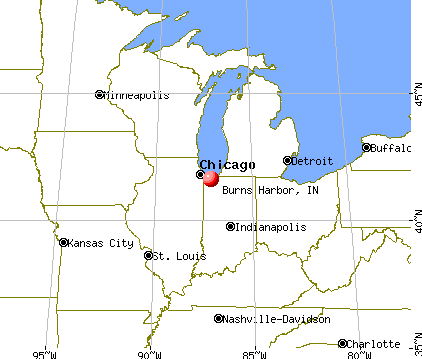
Nearest city with pop. 50,000+: Gary, IN (11.7 miles , pop. 102,746).
Nearest city with pop. 200,000+: Chicago, IL (32.6 miles , pop. 2,896,016).
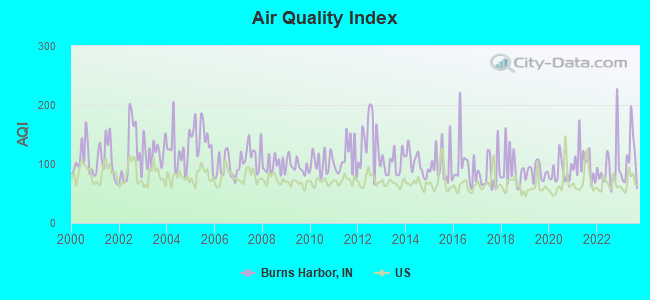
Air Quality Index (AQI) level in 2023 was 107. This is significantly worse than average.
City:
107
U.S.:
73
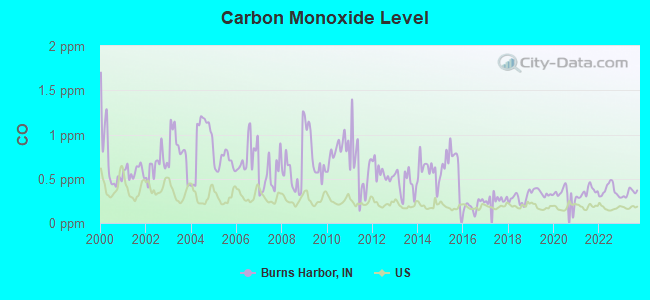
Carbon Monoxide (CO) [ppm] level in 2023 was 0.339. This is worse than average.Closest monitor was 10.9 miles away from the city center.
City:
0.339
U.S.:
0.251
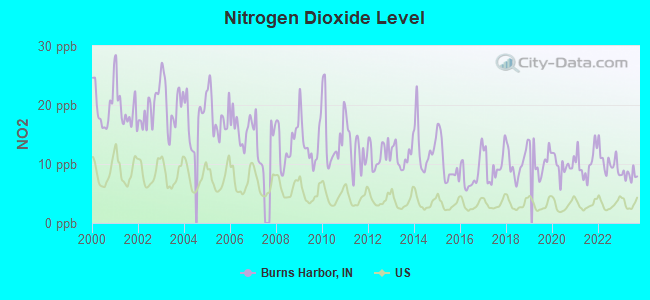
Nitrogen Dioxide (NO2) [ppb] level in 2023 was 8.14. This is significantly worse than average.Closest monitor was 3.2 miles away from the city center.
City:
8.14
U.S.:
5.11
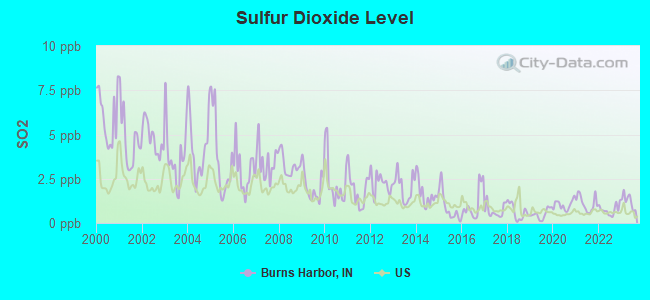
Sulfur Dioxide (SO2) [ppb] level in 2023 was 1.24. This is better than average.Closest monitor was 2.3 miles away from the city center.
City:
1.24
U.S.:
1.51
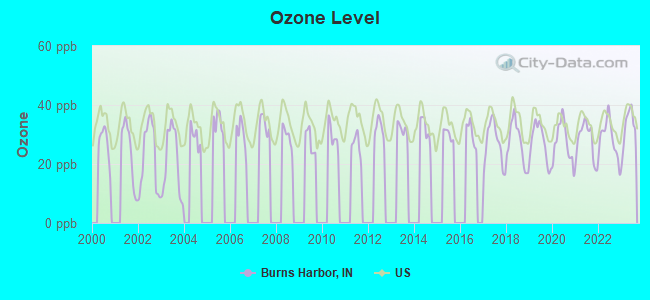
Ozone [ppb] level in 2023 was 32.6. This is about average.Closest monitor was 2.3 miles away from the city center.
City:
32.6
U.S.:
33.3
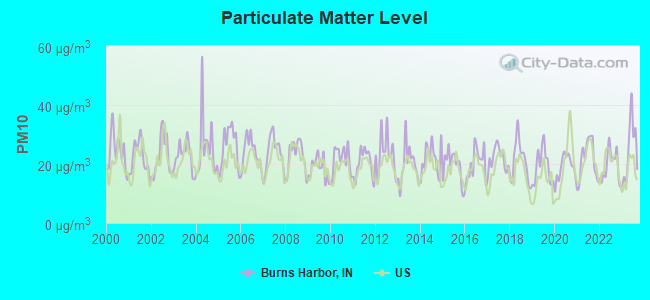
Particulate Matter (PM10) [µg/m3] level in 2023 was 24.5. This is worse than average.Closest monitor was 1.2 miles away from the city center.
City:
24.5
U.S.:
19.2
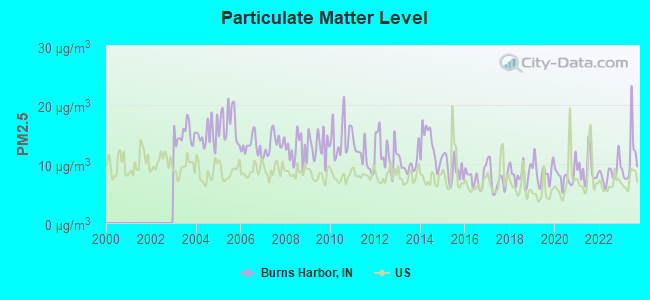
Particulate Matter (PM2.5) [µg/m3] level in 2023 was 11.0. This is worse than average.Closest monitor was 2.3 miles away from the city center.
City:
11.0
U.S.:
8.1
Lead (Pb) [µg/m3] level in 2009 was 0.0317. This is significantly worse than average.Closest monitor was 1.2 miles away from the city center.
City:
0.0317
U.S.:
0.0093
Tornado activity:
Burns Harbor-area historical tornado activity is slightly below Indiana state average. It is 57% greater than the overall U.S. average.
On 4/21/1967, a category F4 (max. wind speeds 207-260 mph) tornado 23.4 miles away from the Burns Harbor town center killed 33 peopleand injured 500 peopleand causedbetween $5,000,000 and $50,000,000 in damages.
On 10/24/1967, a category F3 (max. wind speeds 158-206 mph) tornado 6.7 miles away from the town center causedbetween $5000 and $50,000 in damages.
Earthquake activity:
Burns Harbor-area historical earthquake activity is significantly above Indiana state average. It is 30% greater than the overall U.S. average.
On 4/18/2008 at 09:36:59, a magnitude 5.4 (5.1 MB, 4.8 MS, 5.4 MW, 5.2 MW, Class: Moderate, Intensity: VI - VII) earthquake occurred 222.4 miles away from the city center On 6/10/1987 at 23:48:54, a magnitude 5.1 (4.9 MB, 4.4 MS, 4.6 MS, 5.1 LG) earthquake occurred 197.4 miles away from Burns Harbor center On 4/18/2008 at 09:36:59, a magnitude 5.2 (5.2 MW, Depth: 8.9 mi) earthquake occurred 222.5 miles away from the city center On 6/28/2004 at 06:10:52, a magnitude 4.2 (4.2 MW, Depth: 6.2 mi, Class: Light, Intensity: IV - V) earthquake occurred 92.5 miles away from Burns Harbor center On 7/27/1980 at 18:52:21, a magnitude 5.2 (5.1 MB, 4.7 MS, 5.0 UK, 5.2 UK) earthquake occurred 290.0 miles away from Burns Harbor center On 6/18/2002 at 17:37:15, a magnitude 5.0 (4.3 MB, 4.6 MW, 5.0 LG) earthquake occurred 253.3 miles away from Burns Harbor center Magnitude types: regional Lg-wave magnitude (LG), body-wave magnitude (MB), surface-wave magnitude (MS), moment magnitude (MW)
Natural disasters:
The number of natural disasters in Porter County (12) is smaller than the US average (15). Major Disasters (Presidential) Declared: 6 Emergencies Declared: 4
Causes of natural disasters: Floods: 6, Storms: 5, Winter Storms: 4, Tornadoes: 2, Hurricane: 1, Snow: 1, Other: 1 (Note: some incidents may be assigned to more than one category).
Hospitals and medical centers near Burns Harbor:
OPPORTUNITY ENTERPRISES INC (Hospital, about 3 miles away; CHESTERTON, IN)
WATERS OF DUNELAND THE (Nursing Home, about 5 miles away; CHESTERTON, IN)
DAVITA - CHESTERTON (Dialysis Facility, about 5 miles away; PORTER, IN)
ARC BRIDGES, INC (Hospital, about 5 miles away; PORTAGE, IN)
OPPORTUNITY ENTERPRISES INC (Hospital, about 5 miles away; PORTAGE, IN)
FOUNTAINVIEW PLACE OF PORTAGE (Nursing Home, about 5 miles away; PORTAGE, IN)
GOLDEN LIVING CENTER-FOUNTAINVIEW PLACE (Nursing Home, about 5 miles away; PORTAGE, IN)
Amtrak station near Burns Harbor:
14 miles: MICHIGAN CITY (100 WASHINGTON ST.) . Services: public payphones, free short-term parking, free long-term parking, call for taxi service.
Colleges/universities with over 2000 students nearest to Burns Harbor:
Valparaiso University (about 12 miles; Valparaiso, IN; Full-time enrollment: 3,542)
Indiana University-Northwest (about 12 miles; Gary, IN; FT enrollment: 4,390)
Purdue University-North Central Campus (about 13 miles; Westville, IN; FT enrollment: 3,682)
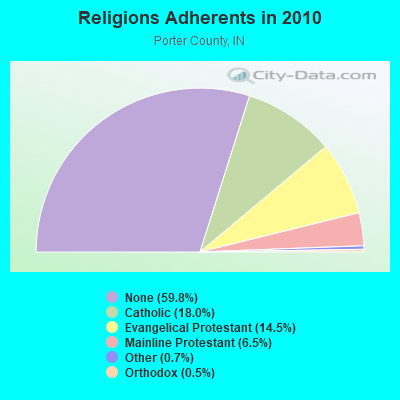
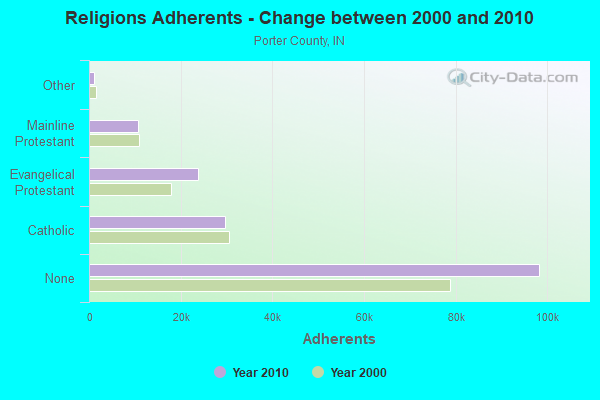
Religion statistics for Burns Harbor, IN (based on Porter County data)
Religion
Adherents
Congregations
Catholic
29,583
8
Evangelical Protestant
23,857
91
Mainline Protestant
10,640
26
Other
1,136
7
Orthodox
860
2
None
98,267
-
Source: Clifford Grammich, Kirk Hadaway, Richard Houseal, Dale E.Jones, Alexei Krindatch, Richie Stanley and Richard H.Taylor. 2012. 2010 U.S.Religion Census: Religious Congregations & Membership Study. Association of Statisticians of American Religious Bodies. Jones, Dale E., et al. 2002. Congregations and Membership in the United States 2000. Nashville, TN: Glenmary Research Center. Graphs represent county-level data
PRAXAIR, Nw Corner At Int Of State Rd 149 And Interstate 94 (Lat: 41.610306 Lon: -87.128639), Type: Ltower, Structure height: 30.5 m, Call Sign: WRCA540, Licensee ID: L00004803, Assigned Frequencies: 6548.12 MHz, Grant Date: 08/09/2018, Expiration Date: 08/09/2028, Certifier: Ed Bee, Registrant: Northern Indiana Public Service Company, 801 East 86th Ave, Merrillville, IN 46410, Phone: (219) 781-7261, Fax: (219) 886-5844, Email:
BURNS HARBOR, M Street (Lat: 41.633417 Lon: -87.130083), Type: Mtower, Structure height: 59.5 m, Overall height: 60.7 m, Call Sign: WRFT210, Assigned Frequencies: 18015.0 MHz, 18015.0 MHz, 18015.0 MHz, 18015.0 MHz, 18015.0 MHz, 18015.0 MHz, 18015.0 MHz, Grant Date: 04/27/2020, Expiration Date: 04/27/2030, Certifier: Christophe Le Scanve, Registrant: Cellco Partnership, 5055 North Point Pkwy, Np2ne Network Engineering, Alpharetta, GA 30022, Phone: (770) 797-1070, Email:
PRAXAIR, Nw Corner At Int Of State Rd 149 And Interstate 94 (Lat: 41.610306 Lon: -87.128639), Type: Tower, Structure height: 30.5 m, Call Sign: WAZ600, Assigned Frequencies: 6548.12 MHz, Grant Date: 02/29/2008, Expiration Date: 05/13/2018, Cancellation Date: 07/14/2018, Registrant: Northern Indiana Public Service Company, 1460 E 15th Avenue, Gary, IN 46402, Phone: (219) 886-5820, Fax: (219) 886-5844, Email:
FCC Registered Paging Towers:
1
1175 Rak Rd (Lat: 41.604444 Lon: -87.122778), Type: Tower, Structure height: 89.9 m, Call Sign: KNKO276, Licensee ID: L01422065, Assigned Frequencies: 931.862 MHz, Grant Date: 08/12/2008, Expiration Date: 07/01/2018, Cancellation Date: 01/28/2014, Certifier: Shawn E Endsley, Registrant: Usa Mobility Wireless, Inc., 3000 Technology Dr. #400, Plano, TX 75074, Phone: (972) 801-0000, Fax: (972) 801-1699, Email:
FCC Registered Amateur Radio Licenses:
6
Call Sign: KA9BQD, Licensee ID: L00583759, Grant Date: 11/02/2002, Expiration Date: 11/02/2012, Cancellation Date: 11/04/2014, Registrant: Donald K Carpenter, 1188 N Salt Creek Road, Burns Harbor, IN 46304
Call Sign: KF9OV, Licensee ID: L00133987, Grant Date: 01/07/2004, Expiration Date: 04/20/2013, Cancellation Date: 07/24/2012, Certifier: Gregory S Miller, Registrant: Gregory S Miller, 1129 Harbor Way, Burns Harbor, IN 46304
Call Sign: WA9Q, Licensee ID: L01351766, Grant Date: 12/18/2007, Expiration Date: 03/09/2018, Cancellation Date: 03/10/2020, Certifier: James C Vokorokos, Registrant: James C Vokorokos, 1171 Rak Rd, Burns Harbor, IN 46304
Call Sign: KC9EKY, Licensee ID: L00705883, Grant Date: 06/28/2023, Expiration Date: 06/28/2033, Certifier: Steven J Pazanin, Registrant: Steven J Pazanin, 1163 Kinner Drive, Burns Harbor, IN 46304
Call Sign: KD9EEC, Licensee ID: L01954498, Grant Date: 07/01/2015, Expiration Date: 07/01/2025, Certifier: Jerome M Nowaczyk, Registrant: Jerome M Nowaczyk, 298 Meadowbrook Rd, Burns Harbor, IN 46304
Call Sign: KD9TSA, Licensee ID: L02498627, Grant Date: 11/02/2021, Expiration Date: 11/02/2031, Certifier: Jonathan Chappell, Registrant: Jonathan Chappell, 1167 Harbor Way, Burns Harbor, IN 46304-9661
Home Mortgage Disclosure Act Aggregated Statistics For Year 2009 (Based on 1 partial tract)
A) FHA, FSA/RHS & VA Home Purchase Loans
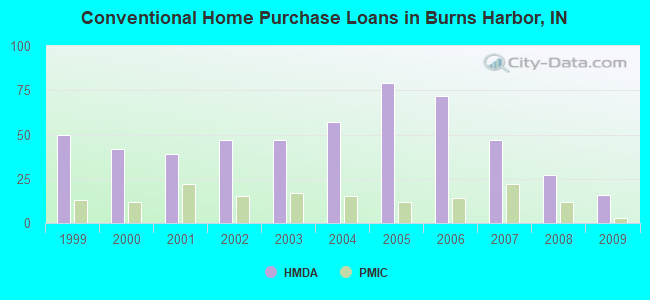
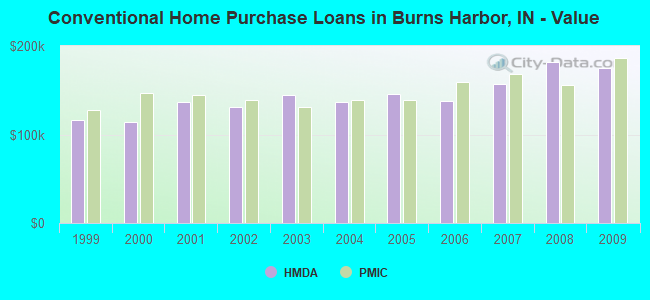
B) Conventional Home Purchase Loans
C) Refinancings
D) Home Improvement Loans
F) Non-occupant Loans on < 5 Family Dwellings (A B C & D)
G) Loans On Manufactured Home Dwelling (A B C & D)
Number
Average Value
Number
Average Value
Number
Average Value
Number
Average Value
Number
Average Value
Number
Average Value
LOANS ORIGINATED
14
$155,896
16
$174,589
116
$170,227
5
$131,476
10
$236,721
0
$0
APPLICATIONS APPROVED, NOT ACCEPTED
0
$0
2
$158,700
11
$170,134
0
$0
0
$0
0
$0
APPLICATIONS DENIED
2
$77,660
4
$357,362
35
$211,766
2
$179,470
4
$488,072
1
$26,190
APPLICATIONS WITHDRAWN
0
$0
0
$0
20
$166,107
0
$0
0
$0
0
$0
FILES CLOSED FOR INCOMPLETENESS
0
$0
0
$0
7
$170,796
1
$182,410
0
$0
0
$0
Aggregated Statistics For Year 2008 (Based on 1 partial tract)
A) FHA, FSA/RHS & VA Home Purchase Loans
B) Conventional Home Purchase Loans
C) Refinancings
D) Home Improvement Loans
F) Non-occupant Loans on < 5 Family Dwellings (A B C & D)
G) Loans On Manufactured Home Dwelling (A B C & D)
Number
Average Value
Number
Average Value
Number
Average Value
Number
Average Value
Number
Average Value
Number
Average Value
LOANS ORIGINATED
18
$169,689
27
$182,021
54
$160,976
8
$46,166
7
$212,463
3
$95,417
APPLICATIONS APPROVED, NOT ACCEPTED
1
$317,400
3
$181,353
7
$149,769
0
$0
0
$0
0
$0
APPLICATIONS DENIED
3
$281,437
3
$213,410
29
$174,699
5
$64,564
1
$393,710
0
$0
APPLICATIONS WITHDRAWN
0
$0
0
$0
9
$168,811
1
$40,630
0
$0
0
$0
FILES CLOSED FOR INCOMPLETENESS
0
$0
2
$112,650
3
$124,013
0
$0
0
$0
0
$0
Aggregated Statistics For Year 2007 (Based on 1 partial tract)
A) FHA, FSA/RHS & VA Home Purchase Loans
B) Conventional Home Purchase Loans
C) Refinancings
D) Home Improvement Loans
F) Non-occupant Loans on < 5 Family Dwellings (A B C & D)
G) Loans On Manufactured Home Dwelling (A B C & D)
Number
Average Value
Number
Average Value
Number
Average Value
Number
Average Value
Number
Average Value
Number
Average Value
LOANS ORIGINATED
6
$143,652
47
$157,458
56
$152,317
7
$38,829
5
$239,566
1
$26,640
APPLICATIONS APPROVED, NOT ACCEPTED
0
$0
6
$152,682
7
$171,634
3
$63,510
0
$0
0
$0
APPLICATIONS DENIED
1
$125,970
8
$132,798
29
$160,641
9
$57,090
0
$0
2
$53,275
APPLICATIONS WITHDRAWN
1
$183,310
2
$88,720
10
$165,430
1
$70,890
1
$80,820
0
$0
FILES CLOSED FOR INCOMPLETENESS
0
$0
1
$172,470
7
$134,999
1
$101,140
0
$0
0
$0
Aggregated Statistics For Year 2006 (Based on 1 partial tract)
A) FHA, FSA/RHS & VA Home Purchase Loans
B) Conventional Home Purchase Loans
C) Refinancings
D) Home Improvement Loans
E) Loans on Dwellings For 5+ Families
F) Non-occupant Loans on < 5 Family Dwellings (A B C & D)
G) Loans On Manufactured Home Dwelling (A B C & D)
Number
Average Value
Number
Average Value
Number
Average Value
Number
Average Value
Number
Average Value
Number
Average Value
Number
Average Value
LOANS ORIGINATED
7
$150,091
72
$138,222
56
$141,731
10
$47,272
1
$2,153,660
6
$180,148
1
$109,710
APPLICATIONS APPROVED, NOT ACCEPTED
1
$169,760
8
$123,485
11
$133,193
1
$108,360
0
$0
1
$67,730
1
$23,480
APPLICATIONS DENIED
0
$0
9
$169,312
32
$144,621
5
$53,186
0
$0
2
$248,325
1
$12,190
APPLICATIONS WITHDRAWN
0
$0
3
$192,640
23
$133,526
1
$72,240
0
$0
1
$423,960
0
$0
FILES CLOSED FOR INCOMPLETENESS
0
$0
1
$176,990
5
$169,674
0
$0
0
$0
0
$0
0
$0
Aggregated Statistics For Year 2005 (Based on 1 partial tract)
A) FHA, FSA/RHS & VA Home Purchase Loans
B) Conventional Home Purchase Loans
C) Refinancings
D) Home Improvement Loans
F) Non-occupant Loans on < 5 Family Dwellings (A B C & D)
G) Loans On Manufactured Home Dwelling (A B C & D)
Number
Average Value
Number
Average Value
Number
Average Value
Number
Average Value
Number
Average Value
Number
Average Value
LOANS ORIGINATED
10
$173,647
79
$145,880
63
$148,407
10
$58,063
21
$184,642
3
$23,630
APPLICATIONS APPROVED, NOT ACCEPTED
1
$229,810
9
$115,584
9
$133,946
2
$76,080
3
$108,660
1
$14,450
APPLICATIONS DENIED
1
$122,810
14
$76,174
33
$125,654
10
$38,829
3
$108,210
8
$42,102
APPLICATIONS WITHDRAWN
0
$0
10
$179,832
25
$143,252
1
$29,350
3
$119,647
0
$0
FILES CLOSED FOR INCOMPLETENESS
0
$0
2
$90,300
8
$112,029
0
$0
0
$0
1
$94,360
Aggregated Statistics For Year 2004 (Based on 1 partial tract)
A) FHA, FSA/RHS & VA Home Purchase Loans
B) Conventional Home Purchase Loans
C) Refinancings
D) Home Improvement Loans
F) Non-occupant Loans on < 5 Family Dwellings (A B C & D)
G) Loans On Manufactured Home Dwelling (A B C & D)
Number
Average Value
Number
Average Value
Number
Average Value
Number
Average Value
Number
Average Value
Number
Average Value
LOANS ORIGINATED
6
$147,340
57
$136,401
78
$122,982
12
$70,283
11
$133,890
1
$43,340
APPLICATIONS APPROVED, NOT ACCEPTED
0
$0
11
$166,563
11
$131,140
3
$24,983
2
$213,335
0
$0
APPLICATIONS DENIED
1
$108,810
14
$107,489
33
$122,521
8
$26,130
3
$179,697
5
$64,746
APPLICATIONS WITHDRAWN
0
$0
6
$190,910
24
$135,092
1
$110,620
1
$448,340
0
$0
FILES CLOSED FOR INCOMPLETENESS
0
$0
1
$99,330
7
$118,036
1
$12,190
0
$0
1
$90,300
Aggregated Statistics For Year 2003 (Based on 1 partial tract)
A) FHA, FSA/RHS & VA Home Purchase Loans
B) Conventional Home Purchase Loans
C) Refinancings
D) Home Improvement Loans
F) Non-occupant Loans on < 5 Family Dwellings (A B C & D)
Number
Average Value
Number
Average Value
Number
Average Value
Number
Average Value
Number
Average Value
LOANS ORIGINATED
8
$130,879
47
$144,586
166
$134,539
7
$27,864
11
$160,405
APPLICATIONS APPROVED, NOT ACCEPTED
0
$0
3
$257,357
24
$120,607
2
$58,020
2
$104,520
APPLICATIONS DENIED
0
$0
5
$143,848
35
$108,425
4
$21,445
4
$92,445
APPLICATIONS WITHDRAWN
0
$0
6
$180,825
32
$123,288
1
$21,220
3
$217,473
FILES CLOSED FOR INCOMPLETENESS
0
$0
2
$182,180
6
$116,938
0
$0
1
$80,820
Aggregated Statistics For Year 2002 (Based on 1 partial tract)
A) FHA, FSA/RHS & VA Home Purchase Loans
B) Conventional Home Purchase Loans
C) Refinancings
D) Home Improvement Loans
F) Non-occupant Loans on < 5 Family Dwellings (A B C & D)
Number
Average Value
Number
Average Value
Number
Average Value
Number
Average Value
Number
Average Value
LOANS ORIGINATED
9
$112,423
47
$131,031
126
$123,492
6
$47,182
12
$143,539
APPLICATIONS APPROVED, NOT ACCEPTED
0
$0
5
$98,968
20
$123,846
0
$0
0
$0
APPLICATIONS DENIED
1
$188,280
8
$89,002
32
$102,843
3
$9,480
3
$188,427
APPLICATIONS WITHDRAWN
0
$0
3
$103,243
23
$116,271
1
$24,830
1
$160,280
FILES CLOSED FOR INCOMPLETENESS
0
$0
1
$28,900
6
$88,343
0
$0
0
$0
Aggregated Statistics For Year 2001 (Based on 1 partial tract)
A) FHA, FSA/RHS & VA Home Purchase Loans
B) Conventional Home Purchase Loans
C) Refinancings
D) Home Improvement Loans
F) Non-occupant Loans on < 5 Family Dwellings (A B C & D)
Number
Average Value
Number
Average Value
Number
Average Value
Number
Average Value
Number
Average Value
LOANS ORIGINATED
8
$121,341
39
$136,226
96
$127,027
10
$33,276
9
$171,018
APPLICATIONS APPROVED, NOT ACCEPTED
0
$0
4
$90,638
8
$119,816
2
$18,510
0
$0
APPLICATIONS DENIED
0
$0
8
$55,365
33
$92,256
5
$19,866
1
$185,120
APPLICATIONS WITHDRAWN
0
$0
2
$128,450
23
$113,837
0
$0
2
$113,325
FILES CLOSED FOR INCOMPLETENESS
0
$0
0
$0
3
$125,367
0
$0
0
$0
Aggregated Statistics For Year 2000 (Based on 1 partial tract)
A) FHA, FSA/RHS & VA Home Purchase Loans
B) Conventional Home Purchase Loans
C) Refinancings
D) Home Improvement Loans
F) Non-occupant Loans on < 5 Family Dwellings (A B C & D)
Number
Average Value
Number
Average Value
Number
Average Value
Number
Average Value
Number
Average Value
LOANS ORIGINATED
5
$95,538
42
$114,595
33
$84,595
10
$27,000
5
$121,002
APPLICATIONS APPROVED, NOT ACCEPTED
0
$0
5
$78,832
5
$74,226
1
$7,680
0
$0
APPLICATIONS DENIED
0
$0
12
$29,348
16
$62,956
8
$25,905
0
$0
APPLICATIONS WITHDRAWN
0
$0
4
$78,335
11
$93,215
2
$56,890
0
$0
FILES CLOSED FOR INCOMPLETENESS
0
$0
0
$0
2
$50,795
0
$0
0
$0
Aggregated Statistics For Year 1999 (Based on 1 partial tract)
A) FHA, FSA/RHS & VA Home Purchase Loans
B) Conventional Home Purchase Loans
C) Refinancings
D) Home Improvement Loans
F) Non-occupant Loans on < 5 Family Dwellings (A B C & D)
Detailed PMIC statistics for the following Tracts:0503.00
2002 - 2017 National Fire Incident Reporting System (NFIRS) incidents
Based on the data from the years 2002 - 2017 the average number of fire incidents per year is 10. The highest number of reported fire incidents - 25 took place in 2005, and the least - 0 in 2014. The data has an increasing trend.
When looking into fire subcategories, the most reports belonged to: Outside Fires (34.0%), and Structure Fires (29.0%).
Fire incident types reported to NFIRS in Burns Harbor, IN


 Recent articles from our blog. Our writers, many of them Ph.D. graduates or candidates, create easy-to-read articles on a wide variety of topics.

 (11.7 miles


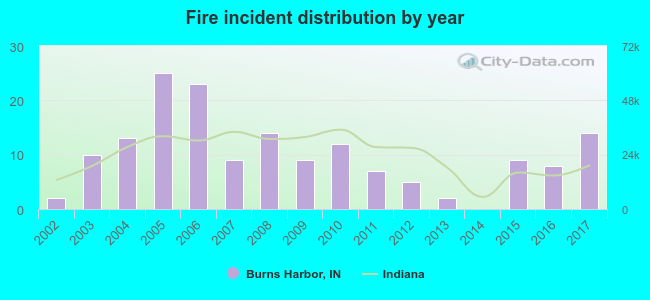 Based on the data from the years 2002 - 2017 the average number of fire incidents per year is 10. The highest number of reported fire incidents - 25 took place in 2005, and the least - 0 in 2014. The data has an increasing trend.
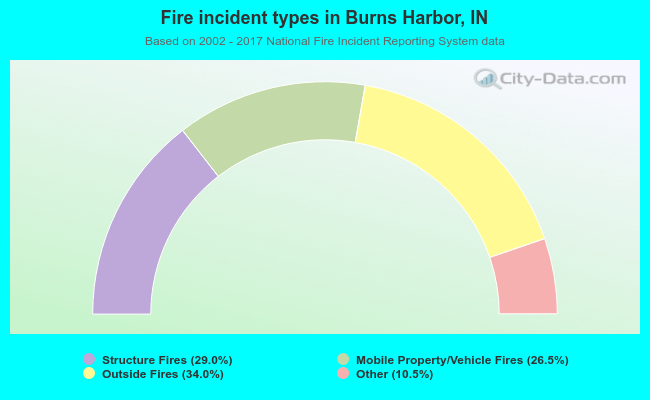 When looking into fire subcategories, the most reports belonged to: Outside Fires (34.0%), and Structure Fires (29.0%).