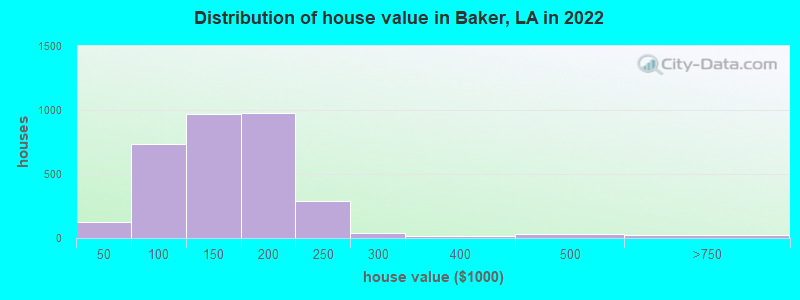
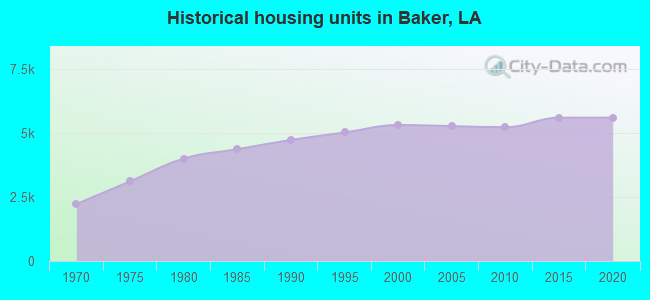
Estimated median house or condo value in 2022: $139,575 (it was $69,800 in 2000)
Baker:
$139,575
LA:
$209,200
Mean prices in 2022:all housing units: $314,691; detached houses: $326,152; townhouses or other attached units: $344,486; in 2-unit structures: $197,470; in 3-to-4-unit structures: $121,727; in 5-or-more-unit structures: $154,338; mobile homes: $86,125; occupied boats, rvs, vans, etc.: $202,708
Median gross rent in 2022: $1,041.
March 2022 cost of living index in Baker: 88.7 (less than average, U.S. average is 100)
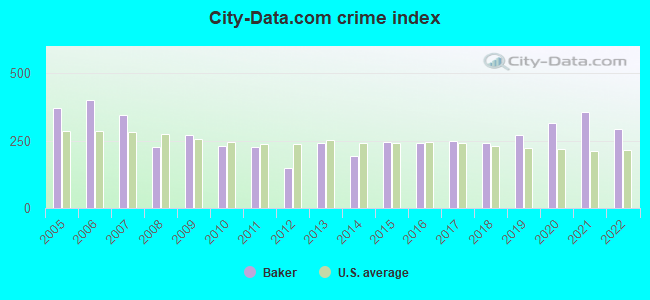
The City-Data.com crime index weighs serious crimes and violent crimes more heavily. Higher means more crime, U.S. average is 246.1. It adjusts for the number of visitors and daily workers commuting into cities.
Latest news from Baker, LA collected exclusively by city-data.com from local newspapers, TV, and radio stations
Ancestries: American (3.7%), African (2.2%), English (1.1%).
Current Local Time: CST time zone
Elevation: 80 feet
Land area: 7.89 square miles.
Population density: 1,542 people per square mile (low).
28 residents are foreign born
This city:
0.2%
Louisiana:
4.2%
Median real estate property taxes paid for housing units with mortgages in 2022: $578 (0.4%) Median real estate property taxes paid for housing units with no mortgage in 2022: $209 (0.2%)
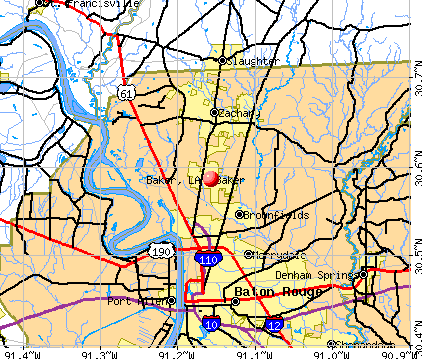
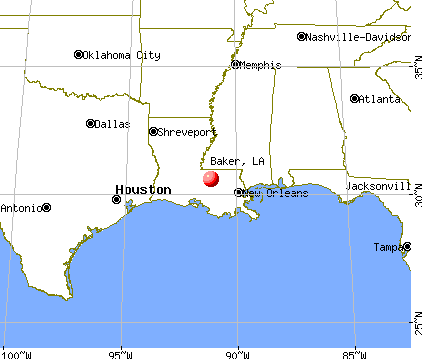
Nearest city with pop. 50,000+: Baton Rouge, LA (8.9 miles , pop. 227,818).
Nearest city with pop. 1,000,000+: Houston, TX (259.0 miles , pop. 1,953,631).
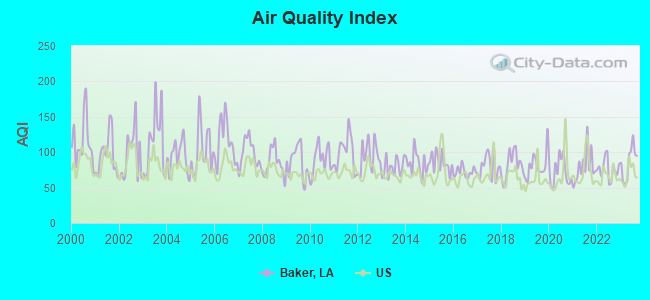
Air Quality Index (AQI) level in 2023 was 85.9. This is about average.
City:
85.9
U.S.:
72.6
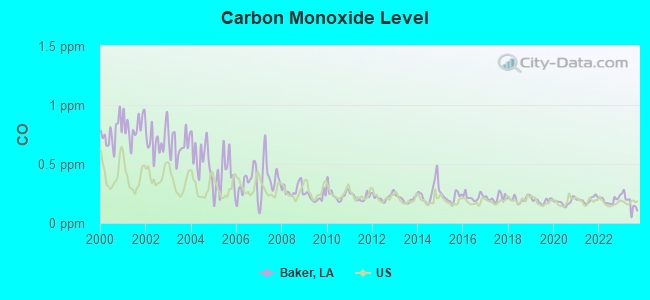
Carbon Monoxide (CO) [ppm] level in 2023 was 0.174. This is significantly better than average.Closest monitor was 6.5 miles away from the city center.
City:
0.174
U.S.:
0.251
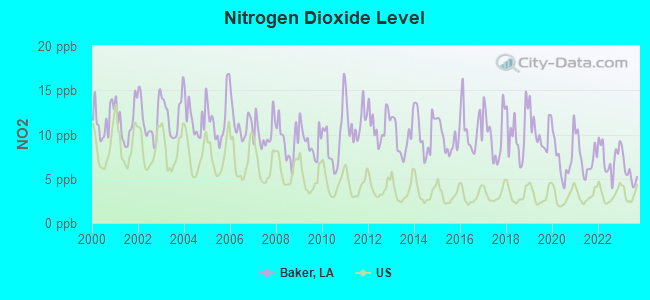
Nitrogen Dioxide (NO2) [ppb] level in 2023 was 5.74. This is about average.Closest monitor was 5.7 miles away from the city center.
City:
5.74
U.S.:
5.11
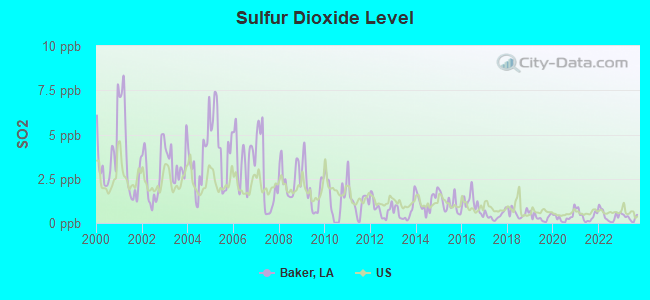
Sulfur Dioxide (SO2) [ppb] level in 2023 was 0.314. This is significantly better than average.Closest monitor was 6.5 miles away from the city center.
City:
0.314
U.S.:
1.515
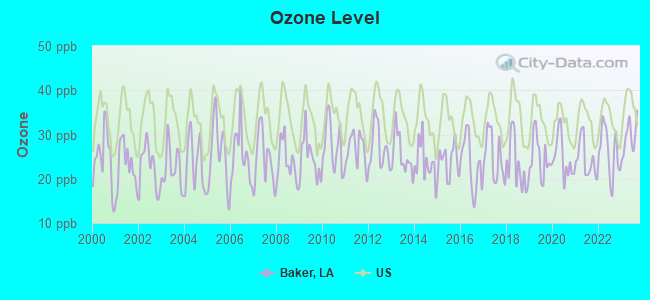
Ozone [ppb] level in 2023 was 29.4. This is about average.Closest monitor was 6.5 miles away from the city center.
City:
29.4
U.S.:
33.3
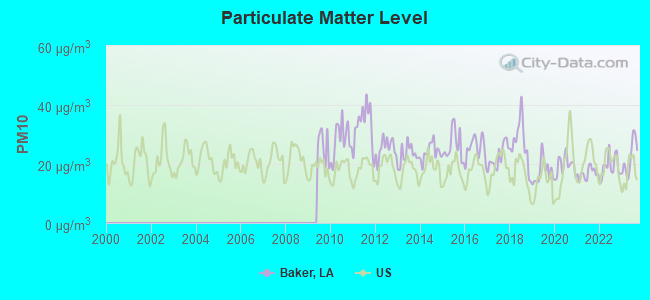
Particulate Matter (PM10) [µg/m3] level in 2023 was 22.2. This is about average.Closest monitor was 6.5 miles away from the city center.
City:
22.2
U.S.:
19.2
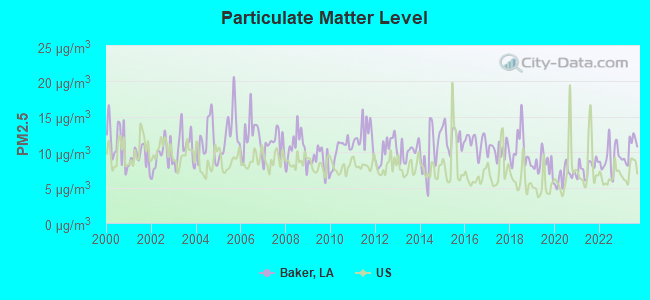
Particulate Matter (PM2.5) [µg/m3] level in 2023 was 10.4. This is worse than average.Closest monitor was 5.7 miles away from the city center.
City:
10.4
U.S.:
8.1
Tornado activity:
Baker-area historical tornado activity is near Louisiana state average. It is 73% greater than the overall U.S. average.
On 10/14/1984, a category F3 (max. wind speeds 158-206 mph) tornado 4.5 miles away from the Baker city center injured 3 peopleand causedbetween $50,000 and $500,000 in damages.
On 9/16/1971, a category F3 tornado 5.7 miles away from the city center injured 3 peopleand causedbetween $500,000 and $5,000,000 in damages.
Earthquake activity:
Baker-area historical earthquake activity is significantly above Louisiana state average. It is 43% smaller than the overall U.S. average.
On 9/10/2006 at 14:56:08, a magnitude 5.9 (5.9 MB, 5.5 MS, 5.8 MW, Class: Moderate, Intensity: VI - VII) earthquake occurred 407.1 miles away from the city center On 5/17/2012 at 08:12:00, a magnitude 4.8 (4.8 MW, Depth: 3.1 mi, Class: Light, Intensity: IV - V) earthquake occurred 211.3 miles away from Baker center On 10/24/1997 at 08:35:17, a magnitude 4.9 (4.8 MB, 4.2 MS, 4.9 LG, Depth: 6.2 mi) earthquake occurred 233.7 miles away from the city center On 5/6/2018 at 16:47:09, a magnitude 4.6 (4.6 MB, Depth: 6.2 mi) earthquake occurred 240.1 miles away from the city center On 1/18/1999 at 07:00:53, a magnitude 4.8 (4.8 MB, 4.0 LG, Depth: 0.6 mi) earthquake occurred 300.7 miles away from Baker center On 6/30/1994 at 01:08:24, a magnitude 4.2 (4.2 MB, Depth: 6.2 mi) earthquake occurred 194.2 miles away from the city center Magnitude types: regional Lg-wave magnitude (LG), body-wave magnitude (MB), surface-wave magnitude (MS), moment magnitude (MW)
Natural disasters:
The number of natural disasters in East Baton Rouge Parish (28) is a lot greater than the US average (15). Major Disasters (Presidential) Declared: 20 Emergencies Declared: 5
Causes of natural disasters: Hurricanes: 14, Floods: 8, Storms: 7, Tropical Storms: 3, Tornado: 1, Other: 2 (Note: some incidents may be assigned to more than one category).
Hospitals and medical centers in Baker:
HIGHLAND HOSPICE AND PALLIATIVE CARE OF LA (5280 GROOM ROAD STE A)
DESTINY HOME HEALTH (1225 ALABAMA STREET)
RAPHAEL HOME HEALTH (2944 RAY WEILAND DR)
COMMUNITY CARE CTR OF BAKER (3612 BAKER RD)
NORTHRIDGE CARE CENTER (3612 BAKER BLVD)
Amtrak station near Baker:
10 miles: BATON ROUGE (1253 FLORIDA ST.) - Bus Station . Services: enclosed waiting area, public restrooms, public payphones, call for taxi service, intercity bus service, public transit connection.
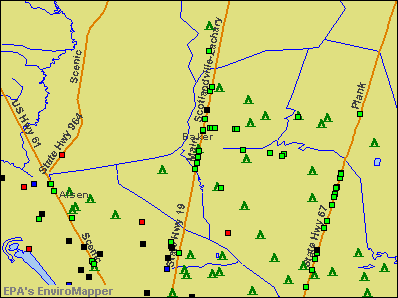
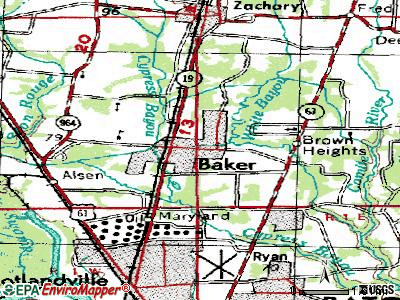
Notable locations in Baker: Community Care Center of Baker (A), Baker Heritage Museum and Cultural Center (B), East Baton Rouge Parish Library Baker Branch (C), Baker Police Department (D), Baker Fire Department Substation (E), Baker Fire Department Main Station (F), Heritage Museum (G). Display/hide their locations on the map
Shopping Centers: Baker Plaza Shopping Center (1), Furrs Shopping Center (2), Baker Regional Shopping Center (3), La Petite Shopping Center (4). Display/hide their locations on the map
Churches in Baker include: New Beginnings Church of God (A), Sweet Home Church (B), Kingdom Hall of Jehovahs Witnesses (C), Freedom Land Missionary Baptist Church (D), Grace United Pentecostal Church (E), First Baptist Church of Baker (F), Harding Street Baptist Church (G), Faith Healing and Deliverance Church (H), Circle Baptist Church (I). Display/hide their locations on the map
Parks in Baker include: Baker Park (1), Myrtle Park (2), Tristian Park (3), Harding Park (4), Chamberland Park (5), Jefferson Park (6). Display/hide their locations on the map
Tourist attraction: Heritage Museum & Cultural Center (1606 Main Street).
Court: Baker City - Clerk of Court (1320 Alabama Street).
Birthplace of: Hokie Gajan - Football player.
East Baton Rouge Parish has a predicted average indoor radon screening level less than 2 pCi/L (pico curies per liter) - Low Potential
Drinking water stations with addresses in Baker and their reported violations in the past:
CITY OF BAKER WATER SYSTEM (Population served: 15,891, Groundwater):
Past monitoring violations:
Monitoring and Reporting (DBP) - Between APR-2014 and JUN-2014, Contaminant: TTHM. Follow-up actions: St Violation/Reminder Notice (AUG-14-2014), St Public Notif requested (AUG-14-2014)
Monitoring and Reporting (DBP) - Between APR-2014 and JUN-2014, Contaminant: Total Haloacetic Acids (HAA5). Follow-up actions: St Violation/Reminder Notice (AUG-14-2014), St Public Notif requested (AUG-14-2014)
Monitoring and Reporting (DBP) - Between JAN-2014 and MAR-2014, Contaminant: TTHM. Follow-up actions: St Violation/Reminder Notice (APR-16-2014), St Public Notif requested (APR-16-2014)
Monitoring and Reporting (DBP) - Between JAN-2014 and MAR-2014, Contaminant: Total Haloacetic Acids (HAA5). Follow-up actions: St Violation/Reminder Notice (APR-16-2014), St Public Notif requested (APR-16-2014)
Monitoring, Source Water (GWR) - In SEP-29-2010, Contaminant: E. COLI. Follow-up actions: St Compliance achieved (OCT-26-2010)
One regular monitoring violation
2 other older monitoring violations
Average household size:
This city:
2.8 people
Louisiana:
2.5 people
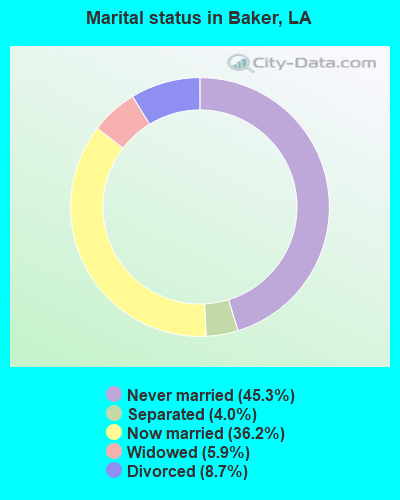
Percentage of family households:
This city:
72.8%
Whole state:
67.1%
Percentage of households with unmarried partners:
This city:
6.6%
Whole state:
6.8%
Likely homosexual households (counted as self-reported same-sex unmarried-partner households)
Lesbian couples: 0.4% of all households
Gay men: 0.2% of all households
People in group quarters in Baker in 2010:
172 people in nursing facilities/skilled-nursing facilities
10 people in group homes for juveniles (non-correctional)
10 people in group homes intended for adults
82 people in nursing homes in 2000
16 people in college dormitories (includes college quarters off campus) in 2000
Banks with branches in Baker (2011 data):
JPMorgan Chase Bank, National Association: Baker Branch at 1702 Main Street, branch established on 1960/05/02. Info updated 2011/11/10: Bank assets: $1,811,678.0 mil, Deposits: $1,190,738.0 mil, headquarters in Columbus, OH, positive income, International Specialization, 5577 total offices, Holding Company: Jpmorgan Chase & Co.
Woodforest National Bank: La Baker Branch at 14507 Plank Road, branch established on 2009/08/22. Info updated 2011/05/10: Bank assets: $3,488.9 mil, Deposits: $3,097.6 mil, headquarters in Houston, TX, positive income, Commercial Lending Specialization, 766 total offices, Holding Company: Woodforest Financial Group Employee Stock Ownership Plan (With 401(K) Provisions)
Whitney Bank: Ray Weiland Branch at 3033 Ray Weiland, branch established on 1960/07/05. Info updated 2011/06/14: Bank assets: $14,882.3 mil, Deposits: $11,630.0 mil, headquarters in New Orleans, LA, positive income, Commercial Lending Specialization, 189 total offices, Holding Company: Hancock Holding Company
Capital One, National Association: Baker Branch at 2082 Main Street, branch established on 1977/02/01. Info updated 2011/07/01: Bank assets: $133,477.8 mil, Deposits: $97,063.7 mil, headquarters in Mclean, VA, positive income, 984 total offices, Holding Company: Capital One Financial Corporation
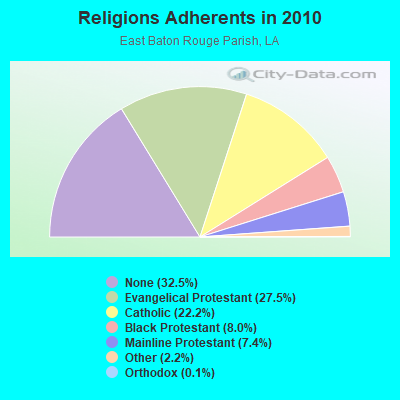
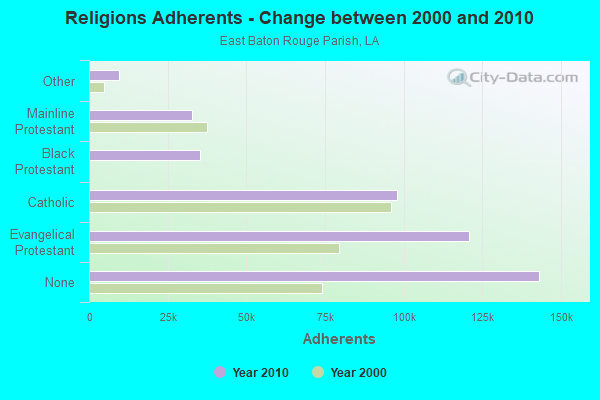
Religion statistics for Baker, LA (based on East Baton Rouge Parish data)
Religion
Adherents
Congregations
Evangelical Protestant
120,949
258
Catholic
97,904
24
Black Protestant
35,272
64
Mainline Protestant
32,765
50
Other
9,604
36
Orthodox
457
4
None
143,220
-
Source: Clifford Grammich, Kirk Hadaway, Richard Houseal, Dale E.Jones, Alexei Krindatch, Richie Stanley and Richard H.Taylor. 2012. 2010 U.S.Religion Census: Religious Congregations & Membership Study. Association of Statisticians of American Religious Bodies. Jones, Dale E., et al. 2002. Congregations and Membership in the United States 2000. Nashville, TN: Glenmary Research Center. Graphs represent county-level data
Aircraft: CONDOR RAPTOR (Category: Land, Seats: 2, Weight: Up to 12,499 Pounds), Engine: ROTAX 582E (65 HP) (2 Cycle) N-Number: 3858H, N3858H, N-3858H, Serial Number: 0467, Year manufactured: 2005, Airworthiness Date: 12/12/2007, Certificate Issue Date: 08/28/2019 Registrant (Individual): Donald E Biggs, 12106 Lancewood Dr, Baker, LA 70714
Aircraft: BEECH G35 (Category: Land, Seats: 4, Weight: Up to 12,499 Pounds, Speed: 131 mph), Engine: CONT MOTOR E225 SERIES (225 HP) (Reciprocating) N-Number: 4295D, N4295D, N-4295D, Serial Number: D-4514, Year manufactured: 1956, Airworthiness Date: 02/20/1956, Certificate Issue Date: 06/07/2006 Registrant (Individual): Albert Ii Rutherford, 13811 Felicity Dr, Baker, LA 70714
Aircraft: BAKER DANIEL E VANS RV9A (Category: Land, Seats: 2, Weight: Up to 12,499 Pounds), Engine: LYCOMING O-320-D3G (160 HP) (Reciprocating) N-Number: 484DB, N484DB, N-484DB, Serial Number: 91137, Year manufactured: 2013, Airworthiness Date: 10/08/2013, Certificate Issue Date: 08/20/2013 Registrant (Individual): Daniel E Baker, 14910 Brown Rd, Baker, LA 70714
Aircraft: CESSNA 150H (Category: Land, Seats: 2, Weight: Up to 12,499 Pounds, Speed: 90 mph), Engine: Reciprocating N-Number: 503TC, N503TC, N-503TC, Serial Number: 15069261, Airworthiness Date: 07/15/1968, Certificate Issue Date: 02/08/1993 Registrant (Individual): Joseph J Foretich, 12282 Blackwater Rd, Baker, LA 70714
Aircraft: BEECH C24R (Category: Land, Seats: 6, Weight: Up to 12,499 Pounds, Speed: 178 mph), Engine: LYCOMING I0360 SER A&C (200 HP) (Reciprocating) N-Number: 6164C, N6164C, N-6164C, Serial Number: MC-769, Year manufactured: 1981, Airworthiness Date: 12/11/1981, Certificate Issue Date: 06/08/2016 Registrant (LLC): N6164c LLC, 13073 Plank Rd, Baker, LA 70714
Aircraft: INNOVATIVE RECREATIONAL TECH ULTRA SPORT (Category: Land, Seats: 2, Weight: Up to 12,499 Pounds), Engine: 4 Cycle N-Number: 125US, N125US, N-125US, Serial Number: US10-001, Certificate Issue Date: 08/01/2013 Registrant (Individual): Donald E Biggs, 12106 Lancewood Dr, Baker, LA 70714 Deregistered:Cancel Date: 08/09/1995
Aircraft: FLIGHT DESIGN GMBH CTSW (Category: Land, Seats: 2, Weight: Up to 12,499 Pounds), Engine: ROTAX 912ULS SERIES (100 HP) (4 Cycle) N-Number: 329CT, N329CT, N-329CT, Serial Number: 07-01-09, Year manufactured: 2007, Airworthiness Date: 04/06/2007, Certificate Issue Date: 03/05/2016 Registrant (Individual): Donald E Biggs, 12106 Lancewood Dr, Baker, LA 70714 Deregistered:Cancel Date: 01/04/2018
Home Mortgage Disclosure Act Aggregated Statistics For Year 2009 (Based on 1 full and 3 partial tracts)
A) FHA, FSA/RHS & VA Home Purchase Loans
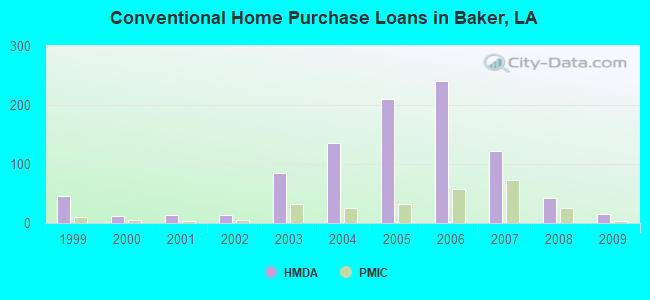
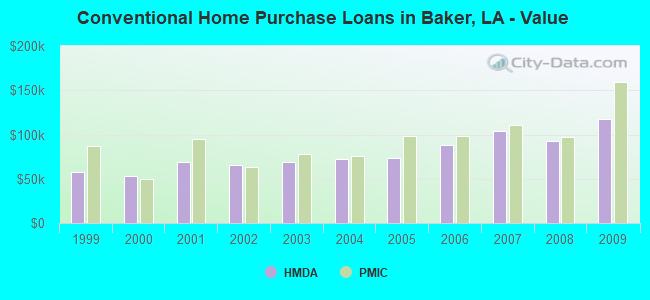
B) Conventional Home Purchase Loans
C) Refinancings
D) Home Improvement Loans
F) Non-occupant Loans on < 5 Family Dwellings (A B C & D)
G) Loans On Manufactured Home Dwelling (A B C & D)
Number
Average Value
Number
Average Value
Number
Average Value
Number
Average Value
Number
Average Value
Number
Average Value
LOANS ORIGINATED
47
$118,377
16
$117,761
64
$108,282
14
$23,259
12
$89,342
1
$41,780
APPLICATIONS APPROVED, NOT ACCEPTED
4
$98,920
3
$107,480
20
$119,951
1
$18,110
0
$0
0
$0
APPLICATIONS DENIED
17
$120,584
7
$106,781
115
$111,873
20
$45,628
2
$46,835
1
$26,040
APPLICATIONS WITHDRAWN
11
$113,927
5
$83,004
34
$120,639
3
$19,433
1
$59,160
0
$0
FILES CLOSED FOR INCOMPLETENESS
4
$85,755
1
$132,000
15
$111,136
3
$91,800
1
$36,820
0
$0
Aggregated Statistics For Year 2008 (Based on 1 full and 3 partial tracts)
A) FHA, FSA/RHS & VA Home Purchase Loans
B) Conventional Home Purchase Loans
C) Refinancings
D) Home Improvement Loans
F) Non-occupant Loans on < 5 Family Dwellings (A B C & D)
G) Loans On Manufactured Home Dwelling (A B C & D)
Number
Average Value
Number
Average Value
Number
Average Value
Number
Average Value
Number
Average Value
Number
Average Value
LOANS ORIGINATED
51
$114,844
42
$93,033
116
$109,708
19
$27,422
24
$99,103
3
$38,240
APPLICATIONS APPROVED, NOT ACCEPTED
5
$96,864
11
$88,371
36
$113,579
3
$63,210
6
$62,545
2
$30,640
APPLICATIONS DENIED
22
$117,315
31
$85,151
157
$120,401
49
$72,225
9
$71,372
10
$45,056
APPLICATIONS WITHDRAWN
3
$94,093
4
$99,315
30
$120,465
3
$57,470
2
$87,640
0
$0
FILES CLOSED FOR INCOMPLETENESS
4
$109,198
2
$107,360
10
$95,845
1
$51,480
1
$40,680
0
$0
Aggregated Statistics For Year 2007 (Based on 1 full and 3 partial tracts)
A) FHA, FSA/RHS & VA Home Purchase Loans
B) Conventional Home Purchase Loans
C) Refinancings
D) Home Improvement Loans
E) Loans on Dwellings For 5+ Families
F) Non-occupant Loans on < 5 Family Dwellings (A B C & D)
G) Loans On Manufactured Home Dwelling (A B C & D)
Number
Average Value
Number
Average Value
Number
Average Value
Number
Average Value
Number
Average Value
Number
Average Value
Number
Average Value
LOANS ORIGINATED
20
$117,846
122
$104,246
165
$98,495
28
$37,723
1
$1,380,780
43
$92,967
6
$37,383
APPLICATIONS APPROVED, NOT ACCEPTED
2
$152,915
33
$105,199
62
$100,152
10
$33,238
0
$0
8
$68,531
3
$37,733
APPLICATIONS DENIED
5
$124,820
80
$100,986
215
$103,571
62
$57,740
0
$0
17
$50,211
5
$59,654
APPLICATIONS WITHDRAWN
5
$116,728
12
$109,203
61
$107,219
6
$110,498
0
$0
3
$107,063
0
$0
FILES CLOSED FOR INCOMPLETENESS
2
$97,315
7
$116,071
24
$107,836
0
$0
0
$0
1
$80,590
0
$0
Aggregated Statistics For Year 2006 (Based on 1 full and 3 partial tracts)
A) FHA, FSA/RHS & VA Home Purchase Loans
B) Conventional Home Purchase Loans
C) Refinancings
D) Home Improvement Loans
F) Non-occupant Loans on < 5 Family Dwellings (A B C & D)
G) Loans On Manufactured Home Dwelling (A B C & D)
Number
Average Value
Number
Average Value
Number
Average Value
Number
Average Value
Number
Average Value
Number
Average Value
LOANS ORIGINATED
24
$104,565
240
$87,709
166
$91,093
33
$30,537
59
$83,548
5
$23,400
APPLICATIONS APPROVED, NOT ACCEPTED
3
$110,597
81
$81,898
63
$102,157
1
$7,490
17
$80,691
2
$35,500
APPLICATIONS DENIED
4
$81,745
140
$84,136
216
$97,033
66
$60,083
32
$84,084
6
$41,442
APPLICATIONS WITHDRAWN
2
$147,265
38
$77,252
79
$104,447
11
$55,938
5
$52,686
0
$0
FILES CLOSED FOR INCOMPLETENESS
3
$112,403
12
$85,567
46
$104,348
1
$144,890
4
$92,765
0
$0
Aggregated Statistics For Year 2005 (Based on 1 full and 3 partial tracts)
A) FHA, FSA/RHS & VA Home Purchase Loans
B) Conventional Home Purchase Loans
C) Refinancings
D) Home Improvement Loans
F) Non-occupant Loans on < 5 Family Dwellings (A B C & D)
G) Loans On Manufactured Home Dwelling (A B C & D)
Number
Average Value
Number
Average Value
Number
Average Value
Number
Average Value
Number
Average Value
Number
Average Value
LOANS ORIGINATED
22
$81,051
210
$73,390
173
$84,756
30
$26,903
76
$70,631
5
$30,456
APPLICATIONS APPROVED, NOT ACCEPTED
3
$81,333
61
$69,956
50
$90,741
7
$18,324
9
$71,009
3
$44,000
APPLICATIONS DENIED
9
$70,032
108
$79,704
265
$91,269
57
$42,369
32
$92,123
10
$39,135
APPLICATIONS WITHDRAWN
0
$0
63
$79,537
135
$111,233
18
$179,038
24
$74,152
1
$51,000
FILES CLOSED FOR INCOMPLETENESS
0
$0
9
$75,483
35
$96,441
0
$0
3
$92,757
0
$0
Aggregated Statistics For Year 2004 (Based on 1 full and 3 partial tracts)
A) FHA, FSA/RHS & VA Home Purchase Loans
B) Conventional Home Purchase Loans
C) Refinancings
D) Home Improvement Loans
F) Non-occupant Loans on < 5 Family Dwellings (A B C & D)
G) Loans On Manufactured Home Dwelling (A B C & D)
Number
Average Value
Number
Average Value
Number
Average Value
Number
Average Value
Number
Average Value
Number
Average Value
LOANS ORIGINATED
41
$81,625
136
$72,752
181
$79,792
23
$28,000
30
$66,360
2
$40,485
APPLICATIONS APPROVED, NOT ACCEPTED
1
$94,360
45
$72,222
97
$81,326
3
$55,737
9
$68,560
3
$40,220
APPLICATIONS DENIED
9
$81,001
68
$65,908
296
$83,725
34
$33,672
12
$53,512
14
$35,372
APPLICATIONS WITHDRAWN
10
$98,433
32
$67,956
155
$93,287
3
$58,377
10
$72,130
1
$46,740
FILES CLOSED FOR INCOMPLETENESS
2
$82,655
16
$77,572
19
$100,842
3
$42,333
0
$0
0
$0
Aggregated Statistics For Year 2003 (Based on 1 full and 3 partial tracts)
A) FHA, FSA/RHS & VA Home Purchase Loans
B) Conventional Home Purchase Loans
C) Refinancings
D) Home Improvement Loans
F) Non-occupant Loans on < 5 Family Dwellings (A B C & D)
Number
Average Value
Number
Average Value
Number
Average Value
Number
Average Value
Number
Average Value
LOANS ORIGINATED
53
$84,659
84
$68,868
222
$75,951
19
$14,946
25
$68,392
APPLICATIONS APPROVED, NOT ACCEPTED
3
$119,197
33
$82,197
74
$71,687
4
$23,818
4
$77,008
APPLICATIONS DENIED
7
$87,186
43
$68,134
220
$81,932
28
$28,177
9
$34,048
APPLICATIONS WITHDRAWN
5
$85,934
14
$77,004
118
$88,139
3
$9,693
6
$58,947
FILES CLOSED FOR INCOMPLETENESS
5
$83,018
7
$66,204
21
$83,083
0
$0
1
$32,520
Aggregated Statistics For Year 2002 (Based on 2 partial tracts)
A) FHA, FSA/RHS & VA Home Purchase Loans
B) Conventional Home Purchase Loans
C) Refinancings
D) Home Improvement Loans
F) Non-occupant Loans on < 5 Family Dwellings (A B C & D)
Number
Average Value
Number
Average Value
Number
Average Value
Number
Average Value
Number
Average Value
LOANS ORIGINATED
11
$73,796
13
$65,457
51
$73,235
9
$18,144
12
$49,958
APPLICATIONS APPROVED, NOT ACCEPTED
0
$0
5
$73,258
18
$74,113
2
$25,445
2
$83,135
APPLICATIONS DENIED
2
$81,930
14
$47,374
50
$64,125
9
$16,162
6
$43,573
APPLICATIONS WITHDRAWN
1
$84,780
2
$44,445
12
$56,184
0
$0
0
$0
FILES CLOSED FOR INCOMPLETENESS
0
$0
1
$52,990
15
$78,653
0
$0
0
$0
Aggregated Statistics For Year 2001 (Based on 2 partial tracts)
A) FHA, FSA/RHS & VA Home Purchase Loans
B) Conventional Home Purchase Loans
C) Refinancings
D) Home Improvement Loans
F) Non-occupant Loans on < 5 Family Dwellings (A B C & D)
Number
Average Value
Number
Average Value
Number
Average Value
Number
Average Value
Number
Average Value
LOANS ORIGINATED
10
$66,403
13
$68,390
47
$63,494
8
$20,734
7
$48,009
APPLICATIONS APPROVED, NOT ACCEPTED
0
$0
4
$42,450
14
$52,984
2
$22,985
1
$52,190
APPLICATIONS DENIED
2
$79,690
11
$53,044
63
$64,581
8
$13,369
3
$30,220
APPLICATIONS WITHDRAWN
2
$59,010
3
$60,020
31
$66,173
0
$0
1
$53,120
FILES CLOSED FOR INCOMPLETENESS
1
$105,020
1
$63,310
5
$75,396
0
$0
0
$0
Aggregated Statistics For Year 2000 (Based on 2 partial tracts)
A) FHA, FSA/RHS & VA Home Purchase Loans
B) Conventional Home Purchase Loans
C) Refinancings
D) Home Improvement Loans
F) Non-occupant Loans on < 5 Family Dwellings (A B C & D)
Number
Average Value
Number
Average Value
Number
Average Value
Number
Average Value
Number
Average Value
LOANS ORIGINATED
15
$65,038
12
$52,547
33
$62,794
9
$18,320
5
$46,024
APPLICATIONS APPROVED, NOT ACCEPTED
2
$65,855
4
$79,902
17
$61,581
2
$25,385
2
$38,500
APPLICATIONS DENIED
2
$66,100
9
$54,971
63
$61,062
15
$15,285
3
$29,307
APPLICATIONS WITHDRAWN
2
$50,375
6
$58,027
29
$52,881
1
$15,530
1
$32,530
FILES CLOSED FOR INCOMPLETENESS
0
$0
2
$68,560
12
$67,077
0
$0
1
$26,270
Aggregated Statistics For Year 1999 (Based on 3 partial tracts)
A) FHA, FSA/RHS & VA Home Purchase Loans
B) Conventional Home Purchase Loans
C) Refinancings
D) Home Improvement Loans
E) Loans on Dwellings For 5+ Families
F) Non-occupant Loans on < 5 Family Dwellings (A B C & D)
2004 - 2018 National Fire Incident Reporting System (NFIRS) incidents
Based on the data from the years 2004 - 2018 the average number of fires per year is 66. The highest number of reported fires - 145 took place in 2011, and the least - 16 in 2007. The data has a growing trend.
When looking into fire subcategories, the most reports belonged to: Structure Fires (49.7%), and Outside Fires (32.4%).
Fire incident types reported to NFIRS in Baker, LA
#98 on the list of "Top 101 cities with largest percentage of males in occupations: healthcare support occupations (population 5,000+)"
#98 on the list of "Top 101 cities with the largest positive percentage difference between never married females and males (15+ years) (with at least 1,000 females never married)"
#74 (70811) on the list of "Top 101 zip codes with the lowest 2012 average reported profit/loss from business (pop 5,000+)"
#76 (70807) on the list of "Top 101 zip codes with the lowest 2012 average net capital gain/loss (pop 5,000+)"
#82 (70807) on the list of "Top 101 zip codes with the smallest percentage of taxpayers reporting net capital gain/loss in 2012 (pop 1,000+)"
#98 (70807) on the list of "Top 101 zip codes with the lowest average reported salary/wage in 2012 (pop 5,000+)"
#6 on the list of "Top 101 counties with the highest number of infant deaths per 1000 residents 2007-2013 (pop. 50,000+)"
#24 on the list of "Top 101 counties with the most Black Protestant adherents"
#28 on the list of "Top 101 counties with the largest increase in the number of infant deaths per 1000 residents 2000-2006 to 2007-2013 (pop. 50,000+)"
#34 on the list of "Top 101 counties with the highest ground withdrawal of fresh water for public supply"
#37 on the list of "Top 101 counties with the lowest percentage of residents that drank alcohol in the past 30 days"


 Recent articles from our blog. Our writers, many of them Ph.D. graduates or candidates, create easy-to-read articles on a wide variety of topics.

 (8.9 miles


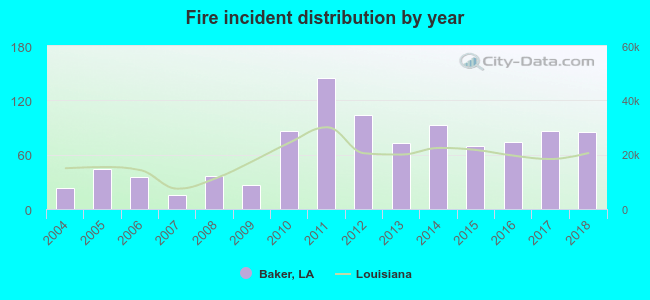 Based on the data from the years 2004 - 2018 the average number of fires per year is 66. The highest number of reported fires - 145 took place in 2011, and the least - 16 in 2007. The data has a growing trend.
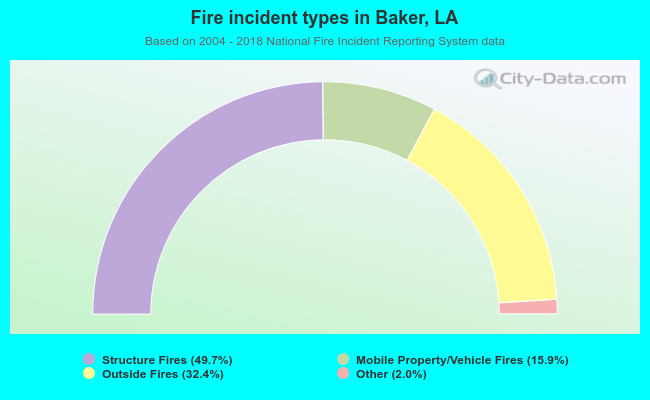 When looking into fire subcategories, the most reports belonged to: Structure Fires (49.7%), and Outside Fires (32.4%).