Estimated zip code population in 2022: 14,557
Zip code population in 2010: 14,853
Zip code population in 2000: 13,763
Houses and condos: 6,417
Renter-occupied apartments: 2,402
% of renters here:
40%State:
44%
March 2022 cost of living index in zip code 90305: 135.6
(high, U.S. average is 100)
Land area: 2.3
sq. mi.
Water area: 0.0
sq. mi.
Population density: 6,276 people per square mile (high).
OSM Map
General Map
Google Map
MSN Map
OSM Map
General Map
Google Map
MSN Map
OSM Map
General Map
Google Map
MSN Map
OSM Map
General Map
Google Map
MSN Map
Please wait while loading the map...
Real estate property taxes paid for housing units in 2022:
This zip code:
0.6% ($4,803)California:
0.7% ($4,831)
Median real estate property taxes paid for housing units with mortgages in 2022: $5,017 (0.6%)
Median real estate property taxes paid for housing units with no mortgage in 2022: $3,171 (0.4%)
Business Search - 14 Million verified businesses
Males: 6,716 Females: 7,840
For population 25 years and over in 90305:
High school or higher: 92.6%Bachelor's degree or higher: 34.5%Graduate or professional degree: 16.0%Unemployed: 6.6%Mean travel time to work (commute): 33.8 minutes
For population 15 years and over in 90305:
Never married: 42.4%Now married: 33.8%Separated: 3.2%Widowed: 6.2%Divorced: 14.4%
Zip code 90305 compared to state average:
Black race population percentage significantly above state average. Hispanic race population percentage below state average. Median age significantly above state average. Foreign-born population percentage below state average. Length of stay since moving in significantly above state average. House age above state average. 10,854 74.6% Black 2,131 14.6% Hispanic or Latino 719 4.9% Two or more races 620 4.3% White 156 1.1% Asian 37 0.3% Some other race 36 0.2% American Indian
Data:
Median household income ($)
Median household income (% change since 2000)
Household income diversity
Ratio of average income to average house value (%)
Ratio of average income to average rent
Median household income ($) - White
Median household income ($) - Black or African American
Median household income ($) - Asian
Median household income ($) - Hispanic or Latino
Median household income ($) - American Indian and Alaska Native
Median household income ($) - Multirace
Median household income ($) - Other Race
Median household income for houses/condos with a mortgage ($)
Median household income for apartments without a mortgage ($)
Races - White alone (%)
Races - White alone (% change since 2000)
Races - Black alone (%)
Races - Black alone (% change since 2000)
Races - American Indian alone (%)
Races - American Indian alone (% change since 2000)
Races - Asian alone (%)
Races - Asian alone (% change since 2000)
Races - Hispanic (%)
Races - Hispanic (% change since 2000)
Races - Native Hawaiian and Other Pacific Islander alone (%)
Races - Native Hawaiian and Other Pacific Islander alone (% change since 2000)
Races - Two or more races (%)
Races - Two or more races (% change since 2000)
Races - Other race alone (%)
Races - Other race alone (% change since 2000)
Racial diversity
Unemployment (%)
Unemployment (% change since 2000)
Unemployment (%) - White
Unemployment (%) - Black or African American
Unemployment (%) - Asian
Unemployment (%) - Hispanic or Latino
Unemployment (%) - American Indian and Alaska Native
Unemployment (%) - Multirace
Unemployment (%) - Other Race
Population density (people per square mile)
Population - Males (%)
Population - Females (%)
Population - Males (%) - White
Population - Males (%) - Black or African American
Population - Males (%) - Asian
Population - Males (%) - Hispanic or Latino
Population - Males (%) - American Indian and Alaska Native
Population - Males (%) - Multirace
Population - Males (%) - Other Race
Population - Females (%) - White
Population - Females (%) - Black or African American
Population - Females (%) - Asian
Population - Females (%) - Hispanic or Latino
Population - Females (%) - American Indian and Alaska Native
Population - Females (%) - Multirace
Population - Females (%) - Other Race
Coronavirus confirmed cases (Jun 01, 2024)
Deaths caused by coronavirus (Jun 01, 2024)
Coronavirus confirmed cases (per 100k population) (Jun 01, 2024)
Deaths caused by coronavirus (per 100k population) (Jun 01, 2024)
Daily increase in number of cases (Jun 01, 2024)
Weekly increase in number of cases (Jun 01, 2024)
Cases doubled (in days) (Jun 01, 2024)
Hospitalized patients (Apr 18, 2022)
Negative test results (Apr 18, 2022)
Total test results (Apr 18, 2022)
COVID Vaccine doses distributed (per 100k population) (Sep 19, 2023)
COVID Vaccine doses administered (per 100k population) (Sep 19, 2023)
COVID Vaccine doses distributed (Sep 19, 2023)
COVID Vaccine doses administered (Sep 19, 2023)
Likely homosexual households (%)
Likely homosexual households (% change since 2000)
Likely homosexual households - Lesbian couples (%)
Likely homosexual households - Lesbian couples (% change since 2000)
Likely homosexual households - Gay men (%)
Likely homosexual households - Gay men (% change since 2000)
Cost of living index
Median gross rent ($)
Median contract rent ($)
Median monthly housing costs ($)
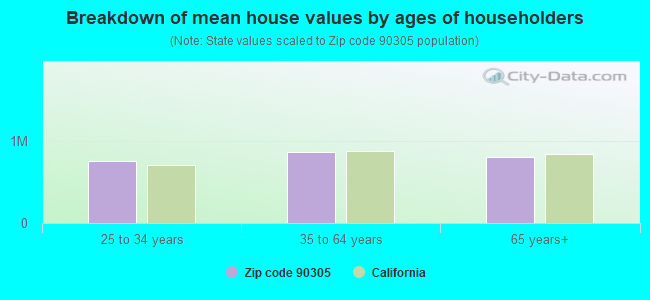
Median house or condo value ($)
Median house or condo value ($ change since 2000)
Mean house or condo value by units in structure - 1, detached ($)
Mean house or condo value by units in structure - 1, attached ($)
Mean house or condo value by units in structure - 2 ($)
Mean house or condo value by units in structure by units in structure - 3 or 4 ($)
Mean house or condo value by units in structure - 5 or more ($)
Mean house or condo value by units in structure - Boat, RV, van, etc. ($)
Mean house or condo value by units in structure - Mobile home ($)
Median house or condo value ($) - White
Median house or condo value ($) - Black or African American
Median house or condo value ($) - Asian
Median house or condo value ($) - Hispanic or Latino
Median house or condo value ($) - American Indian and Alaska Native
Median house or condo value ($) - Multirace
Median house or condo value ($) - Other Race
Median resident age
Resident age diversity
Median resident age - Males
Median resident age - Females
Median resident age - White
Median resident age - Black or African American
Median resident age - Asian
Median resident age - Hispanic or Latino
Median resident age - American Indian and Alaska Native
Median resident age - Multirace
Median resident age - Other Race
Median resident age - Males - White
Median resident age - Males - Black or African American
Median resident age - Males - Asian
Median resident age - Males - Hispanic or Latino
Median resident age - Males - American Indian and Alaska Native
Median resident age - Males - Multirace
Median resident age - Males - Other Race
Median resident age - Females - White
Median resident age - Females - Black or African American
Median resident age - Females - Asian
Median resident age - Females - Hispanic or Latino
Median resident age - Females - American Indian and Alaska Native
Median resident age - Females - Multirace
Median resident age - Females - Other Race
Commute - mean travel time to work (minutes)
Travel time to work - Less than 5 minutes (%)
Travel time to work - Less than 5 minutes (% change since 2000)
Travel time to work - 5 to 9 minutes (%)
Travel time to work - 5 to 9 minutes (% change since 2000)
Travel time to work - 10 to 19 minutes (%)
Travel time to work - 10 to 19 minutes (% change since 2000)
Travel time to work - 20 to 29 minutes (%)
Travel time to work - 20 to 29 minutes (% change since 2000)
Travel time to work - 30 to 39 minutes (%)
Travel time to work - 30 to 39 minutes (% change since 2000)
Travel time to work - 40 to 59 minutes (%)
Travel time to work - 40 to 59 minutes (% change since 2000)
Travel time to work - 60 to 89 minutes (%)
Travel time to work - 60 to 89 minutes (% change since 2000)
Travel time to work - 90 or more minutes (%)
Travel time to work - 90 or more minutes (% change since 2000)
Marital status - Never married (%)
Marital status - Now married (%)
Marital status - Separated (%)
Marital status - Widowed (%)
Marital status - Divorced (%)
Median family income ($)
Median family income (% change since 2000)
Median non-family income ($)
Median non-family income (% change since 2000)
Median per capita income ($)
Median per capita income (% change since 2000)
Median family income ($) - White
Median family income ($) - Black or African American
Median family income ($) - Asian
Median family income ($) - Hispanic or Latino
Median family income ($) - American Indian and Alaska Native
Median family income ($) - Multirace
Median family income ($) - Other Race
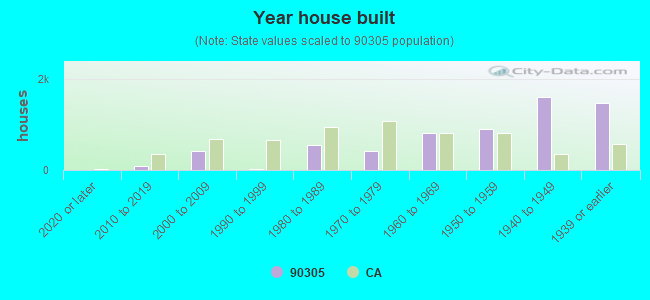
Median year house/condo built
Median year apartment built
Year house built - Built 2005 or later (%)
Year house built - Built 2000 to 2004 (%)
Year house built - Built 1990 to 1999 (%)
Year house built - Built 1980 to 1989 (%)
Year house built - Built 1970 to 1979 (%)
Year house built - Built 1960 to 1969 (%)
Year house built - Built 1950 to 1959 (%)
Year house built - Built 1940 to 1949 (%)
Year house built - Built 1939 or earlier (%)
Average household size
Household density (households per square mile)
Average household size - White
Average household size - Black or African American
Average household size - Asian
Average household size - Hispanic or Latino
Average household size - American Indian and Alaska Native
Average household size - Multirace
Average household size - Other Race
Occupied housing units (%)
Vacant housing units (%)
Owner occupied housing units (%)
Renter occupied housing units (%)
Vacancy status - For rent (%)
Vacancy status - For sale only (%)
Vacancy status - Rented or sold, not occupied (%)
Vacancy status - For seasonal, recreational, or occasional use (%)
Vacancy status - For migrant workers (%)
Vacancy status - Other vacant (%)
Residents with income below the poverty level (%)
Residents with income below 50% of the poverty level (%)
Children below poverty level (%)
Poor families by family type - Married-couple family (%)
Poor families by family type - Male, no wife present (%)
Poor families by family type - Female, no husband present (%)
Poverty status for native-born residents (%)
Poverty status for foreign-born residents (%)
Poverty among high school graduates not in families (%)
Poverty among people who did not graduate high school not in families (%)
Residents with income below the poverty level (%) - White
Residents with income below the poverty level (%) - Black or African American
Residents with income below the poverty level (%) - Asian
Residents with income below the poverty level (%) - Hispanic or Latino
Residents with income below the poverty level (%) - American Indian and Alaska Native
Residents with income below the poverty level (%) - Multirace
Residents with income below the poverty level (%) - Other Race
Air pollution - Air Quality Index (AQI)
Air pollution - CO
Air pollution - NO2
Air pollution - SO2
Air pollution - Ozone
Air pollution - PM10
Air pollution - PM25
Air pollution - Pb
Crime - Murders per 100,000 population
Crime - Rapes per 100,000 population
Crime - Robberies per 100,000 population
Crime - Assaults per 100,000 population
Crime - Burglaries per 100,000 population
Crime - Thefts per 100,000 population
Crime - Auto thefts per 100,000 population
Crime - Arson per 100,000 population
Crime - City-data.com crime index
Crime - Violent crime index
Crime - Property crime index
Crime - Murders per 100,000 population (5 year average)
Crime - Rapes per 100,000 population (5 year average)
Crime - Robberies per 100,000 population (5 year average)
Crime - Assaults per 100,000 population (5 year average)
Crime - Burglaries per 100,000 population (5 year average)
Crime - Thefts per 100,000 population (5 year average)
Crime - Auto thefts per 100,000 population (5 year average)
Crime - Arson per 100,000 population (5 year average)
Crime - City-data.com crime index (5 year average)
Crime - Violent crime index (5 year average)
Crime - Property crime index (5 year average)
1996 Presidential Elections Results (%) - Democratic Party (Clinton)
1996 Presidential Elections Results (%) - Republican Party (Dole)
1996 Presidential Elections Results (%) - Other
2000 Presidential Elections Results (%) - Democratic Party (Gore)
2000 Presidential Elections Results (%) - Republican Party (Bush)
2000 Presidential Elections Results (%) - Other
2004 Presidential Elections Results (%) - Democratic Party (Kerry)
2004 Presidential Elections Results (%) - Republican Party (Bush)
2004 Presidential Elections Results (%) - Other
2008 Presidential Elections Results (%) - Democratic Party (Obama)
2008 Presidential Elections Results (%) - Republican Party (McCain)
2008 Presidential Elections Results (%) - Other
2012 Presidential Elections Results (%) - Democratic Party (Obama)
2012 Presidential Elections Results (%) - Republican Party (Romney)
2012 Presidential Elections Results (%) - Other
2016 Presidential Elections Results (%) - Democratic Party (Clinton)
2016 Presidential Elections Results (%) - Republican Party (Trump)
2016 Presidential Elections Results (%) - Other
2020 Presidential Elections Results (%) - Democratic Party (Biden)
2020 Presidential Elections Results (%) - Republican Party (Trump)
2020 Presidential Elections Results (%) - Other
Ancestries Reported - Arab (%)
Ancestries Reported - Czech (%)
Ancestries Reported - Danish (%)
Ancestries Reported - Dutch (%)
Ancestries Reported - English (%)
Ancestries Reported - French (%)
Ancestries Reported - French Canadian (%)
Ancestries Reported - German (%)
Ancestries Reported - Greek (%)
Ancestries Reported - Hungarian (%)
Ancestries Reported - Irish (%)
Ancestries Reported - Italian (%)
Ancestries Reported - Lithuanian (%)
Ancestries Reported - Norwegian (%)
Ancestries Reported - Polish (%)
Ancestries Reported - Portuguese (%)
Ancestries Reported - Russian (%)
Ancestries Reported - Scotch-Irish (%)
Ancestries Reported - Scottish (%)
Ancestries Reported - Slovak (%)
Ancestries Reported - Subsaharan African (%)
Ancestries Reported - Swedish (%)
Ancestries Reported - Swiss (%)
Ancestries Reported - Ukrainian (%)
Ancestries Reported - United States (%)
Ancestries Reported - Welsh (%)
Ancestries Reported - West Indian (%)
Ancestries Reported - Other (%)
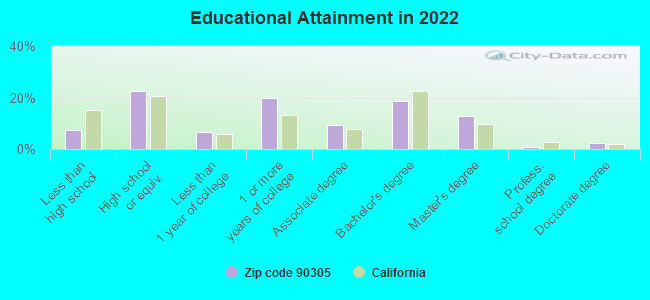
Educational Attainment - No schooling completed (%)
Educational Attainment - Less than high school (%)
Educational Attainment - High school or equivalent (%)
Educational Attainment - Less than 1 year of college (%)
Educational Attainment - 1 or more years of college (%)
Educational Attainment - Associate degree (%)
Educational Attainment - Bachelor's degree (%)
Educational Attainment - Master's degree (%)
Educational Attainment - Professional school degree (%)
Educational Attainment - Doctorate degree (%)
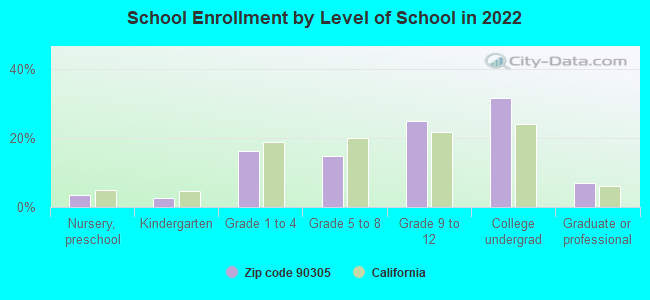
School Enrollment - Nursery, preschool (%)
School Enrollment - Kindergarten (%)
School Enrollment - Grade 1 to 4 (%)
School Enrollment - Grade 5 to 8 (%)
School Enrollment - Grade 9 to 12 (%)
School Enrollment - College undergrad (%)
School Enrollment - Graduate or professional (%)
School Enrollment - Not enrolled in school (%)
School enrollment - Public schools (%)
School enrollment - Private schools (%)
School enrollment - Not enrolled (%)
Median number of rooms in houses and condos
Median number of rooms in apartments
Housing units lacking complete plumbing facilities (%)
Housing units lacking complete kitchen facilities (%)
Density of houses
Urban houses (%)
Rural houses (%)
Households with people 60 years and over (%)
Households with people 65 years and over (%)
Households with people 75 years and over (%)
Households with one or more nonrelatives (%)
Households with no nonrelatives (%)
Population in households (%)
Family households (%)
Nonfamily households (%)
Population in families (%)
Family households with own children (%)
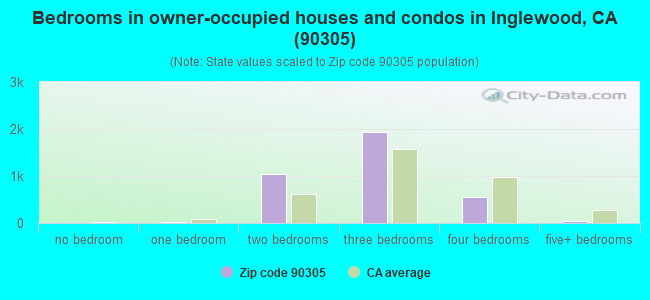
Median number of bedrooms in owner occupied houses
Mean number of bedrooms in owner occupied houses
Median number of bedrooms in renter occupied houses
Mean number of bedrooms in renter occupied houses
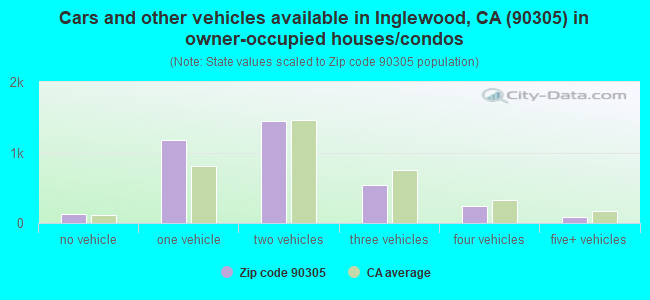
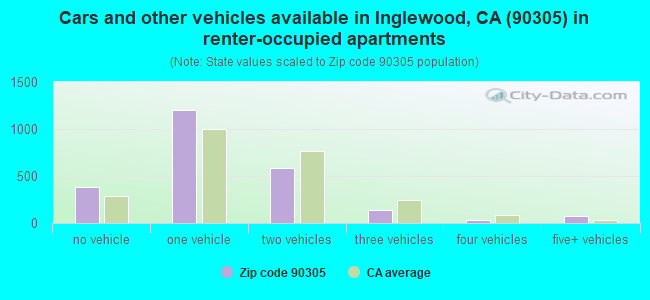
Median number of vehichles in owner occupied houses
Mean number of vehichles in owner occupied houses
Median number of vehichles in renter occupied houses
Mean number of vehichles in renter occupied houses
Mortgage status - with mortgage (%)
Mortgage status - with second mortgage (%)
Mortgage status - with home equity loan (%)
Mortgage status - with both second mortgage and home equity loan (%)
Mortgage status - without a mortgage (%)
Average family size
Average family size - White
Average family size - Black or African American
Average family size - Asian
Average family size - Hispanic or Latino
Average family size - American Indian and Alaska Native
Average family size - Multirace
Average family size - Other Race
Geographical mobility - Same house 1 year ago (%)
Geographical mobility - Moved within same county (%)
Geographical mobility - Moved from different county within same state (%)
Geographical mobility - Moved from different state (%)
Geographical mobility - Moved from abroad (%)
Place of birth - Born in state of residence (%)
Place of birth - Born in other state (%)
Place of birth - Native, outside of US (%)
Place of birth - Foreign born (%)
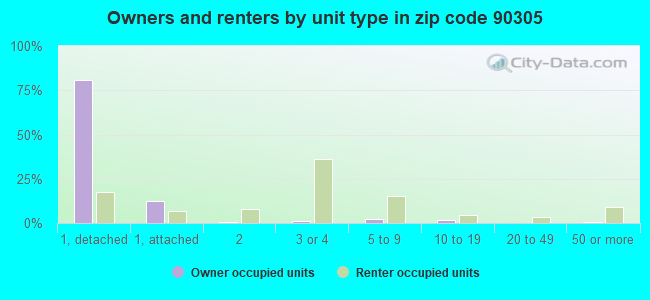
Housing units in structures - 1, detached (%)
Housing units in structures - 1, attached (%)
Housing units in structures - 2 (%)
Housing units in structures - 3 or 4 (%)
Housing units in structures - 5 to 9 (%)
Housing units in structures - 10 to 19 (%)
Housing units in structures - 20 to 49 (%)
Housing units in structures - 50 or more (%)
Housing units in structures - Mobile home (%)
Housing units in structures - Boat, RV, van, etc. (%)
House/condo owner moved in on average (years ago)
Renter moved in on average (years ago)
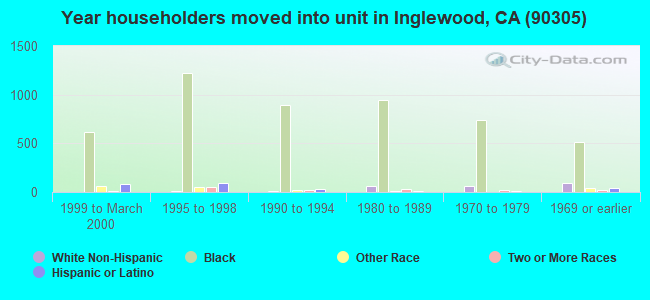
Year householder moved into unit - Moved in 1999 to March 2000 (%)
Year householder moved into unit - Moved in 1995 to 1998 (%)
Year householder moved into unit - Moved in 1990 to 1994 (%)
Year householder moved into unit - Moved in 1980 to 1989 (%)
Year householder moved into unit - Moved in 1970 to 1979 (%)
Year householder moved into unit - Moved in 1969 or earlier (%)
Means of transportation to work - Drove car alone (%)
Means of transportation to work - Carpooled (%)
Means of transportation to work - Public transportation (%)
Means of transportation to work - Bus or trolley bus (%)
Means of transportation to work - Streetcar or trolley car (%)
Means of transportation to work - Subway or elevated (%)
Means of transportation to work - Railroad (%)
Means of transportation to work - Ferryboat (%)
Means of transportation to work - Taxicab (%)
Means of transportation to work - Motorcycle (%)
Means of transportation to work - Bicycle (%)
Means of transportation to work - Walked (%)
Means of transportation to work - Other means (%)
Working at home (%)
Industry diversity
Most Common Industries - Agriculture, forestry, fishing and hunting, and mining (%)
Most Common Industries - Agriculture, forestry, fishing and hunting (%)
Most Common Industries - Mining, quarrying, and oil and gas extraction (%)
Most Common Industries - Construction (%)
Most Common Industries - Manufacturing (%)
Most Common Industries - Wholesale trade (%)
Most Common Industries - Retail trade (%)
Most Common Industries - Transportation and warehousing, and utilities (%)
Most Common Industries - Transportation and warehousing (%)
Most Common Industries - Utilities (%)
Most Common Industries - Information (%)
Most Common Industries - Finance and insurance, and real estate and rental and leasing (%)
Most Common Industries - Finance and insurance (%)
Most Common Industries - Real estate and rental and leasing (%)
Most Common Industries - Professional, scientific, and management, and administrative and waste management services (%)
Most Common Industries - Professional, scientific, and technical services (%)
Most Common Industries - Management of companies and enterprises (%)
Most Common Industries - Administrative and support and waste management services (%)
Most Common Industries - Educational services, and health care and social assistance (%)
Most Common Industries - Educational services (%)
Most Common Industries - Health care and social assistance (%)
Most Common Industries - Arts, entertainment, and recreation, and accommodation and food services (%)
Most Common Industries - Arts, entertainment, and recreation (%)
Most Common Industries - Accommodation and food services (%)
Most Common Industries - Other services, except public administration (%)
Most Common Industries - Public administration (%)
Occupation diversity
Most Common Occupations - Management, business, science, and arts occupations (%)
Most Common Occupations - Management, business, and financial occupations (%)
Most Common Occupations - Management occupations (%)
Most Common Occupations - Business and financial operations occupations (%)
Most Common Occupations - Computer, engineering, and science occupations (%)
Most Common Occupations - Computer and mathematical occupations (%)
Most Common Occupations - Architecture and engineering occupations (%)
Most Common Occupations - Life, physical, and social science occupations (%)
Most Common Occupations - Education, legal, community service, arts, and media occupations (%)
Most Common Occupations - Community and social service occupations (%)
Most Common Occupations - Legal occupations (%)
Most Common Occupations - Education, training, and library occupations (%)
Most Common Occupations - Arts, design, entertainment, sports, and media occupations (%)
Most Common Occupations - Healthcare practitioners and technical occupations (%)
Most Common Occupations - Health diagnosing and treating practitioners and other technical occupations (%)
Most Common Occupations - Health technologists and technicians (%)
Most Common Occupations - Service occupations (%)
Most Common Occupations - Healthcare support occupations (%)
Most Common Occupations - Protective service occupations (%)
Most Common Occupations - Fire fighting and prevention, and other protective service workers including supervisors (%)
Most Common Occupations - Law enforcement workers including supervisors (%)
Most Common Occupations - Food preparation and serving related occupations (%)
Most Common Occupations - Building and grounds cleaning and maintenance occupations (%)
Most Common Occupations - Personal care and service occupations (%)
Most Common Occupations - Sales and office occupations (%)
Most Common Occupations - Sales and related occupations (%)
Most Common Occupations - Office and administrative support occupations (%)
Most Common Occupations - Natural resources, construction, and maintenance occupations (%)
Most Common Occupations - Farming, fishing, and forestry occupations (%)
Most Common Occupations - Construction and extraction occupations (%)
Most Common Occupations - Installation, maintenance, and repair occupations (%)
Most Common Occupations - Production, transportation, and material moving occupations (%)
Most Common Occupations - Production occupations (%)
Most Common Occupations - Transportation occupations (%)
Most Common Occupations - Material moving occupations (%)
People in Group quarters - Institutionalized population (%)
People in Group quarters - Correctional institutions (%)
People in Group quarters - Federal prisons and detention centers (%)
People in Group quarters - Halfway houses (%)
People in Group quarters - Local jails and other confinement facilities (including police lockups) (%)
People in Group quarters - Military disciplinary barracks (%)
People in Group quarters - State prisons (%)
People in Group quarters - Other types of correctional institutions (%)
People in Group quarters - Nursing homes (%)
People in Group quarters - Hospitals/wards, hospices, and schools for the handicapped (%)
People in Group quarters - Hospitals/wards and hospices for chronically ill (%)
People in Group quarters - Hospices or homes for chronically ill (%)
People in Group quarters - Military hospitals or wards for chronically ill (%)
People in Group quarters - Other hospitals or wards for chronically ill (%)
People in Group quarters - Hospitals or wards for drug/alcohol abuse (%)
People in Group quarters - Mental (Psychiatric) hospitals or wards (%)
People in Group quarters - Schools, hospitals, or wards for the mentally retarded (%)
People in Group quarters - Schools, hospitals, or wards for the physically handicapped (%)
People in Group quarters - Institutions for the deaf (%)
People in Group quarters - Institutions for the blind (%)
People in Group quarters - Orthopedic wards and institutions for the physically handicapped (%)
People in Group quarters - Wards in general hospitals for patients who have no usual home elsewhere (%)
People in Group quarters - Wards in military hospitals for patients who have no usual home elsewhere (%)
People in Group quarters - Juvenile institutions (%)
People in Group quarters - Long-term care (%)
People in Group quarters - Homes for abused, dependent, and neglected children (%)
People in Group quarters - Residential treatment centers for emotionally disturbed children (%)
People in Group quarters - Training schools for juvenile delinquents (%)
People in Group quarters - Short-term care, detention or diagnostic centers for delinquent children (%)
People in Group quarters - Type of juvenile institution unknown (%)
People in Group quarters - Noninstitutionalized population (%)
People in Group quarters - College dormitories (includes college quarters off campus) (%)
People in Group quarters - Military quarters (%)
People in Group quarters - On base (%)
People in Group quarters - Barracks, unaccompanied personnel housing (UPH), (Enlisted/Officer), ;and similar group living quarters for military personnel (%)
People in Group quarters - Transient quarters for temporary residents (%)
People in Group quarters - Military ships (%)
People in Group quarters - Group homes (%)
People in Group quarters - Homes or halfway houses for drug/alcohol abuse (%)
People in Group quarters - Homes for the mentally ill (%)
People in Group quarters - Homes for the mentally retarded (%)
People in Group quarters - Homes for the physically handicapped (%)
People in Group quarters - Other group homes (%)
People in Group quarters - Religious group quarters (%)
People in Group quarters - Dormitories (%)
People in Group quarters - Agriculture workers' dormitories on farms (%)
People in Group quarters - Job Corps and vocational training facilities (%)
People in Group quarters - Other workers' dormitories (%)
People in Group quarters - Crews of maritime vessels (%)
People in Group quarters - Other nonhousehold living situations (%)
People in Group quarters - Other noninstitutional group quarters (%)
Residents speaking English at home (%)
Residents speaking English at home - Born in the United States (%)
Residents speaking English at home - Native, born elsewhere (%)
Residents speaking English at home - Foreign born (%)
Residents speaking Spanish at home (%)
Residents speaking Spanish at home - Born in the United States (%)
Residents speaking Spanish at home - Native, born elsewhere (%)
Residents speaking Spanish at home - Foreign born (%)
Residents speaking other language at home (%)
Residents speaking other language at home - Born in the United States (%)
Residents speaking other language at home - Native, born elsewhere (%)
Residents speaking other language at home - Foreign born (%)
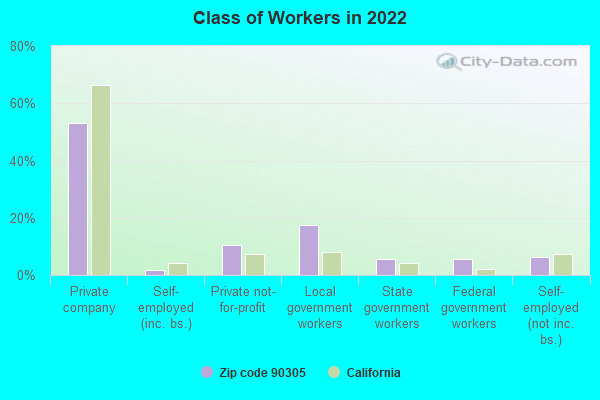
Class of Workers - Employee of private company (%)
Class of Workers - Self-employed in own incorporated business (%)
Class of Workers - Private not-for-profit wage and salary workers (%)
Class of Workers - Local government workers (%)
Class of Workers - State government workers (%)
Class of Workers - Federal government workers (%)
Class of Workers - Self-employed workers in own not incorporated business and Unpaid family workers (%)
House heating fuel used in houses and condos - Utility gas (%)
House heating fuel used in houses and condos - Bottled, tank, or LP gas (%)
House heating fuel used in houses and condos - Electricity (%)
House heating fuel used in houses and condos - Fuel oil, kerosene, etc. (%)
House heating fuel used in houses and condos - Coal or coke (%)
House heating fuel used in houses and condos - Wood (%)
House heating fuel used in houses and condos - Solar energy (%)
House heating fuel used in houses and condos - Other fuel (%)
House heating fuel used in houses and condos - No fuel used (%)
House heating fuel used in apartments - Utility gas (%)
House heating fuel used in apartments - Bottled, tank, or LP gas (%)
House heating fuel used in apartments - Electricity (%)
House heating fuel used in apartments - Fuel oil, kerosene, etc. (%)
House heating fuel used in apartments - Coal or coke (%)
House heating fuel used in apartments - Wood (%)
House heating fuel used in apartments - Solar energy (%)
House heating fuel used in apartments - Other fuel (%)
House heating fuel used in apartments - No fuel used (%)
Armed forces status - In Armed Forces (%)
Armed forces status - Civilian (%)
Armed forces status - Civilian - Veteran (%)
Armed forces status - Civilian - Nonveteran (%)
Fatal accidents locations in years 2005-2021
Fatal accidents locations in 2005
Fatal accidents locations in 2006
Fatal accidents locations in 2007
Fatal accidents locations in 2008
Fatal accidents locations in 2009
Fatal accidents locations in 2010
Fatal accidents locations in 2011
Fatal accidents locations in 2012
Fatal accidents locations in 2013
Fatal accidents locations in 2014
Fatal accidents locations in 2015
Fatal accidents locations in 2016
Fatal accidents locations in 2017
Fatal accidents locations in 2018
Fatal accidents locations in 2019
Fatal accidents locations in 2020
Fatal accidents locations in 2021
Alcohol use - People drinking some alcohol every month (%)
Alcohol use - People not drinking at all (%)
Alcohol use - Average days/month drinking alcohol
Alcohol use - Average drinks/week
Alcohol use - Average days/year people drink much
Audiometry - Average condition of hearing (%)
Audiometry - People that can hear a whisper from across a quiet room (%)
Audiometry - People that can hear normal voice from across a quiet room (%)
Audiometry - Ears ringing, roaring, buzzing (%)
Audiometry - Had a job exposure to loud noise (%)
Audiometry - Had off-work exposure to loud noise (%)
Blood Pressure & Cholesterol - Has high blood pressure (%)
Blood Pressure & Cholesterol - Checking blood pressure at home (%)
Blood Pressure & Cholesterol - Frequently checking blood cholesterol (%)
Blood Pressure & Cholesterol - Has high cholesterol level (%)
Consumer Behavior - Money monthly spent on food at supermarket/grocery store
Consumer Behavior - Money monthly spent on food at other stores
Consumer Behavior - Money monthly spent on eating out
Consumer Behavior - Money monthly spent on carryout/delivered foods
Consumer Behavior - Income spent on food at supermarket/grocery store (%)
Consumer Behavior - Income spent on food at other stores (%)
Consumer Behavior - Income spent on eating out (%)
Consumer Behavior - Income spent on carryout/delivered foods (%)
Current Health Status - General health condition (%)
Current Health Status - Blood donors (%)
Current Health Status - Has blood ever tested for HIV virus (%)
Current Health Status - Left-handed people (%)
Dermatology - People using sunscreen (%)
Diabetes - Diabetics (%)
Diabetes - Had a blood test for high blood sugar (%)
Diabetes - People taking insulin (%)
Diet Behavior & Nutrition - Diet health (%)
Diet Behavior & Nutrition - Milk product consumption (# of products/month)
Diet Behavior & Nutrition - Meals not home prepared (#/week)
Diet Behavior & Nutrition - Meals from fast food or pizza place (#/week)
Diet Behavior & Nutrition - Ready-to-eat foods (#/month)
Diet Behavior & Nutrition - Frozen meals/pizza (#/month)
Drug Use - People that ever used marijuana or hashish (%)
Drug Use - Ever used hard drugs (%)
Drug Use - Ever used any form of cocaine (%)
Drug Use - Ever used heroin (%)
Drug Use - Ever used methamphetamine (%)
Health Insurance - People covered by health insurance (%)
Kidney Conditions-Urology - Avg. # of times urinating at night
Medical Conditions - People with asthma (%)
Medical Conditions - People with anemia (%)
Medical Conditions - People with psoriasis (%)
Medical Conditions - People with overweight (%)
Medical Conditions - Elderly people having difficulties in thinking or remembering (%)
Medical Conditions - People who ever received blood transfusion (%)
Medical Conditions - People having trouble seeing even with glass/contacts (%)
Medical Conditions - People with arthritis (%)
Medical Conditions - People with gout (%)
Medical Conditions - People with congestive heart failure (%)
Medical Conditions - People with coronary heart disease (%)
Medical Conditions - People with angina pectoris (%)
Medical Conditions - People who ever had heart attack (%)
Medical Conditions - People who ever had stroke (%)
Medical Conditions - People with emphysema (%)
Medical Conditions - People with thyroid problem (%)
Medical Conditions - People with chronic bronchitis (%)
Medical Conditions - People with any liver condition (%)
Medical Conditions - People who ever had cancer or malignancy (%)
Mental Health - People who have little interest in doing things (%)
Mental Health - People feeling down, depressed, or hopeless (%)
Mental Health - People who have trouble sleeping or sleeping too much (%)
Mental Health - People feeling tired or having little energy (%)
Mental Health - People with poor appetite or overeating (%)
Mental Health - People feeling bad about themself (%)
Mental Health - People who have trouble concentrating on things (%)
Mental Health - People moving or speaking slowly or too fast (%)
Mental Health - People having thoughts they would be better off dead (%)
Oral Health - Average years since last visit a dentist
Oral Health - People embarrassed because of mouth (%)
Oral Health - People with gum disease (%)
Oral Health - General health of teeth and gums (%)
Oral Health - Average days a week using dental floss/device
Oral Health - Average days a week using mouthwash for dental problem
Oral Health - Average number of teeth
Pesticide Use - Households using pesticides to control insects (%)
Pesticide Use - Households using pesticides to kill weeds (%)
Physical Activity - People doing vigorous-intensity work activities (%)
Physical Activity - People doing moderate-intensity work activities (%)
Physical Activity - People walking or bicycling (%)
Physical Activity - People doing vigorous-intensity recreational activities (%)
Physical Activity - People doing moderate-intensity recreational activities (%)
Physical Activity - Average hours a day doing sedentary activities
Physical Activity - Average hours a day watching TV or videos
Physical Activity - Average hours a day using computer
Physical Functioning - People having limitations keeping them from working (%)
Physical Functioning - People limited in amount of work they can do (%)
Physical Functioning - People that need special equipment to walk (%)
Physical Functioning - People experiencing confusion/memory problems (%)
Physical Functioning - People requiring special healthcare equipment (%)
Prescription Medications - Average number of prescription medicines taking
Preventive Aspirin Use - Adults 40+ taking low-dose aspirin (%)
Reproductive Health - Vaginal deliveries (%)
Reproductive Health - Cesarean deliveries (%)
Reproductive Health - Deliveries resulted in a live birth (%)
Reproductive Health - Pregnancies resulted in a delivery (%)
Reproductive Health - Women breastfeeding newborns (%)
Reproductive Health - Women that had a hysterectomy (%)
Reproductive Health - Women that had both ovaries removed (%)
Reproductive Health - Women that have ever taken birth control pills (%)
Reproductive Health - Women taking birth control pills (%)
Reproductive Health - Women that have ever used Depo-Provera or injectables (%)
Reproductive Health - Women that have ever used female hormones (%)
Sexual Behavior - People 18+ that ever had sex (vaginal, anal, or oral) (%)
Sexual Behavior - Males 18+ that ever had vaginal sex with a woman (%)
Sexual Behavior - Males 18+ that ever performed oral sex on a woman (%)
Sexual Behavior - Males 18+ that ever had anal sex with a woman (%)
Sexual Behavior - Males 18+ that ever had any sex with a man (%)
Sexual Behavior - Females 18+ that ever had vaginal sex with a man (%)
Sexual Behavior - Females 18+ that ever performed oral sex on a man (%)
Sexual Behavior - Females 18+ that ever had anal sex with a man (%)
Sexual Behavior - Females 18+ that ever had any kind of sex with a woman (%)
Sexual Behavior - Average age people first had sex
Sexual Behavior - Average number of female sex partners in lifetime (males 18+)
Sexual Behavior - Average number of female vaginal sex partners in lifetime (males 18+)
Sexual Behavior - Average age people first performed oral sex on a woman (18+)
Sexual Behavior - Average number of woman performed oral sex on in lifetime (18+)
Sexual Behavior - Average number of male sex partners in lifetime (males 18+)
Sexual Behavior - Average number of male anal sex partners in lifetime (males 18+)
Sexual Behavior - Average age people first performed oral sex on a man (18+)
Sexual Behavior - Average number of male oral sex partners in lifetime (18+)
Sexual Behavior - People using protection when performing oral sex (%)
Sexual Behavior - Average number of times people have vaginal or anal sex a year
Sexual Behavior - People having sex without condom (%)
Sexual Behavior - Average number of male sex partners in lifetime (females 18+)
Sexual Behavior - Average number of male vaginal sex partners in lifetime (females 18+)
Sexual Behavior - Average number of female sex partners in lifetime (females 18+)
Sexual Behavior - Circumcised males 18+ (%)
Sleep Disorders - Average hours sleeping at night
Sleep Disorders - People that has trouble sleeping (%)
Smoking-Cigarette Use - People smoking cigarettes (%)
Taste & Smell - People 40+ having problems with smell (%)
Taste & Smell - People 40+ having problems with taste (%)
Taste & Smell - People 40+ that ever had wisdom teeth removed (%)
Taste & Smell - People 40+ that ever had tonsils teeth removed (%)
Taste & Smell - People 40+ that ever had a loss of consciousness because of a head injury (%)
Taste & Smell - People 40+ that ever had a broken nose or other serious injury to face or skull (%)
Taste & Smell - People 40+ that ever had two or more sinus infections (%)
Weight - Average height (inches)
Weight - Average weight (pounds)
Weight - Average BMI
Weight - People that are obese (%)
Weight - People that ever were obese (%)
Weight - People trying to lose weight (%)
100%
urban population.
Estimated median house/condo value in 2022: $790,498
90305:
$790,498California:
$715,900
Median resident age: This zip code:
47.9 yearsCalifornia median age:
37.9 years
Average household size: This zip code:
2.4 peopleCalifornia:
2.8 people
Averages for the 2020 tax year for zip code 90305, filed in 2021:
Average Adjusted Gross Income (AGI) in 2020: $61,455 (Individual Income Tax Returns) Here:
$61,455State:
$95,910
Salary/wage: $59,363 (reported on 75.6% of returns )Here:
$59,363State:
$77,331
(% of AGI for various income ranges: 1171.2% for AGIs below $25k , 4078.8% for AGIs $25k-50k , 7217.9% for AGIs $50k-75k , 10767.5% for AGIs $75k-100k , 20726.4% for AGIs $100k-200k , 71232.5% for AGIs over 200k ) Taxable interest for individuals: $479 (reported on 33.7% of returns )This zip code:
$479California:
$2,294
(% of AGI for various income ranges: 10.5% for AGIs below $25k , 15.2% for AGIs $25k-50k , 17.9% for AGIs $50k-75k , 37.5% for AGIs $75k-100k , 82.9% for AGIs $100k-200k , 152.5% for AGIs over 200k ) Ordinary dividends: $1,301 (reported on 10.5% of returns )(% of AGI for various income ranges: 5.8% for AGIs below $25k , 16.5% for AGIs $25k-50k , 23.7% for AGIs $50k-75k , 42.1% for AGIs $75k-100k , 44.3% for AGIs $100k-200k , 163.8% for AGIs over 200k ) Net capital gain/loss in AGI: +$3,940 (reported on 10.4% of returns )Here:
+$3,940State:
+$49,306
(% of AGI for various income ranges: 2.3% for AGIs below $25k , 5.8% for AGIs $25k-50k , 10.4% for AGIs $50k-75k , 22.9% for AGIs $75k-100k , 189.5% for AGIs $100k-200k , 2371.2% for AGIs over 200k ) Profit/loss from business: +$1,321 (reported on 23.1% of returns )Here:
+$1,321State:
+$15,671
(% of AGI for various income ranges: 51.0% for AGIs below $25k , 48.5% for AGIs $50k-75k , 125.7% for AGIs $100k-200k , 1902.5% for AGIs over 200k ) Taxable individual retirement arrangement distribution: $18,634 (reported on 6.2% of returns )90305:
$18,634California:
$23,505
(% of AGI for various income ranges: 45.1% for AGIs below $25k , 71.2% for AGIs $25k-50k , 200.0% for AGIs $50k-75k , 264.0% for AGIs $75k-100k , 669.7% for AGIs $100k-200k , 996.2% for AGIs over 200k ) Total itemized deductions: $30,644 (reported on 27.1% of returns )Here:
$30,644State:
$39,517
(% of AGI for various income ranges: 209.2% for AGIs below $25k , 536.3% for AGIs $25k-50k , 1262.2% for AGIs $50k-75k , 2433.1% for AGIs $75k-100k , 4258.1% for AGIs $100k-200k , 11548.8% for AGIs over 200k ) Charity contributions: $7,391 (reported on 24.5% of returns )(% of AGI for various income ranges: 16.4% for AGIs below $25k , 98.0% for AGIs $25k-50k , 251.9% for AGIs $50k-75k , 544.0% for AGIs $75k-100k , 1032.6% for AGIs $100k-200k , 2801.2% for AGIs over 200k ) Taxes paid: $8,032 (reported on 27.1% of returns )(% of AGI for various income ranges: 45.7% for AGIs below $25k , 114.2% for AGIs $25k-50k , 320.5% for AGIs $50k-75k , 683.5% for AGIs $75k-100k , 1231.4% for AGIs $100k-200k , 2607.5% for AGIs over 200k ) Earned income credit: $1,876 (reported on 14.8% of returns )(% of AGI for various income ranges: 98.1% for AGIs below $25k , 53.2% for AGIs $25k-50k ) Percentage of individuals using paid preparers for their 2020 taxes: 89.0%(% for various income ranges: 87.9% for AGIs below $25k , 90.0% for AGIs $25k-50k , 89.5% for AGIs $50k-75k , 88.8% for AGIs $75k-100k , 89.1% for AGIs $100k-200k , 89.3% for AGIs over 200k )
Averages for the 2012 tax year for zip code 90305, filed in 2013:
Average Adjusted Gross Income (AGI) in 2012: $48,835 (Individual Income Tax Returns) Here:
$48,835State:
$72,726
Salary/wage: $47,193 (reported on 76.4% of returns )Here:
$47,193State:
$59,079
(% of AGI for various income ranges: 64.0% for AGIs below $25k , 75.6% for AGIs $25k-50k , 74.7% for AGIs $50k-75k , 73.5% for AGIs $75k-100k , 76.7% for AGIs $100k-200k , 68.6% for AGIs over 200k ) Taxable interest for individuals: $431 (reported on 31.3% of returns )This zip code:
$431California:
$2,146
(% of AGI for various income ranges: 0.4% for AGIs below $25k , 0.3% for AGIs $25k-50k , 0.2% for AGIs $50k-75k , 0.3% for AGIs $75k-100k , 0.3% for AGIs $100k-200k ) Ordinary dividends: $1,155 (reported on 9.1% of returns )(% of AGI for various income ranges: 0.3% for AGIs below $25k , 0.2% for AGIs $25k-50k , 0.2% for AGIs $50k-75k , 0.2% for AGIs $75k-100k , 0.2% for AGIs $100k-200k , 0.1% for AGIs over 200k ) Profit/loss from business: +$4,541 (reported on 21.1% of returns )Here:
+$4,541State:
+$17,064
(% of AGI for various income ranges: 16.2% for AGIs below $25k , 0.6% for AGIs $25k-50k , 0.6% for AGIs $50k-75k , 0.7% for AGIs $75k-100k , 0.3% for AGIs over 200k ) Taxable individual retirement arrangement distribution: $15,036 (reported on 6.6% of returns )90305:
$15,036California:
$19,557
(% of AGI for various income ranges: 1.6% for AGIs below $25k , 1.8% for AGIs $25k-50k , 1.8% for AGIs $50k-75k , 1.8% for AGIs $75k-100k , 3.2% for AGIs $100k-200k ) Total itemized deductions: $25,002 (34% of AGI, reported on 46.2% of returns )Here:
$25,002State:
$34,004
Here:
33.6% of AGIState:
22.7% of AGI
(% of AGI for various income ranges: 16.3% for AGIs below $25k , 21.0% for AGIs $25k-50k , 25.1% for AGIs $50k-75k , 27.1% for AGIs $75k-100k , 25.4% for AGIs $100k-200k , 19.8% for AGIs over 200k ) Charity contributions: $4,686 (reported on 41.1% of returns )(% of AGI for various income ranges: 1.7% for AGIs below $25k , 3.5% for AGIs $25k-50k , 4.6% for AGIs $50k-75k , 4.7% for AGIs $75k-100k , 4.3% for AGIs $100k-200k , 2.5% for AGIs over 200k ) Taxes paid: $6,729 (reported on 45.9% of returns )90305:
$6,729State:
$14,448
(% of AGI for various income ranges: 2.8% for AGIs below $25k , 4.1% for AGIs $25k-50k , 6.4% for AGIs $50k-75k , 7.7% for AGIs $75k-100k , 8.0% for AGIs $100k-200k , 7.2% for AGIs over 200k ) Earned income credit: $2,433 (reported on 20.3% of returns )(% of AGI for various income ranges: 9.2% for AGIs below $25k , 0.7% for AGIs $25k-50k ) Percentage of individuals using paid preparers for their 2012 taxes: 66.7%(% for various income ranges: 59.9% for AGIs below $25k , 67.3% for AGIs $25k-50k , 70.5% for AGIs $50k-75k , 73.4% for AGIs $75k-100k , 75.0% for AGIs $100k-200k , 75.0% for AGIs over 200k )
Averages for the 2004 tax year for zip code 90305, filed in 2005:
Average Adjusted Gross Income (AGI) in 2004: $42,632 (Individual Income Tax Returns) Here:
$42,632State:
$58,600
Salary/wage: $41,213 (reported on 80.8% of returns )Here:
$41,213State:
$49,455
(% of AGI for various income ranges: 105.5% for AGIs below $10k , 68.7% for AGIs $10k-25k , 81.1% for AGIs $25k-50k , 81.5% for AGIs $50k-75k , 80.1% for AGIs $75k-100k , 71.4% for AGIs over 100k ) Taxable interest for individuals: $768 (reported on 42.4% of returns )This zip code:
$768California:
$2,365
(% of AGI for various income ranges: 3.8% for AGIs below $10k , 1.1% for AGIs $10k-25k , 0.6% for AGIs $25k-50k , 0.6% for AGIs $50k-75k , 0.9% for AGIs $75k-100k , 0.7% for AGIs over 100k ) Taxable dividends: $734 (reported on 12.7% of returns )(% of AGI for various income ranges: 1.1% for AGIs below $10k , 0.3% for AGIs $10k-25k , 0.2% for AGIs $25k-50k , 0.1% for AGIs $50k-75k , 0.2% for AGIs $75k-100k , 0.2% for AGIs over 100k ) Net capital gain/loss: +$10,337 (reported on 9.7% of returns )Here:
+$10,337State:
+$23,418
(% of AGI for various income ranges: 2.2% for AGIs below $10k , 0.0% for AGIs $10k-25k , -0.1% for AGIs $25k-50k , 0.2% for AGIs $50k-75k , 1.0% for AGIs $75k-100k , 9.6% for AGIs over 100k ) Profit/loss from business: +$2,697 (reported on 17.2% of returns )Here:
+$2,697State:
+$16,826
(% of AGI for various income ranges: 4.4% for AGIs below $10k , 5.7% for AGIs $10k-25k , 0.6% for AGIs $25k-50k , 0.2% for AGIs $50k-75k , 0.8% for AGIs $75k-100k , 0.9% for AGIs over 100k ) IRA payment deduction: $1,981 (reported on 1.6% of returns )90305:
$1,981California:
$3,192
(% of AGI for various income ranges: 0.2% for AGIs $10k-25k , 0.1% for AGIs $25k-50k , 0.0% for AGIs $50k-75k , 0.1% for AGIs $75k-100k , 0.1% for AGIs over 100k ) Total itemized deductions: $23,378 (37% of AGI, reported on 50.8% of returns )Here:
$23,378State:
$28,113
Here:
37.4% of AGIState:
25.3% of AGI
(% of AGI for various income ranges: 33.3% for AGIs below $10k , 21.2% for AGIs $10k-25k , 25.9% for AGIs $25k-50k , 31.8% for AGIs $50k-75k , 30.3% for AGIs $75k-100k , 26.1% for AGIs over 100k ) Charity contributions deductions: $4,719 (7% of AGI, reported on 47.2% of returns )Here:
7.4% of AGIState:
3.3% of AGI
(% of AGI for various income ranges: 2.0% for AGIs below $10k , 3.0% for AGIs $10k-25k , 4.9% for AGIs $25k-50k , 5.9% for AGIs $50k-75k , 6.1% for AGIs $75k-100k , 5.3% for AGIs over 100k ) Total tax: $4,739 (reported on 74.4% of returns )90305:
$4,739State:
$10,761
(% of AGI for various income ranges: 4.3% for AGIs below $10k , 3.5% for AGIs $10k-25k , 5.5% for AGIs $25k-50k , 7.9% for AGIs $50k-75k , 9.8% for AGIs $75k-100k , 12.8% for AGIs over 100k ) Earned income credit: $1,688 (reported on 17.5% of returns )Percentage of individuals using paid preparers for their 2004 taxes: 71.8%(% for various income ranges: 62.6% for AGIs below $10k , 74.4% for AGIs $10k-25k , 71.7% for AGIs $25k-50k , 73.4% for AGIs $50k-75k , 74.7% for AGIs $75k-100k , 77.2% for AGIs over 100k )
Estimated median household income in 2022: This zip code:
$85,137California:
$91,551
Nearest zip codes: 90303 ,
90047 ,
90301 ,
90302 ,
90043 ,
90304 .
Inglewood Zip Code Map
Percentage of family households: This zip code:
37.7%California:
46.8%
Percentage of households with unmarried partners: This zip code:
3.5%California:
48.1%
Likely homosexual households (counted as self-reported same-sex unmarried-partner households)
Lesbian couples: 0.2% of all households Gay men: 0.0% of all households
Household received Food Stamps/SNAP in the past 12 months: 992Household did not receive Food Stamps/SNAP in the past 12 months: 5,053
Women who had a birth in the past 12 months: 48 (22 now married , 26 unmarried) Women who did not have a birth in the past 12 months: 3,377 (954 now married , 2,440 unmarried)
Housing units in zip code 90305 with a mortgage: 2,929 (356
second mortgage , 11
home equity loan , 326
both second mortgage and home equity loan )
Houses without a mortgage: 17
Median monthly owner costs for units with a mortgage: $2,741
Median monthly owner costs for units without a mortgage: $732
Residents with income below the poverty level in 2022:
This zip code:
10.1%Whole state:
12.2%
Residents with income below 50% of the poverty level in 2022:
This zip code:
5.1%Whole state:
6.2%
Median number of rooms in houses and condos: Median number of rooms in apartments: Notable locations in this zip code not listed on our city pages
Click to draw/clear zip code borders Notable locations in zip code 90305: (A) , Park Circle (B) , Inglewood Country Club (C) , Morningside Park Branch City of Inglewood Public Library (D) , Great Western Forum (E) , Los Angeles County Fire Department Station 173 (F) . Display/hide their locations on the map
Churches in zip code 90305 include: (A) , First Brethren Church (B) , Kingdom Hall of Jehovahs Witnesses (C) , Morningside United Church of Christ (D) , Second Church of Christ Scientist (E) , Holy Trinity Evangelical Lutheran Church (F) . Display/hide their locations on the map
Cemetery: (1) . Display/hide its location on the map
Reservoir: (A) . Display/hide its location on the map
Parks in zip code 90305 include: (1) , Hollywood Park (2) . Display/hide their locations on the map
Year house built (houses)
0 2020 or later99 2010 to 2019425 2000 to 200921 1990 to 1999556 1980 to 1989425 1970 to 1979814 1960 to 1969900 1950 to 19591,602 1940 to 19491,476 1939 or earlier
Zip code 90305 household income distribution in 2022 214 Less than $10,000193 $10,000 to $14,999204 $15,000 to $19,999392 $20,000 to $24,999103 $25,000 to $29,99991 $30,000 to $34,999226 $35,000 to $39,999281 $40,000 to $44,999189 $45,000 to $49,999402 $50,000 to $59,999403 $60,000 to $74,999733 $75,000 to $99,999660 $100,000 to $124,999601 $125,000 to $149,999667 $150,000 to $199,999614 $200,000 or moreEstimate of home value of owner-occupied houses/condos in 2022 in zip code 90305 31 Less than $10,0006 $50,000 to $59,99912 $60,000 to $69,99914 $80,000 to $89,99947 $300,000 to $399,999113 $400,000 to $499,9991,705 $500,000 to $749,9991,531 $750,000 to $999,999270 $1,000,000 to $1,499,99922 $2,000,000 or moreRent paid by renters in 2022 in zip code 90305 16 $250 to $29947 $300 to $34915 $700 to $74929 $750 to $79942 $800 to $89987 $900 to $999250 $1,000 to $1,249381 $1,250 to $1,499908 $1,500 to $1,999332 $2,000 to $2,499167 $2,500 to $2,99928 $3,000 to $3,49916 $3,500 or more70 No cash rent
Median gross rent in 2022: $1,834.
Median price asked for vacant for-sale houses and condos in 2022: $548,951.
Estimated median house (or condo) value in 2022 for: White Non-Hispanic householders: $795,522Black or African American householders: $798,871American Indian or Alaska Native householders: $809,339Asian householders: $2,616,849Some other race householders: $887,216Two or more races householders: $750,302Hispanic or Latino householders: $813,944Estimated median house or condo value in 2022: $790,498
90305:
$790,498California:
$715,900
Lower value quartile - upper value quartile: $661,074 - $966,014
Mean price in 2022: Detached houses: $804,592Here:
$804,592State:
$988,808
Townhouses or other attached units: $295,930Here:
$295,930State:
$838,546
In 2-unit structures: $618,682Here:
$618,682State:
$1,138,100
In 3-to-4-unit structures: $425,632Here:
$425,632State:
$824,253
In 5-or-more-unit structures: $467,104Here:
$467,104State:
$730,996
Housing units in structures:
One, detached: 3,456One, attached: 729Two: 2973 or 4: 9485 to 9: 47310 to 19: 16120 to 49: 8350 or more: 253Boats, RVs, vans, etc.: 8Unemployment : 6.6%
Means of transportation to work in zip code 90305 69.6% 5,107 Drove a car alone7.1% 519 Carpooled5.1% 376 Bus or trolley bus0.3% 24 Streetcar or trolley car0.0% 3 Railroad0.2% 18 Taxi0.5% 36 Bicycle2.8% 203 Walked1.1% 79 Other means11.1% 812 Worked at homeTravel time to work (commute) in zip code 90305 23 Less than 5 minutes264 5 to 9 minutes518 10 to 14 minutes547 15 to 19 minutes548 20 to 24 minutes255 25 to 29 minutes892 30 to 34 minutes257 35 to 39 minutes822 40 to 44 minutes1,434 45 to 59 minutes753 60 to 89 minutes100 90 or more minutes
Neighborhoods in zip code 90305: Percentage of zip code residents living and working in this county: 98.1%
Household type by relationship:
Households: 14,557
Male householders: 2,569 (969 living alone ), Female householders: 3,438 (1,034 living alone )1,837 spouses (1,803 opposite-sex spouses ), 255 unmarried partners , (238 opposite-sex unmarried partners ), 4,205 children (3,867 natural , 159 adopted , 179 stepchildren ), 521 grandchildren , 335 brothers or sisters , 318 parents , 18 foster children , 452 other relatives , 489 non-relatives In group quarters: 136 (-1 institutionalized population )
Size of family households: 1,584 2-persons , 1,067 3-persons , 535 4-persons , 330 5-persons , 105 6-persons , 61 7-or-more-persons
Size of nonfamily households: 2,000 1-person , 291 2-persons , 29 3-persons , 18 4-persons
1,073 married couples with children. single-parent households (144 men , 667 women ).
79.4% of residents of 90305 zip code speak English at home. of residents speak Spanish at home (56% very well, 27% well, 13% not well, 3% not at all ).of residents speak other Indo-European language at home (87% very well, 9% well, 3% not well ).of residents speak Asian or Pacific Island language at home (91% very well, 1% well, 6% not well, 1% not at all ).of residents speak other language at home (65% very well, 28% well, 7% not at all ).
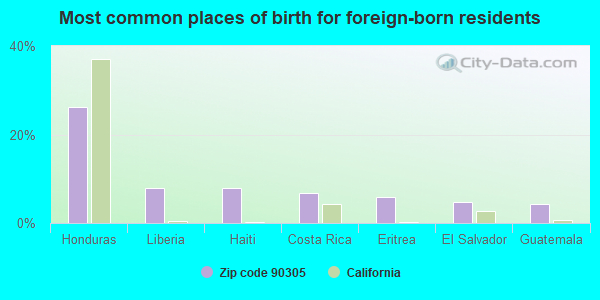
Foreign born population: 2,205 (15.2%)
(64.6%
of them are naturalized citizens )
This zip code:
15.2%Whole state:
26.7%
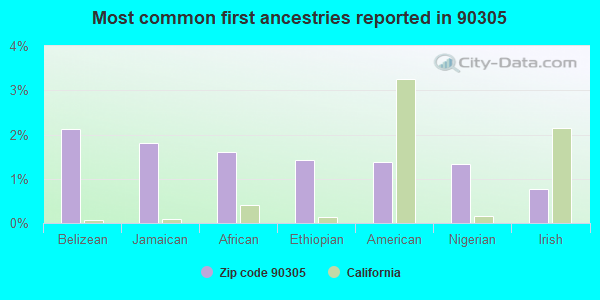
26% Honduras 8% Liberia 8% Haiti 7% Costa Rica 6% Eritrea 5% El Salvador 4% Guatemala 2% Belizean 2% Jamaican 2% African 1% Ethiopian 1% American 1% Nigerian 1% Irish
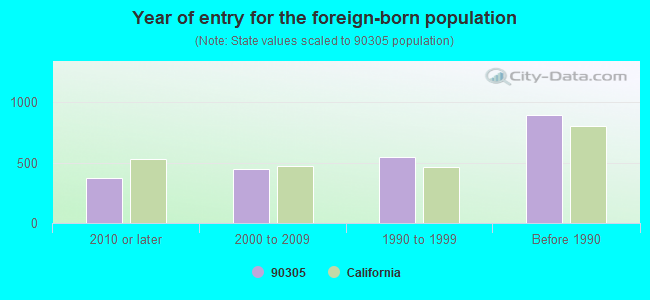
Year of entry for the foreign-born population
374 2010 or later 450 2000 to 2009 550 1990 to 1999 894 Before 1990
There are
58 Medical Specialists in Zip Code 90305 .
Facilities with environmental interests located in this zip code:
CENTRY PARK CLEANERS (3201 W CENTRY BLVD in INGLEWOOD, CA)
STATE MASTER (California - Hazardous Waste Tracking) - HAZARDOU WASTE PROGRAM Small Quantity Generators, between 100 kg and 1000 kg of hazardous waste/month (Resource Conservation and Recovery Act (tracking hazardous waste)) - notification Organizations: WON J BANG (CONTACT/OWNER)
HIGH TECH CLEANERS (635 N LA BREA in INGLEWOOD, CA)
STATE MASTER (California - Hazardous Waste Tracking) - HAZARDOU WASTE PROGRAM Small Quantity Generators, between 100 kg and 1000 kg of hazardous waste/month (Resource Conservation and Recovery Act (tracking hazardous waste)) - notification Organizations: JACK MOADOEL (CONTACT/OWNER)
Alternative names: HI-TECH CLEANERS #3
LOWES SUPREME TIRE INC (2542 W MANCHESTER AVE in INGLEWOOD, CA)
STATE MASTER (California - Hazardous Waste Tracking) - HAZARDOU WASTE PROGRAM Small Quantity Generators, between 100 kg and 1000 kg of hazardous waste/month (Resource Conservation and Recovery Act (tracking hazardous waste)) - notification Business NAICS classification: GENERAL AUTOMOTIVE REPAIR.Organizations: GOODYEAR TIRE (CONTACT/OWNER)
Alternative names: WILLIE LOWE
CHEVRON STATION 9 6594 (2600 W MANCHESTER in INGLEWOOD, CA)
STATE MASTER (California - Hazardous Waste Tracking) - HAZARDOU WASTE PROGRAM Small Quantity Generators, between 100 kg and 1000 kg of hazardous waste/month (Resource Conservation and Recovery Act (tracking hazardous waste)) - notification Organizations: CHEVRON USA PRODUCTS (CONTACT/OWNER)
Alternative names: CHEVRON 96594
FREEMAN (DANIEL) ELEMENTARY (2602 W. 79TH ST. in INGLEWOOD, CA)
(National Center for Education Statistics) - STATE ID-6014468 Organizations: INGLEWOOD UNIFIED (SCHOOL DISTRICT)
LANE (WARREN) ELEMENTARY (9330 S. EIGHTH AVE. in INGLEWOOD, CA)
(National Center for Education Statistics) - STATE ID-6014526 Organizations: INGLEWOOD UNIFIED (SCHOOL DISTRICT)
ACE CLEANERS (8409 W 8TH ST in INGLEWOOD, CA)
Small Quantity Generators, between 100 kg and 1000 kg of hazardous waste/month (Resource Conservation and Recovery Act (tracking hazardous waste)) - notification Small Quantity Generators, between 100 kg and 1000 kg of hazardous waste/month (Resource Conservation and Recovery Act (tracking hazardous waste)) - notification Organizations: CHON HONG NOE (CONTACT/OWNER)
7TH AVE CLEANERS (2724 WEST MANCHESTER BOULEVARD in INGLEWOOD, CA)
CRITERIA AND HAZARDOUS AIR POLLUTANT INVENTORY (Inventory of air pollution sources) Small Quantity Generators, between 100 kg and 1000 kg of hazardous waste/month (Resource Conservation and Recovery Act (tracking hazardous waste)) Business SIC classification: DRYCLEANING PLANTS, EXCEPT RUG CLEANINGOrganizations: NADLER ARTHUR (CONTACT/OWNER)
MORNINGSIDE EARLY CHILDHOOD (8722 CRENSHAW BLVD in INGLEWOOD, CA)
COMPLIANCE ACTIVITY (Tracking inspections of insecticide, fungicide, and rodenticide, and toxic substances)
Housing units lacking complete plumbing facilities: 1.4%
Housing units lacking complete kitchen facilities: 3.3%
65.7% Utility gas 28.2% Electricity 2.2% No fuel used 1.5% Other fuel 1.1% Bottled, tank, or LP gas 0.7% Solar energy 0.6% Fuel oil, kerosene, etc.
Population in 1990: 14,370.
Place of birth for U.S.-born residents:
This state: 9,050Northeast: 488Midwest: 504South: 2,011West: 163
65% of the 90305 zip code residents lived in the same house 5 years ago.
Out of people who lived in different houses, 91% lived in this county.
Out of people who lived in different counties, 50% lived in California.
93% of the 90305 zip code residents lived in the same house 1 year ago.
Out of people who lived in different houses, 72% moved from this county.
Out of people who lived in different houses, 10% moved from different county within same state.
Out of people who lived in different houses, 11% moved from different state.
Out of people who lived in different houses, 8% moved from abroad.
Private vs. public school enrollment:
Students in private schools in grades 1 to 8 (elementary and middle school): 94
Here:
9.9%California:
10.5%
Students in private schools in grades 9 to 12 (high school): 200
Here:
26.3%California:
8.5%
Students in private undergraduate colleges: 122
Here:
12.6%California:
15.9%
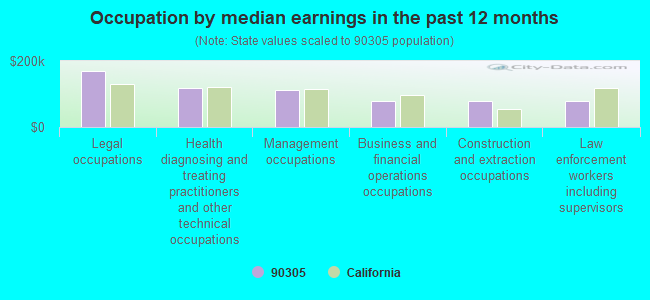
Occupation by median earnings in the past 12 months ($)
169,706 Legal occupations 119,481 Health diagnosing and treating practitioners and other technical occupations 112,223 Management occupations 78,911 Business and financial operations occupations 77,996 Construction and extraction occupations 77,369 Law enforcement workers including supervisors
Companies with federal contracts located in this zip code:
MAXIMUM PRIVATE SECURITY CORPO (3216 WEST 85TH STREET in INGLEWOOD, CA; small business) in 34 contracts from 1999 to 2004
Contracts for Guard Services by Public Buildings Service, Army, U.S. Army Corps of Engineers - civil program financing only, Bureau of Reclamation, and others Signed by year: 2000: $1,994,397; 2001: $2,613,455; 2002: $343,598; 2003: $3,417,838; 2004: -$42,902; 2005: $0; 2006: $0.
Biggest contracts: with Public Buildings Service for Guard Services. Taking place in MD. Signed on 2003-02-15. Completion date: 2004-03-15.
with Public Buildings Service for Guard Services. Taking place in DC. Signed on 2001-09-15. Completion date: 2002-10-15.
, same as above. Signed on 2000-09-15. Completion date: 2001-10-15.
, same as above. Signed on 1999-12-15. Completion date: 2001-03-15.
Top industries in this zip code by the number of employees in 2005:
Accommodation and Food Services: Limited-Service Restaurants (20-49 employees: 3 establishments, 5-9 employees: 1 establishment, 1-4 employees: 1 establishment)Health Care and Social Assistance: Services for the Elderly and Persons with Disabilities (20-49: 3)Other Services (except Public Administration): Religious Organizations (20-49: 1, 10-19: 2, 5-9: 1, 1-4: 1)Educational Services: Elementary and Secondary Schools (50-99: 1)Arts, Entertainment, and Recreation: Sports Teams and Clubs (50-99: 1)Other Services (except Public Administration): Funeral Homes and Funeral Services (20-49: 2, 1-4: 1)Health Care and Social Assistance: Other Individual and Family Services (20-49: 1, 10-19: 1)Health Care and Social Assistance: Medical Laboratories (20-49: 1, 10-19: 1)Health Care and Social Assistance: Home Health Care Services (20-49: 1, 1-4: 1)
People in group quarters in 2010:
218 people in workers' group living quarters and job corps centers
44 people in group homes intended for adults
12 people in other noninstitutional facilities
6 people in nursing facilities/skilled-nursing facilities
People in group quarters in 2000:
34 people in homes or halfway houses for drug/alcohol abuse
8 people in other nonhousehold living situations
6 people in other group homes
4 people in other noninstitutional group quarters
Fatal accident statistics in 2013:
Fatal accident count: 1Vehicles involved in fatal accidents: 1Fatal accidents caused by drunken drivers: 1Fatalities: 1Persons involved in fatal accidents: 2Pedestrians involved in fatal accidents: 0
Fatal accident statistics in 2012:
Fatal accident count: 2Vehicles involved in fatal accidents: 2Fatal accidents caused by drunken drivers: 1Fatalities: 2Persons involved in fatal accidents: 2Pedestrians involved in fatal accidents: 1
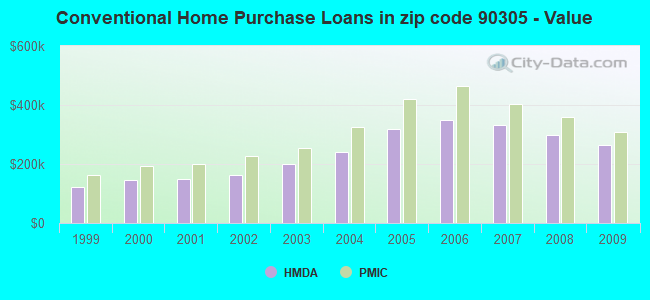
Home Mortgage Disclosure Act Aggregated Statistics For Year 2009(Based on 9 full tracts) A) FHA, FSA/RHS & VA B) Conventional C) Refinancings D) Home Improvement Loans E) Loans on Dwellings For 5+ Families F) Non-occupant Loans on Number Average Value Number Average Value Number Average Value Number Average Value Number Average Value Number Average Value
LOANS ORIGINATED 137 $321,934 68 $263,659 351 $249,771 25 $129,153 0 $0 26 $238,234 APPLICATIONS APPROVED, NOT ACCEPTED 19 $314,780 18 $287,319 59 $272,803 2 $8,930 0 $0 0 $0 APPLICATIONS DENIED 21 $300,357 14 $388,041 270 $307,413 18 $161,097 2 $1,289,860 18 $187,009 APPLICATIONS WITHDRAWN 19 $292,632 21 $265,398 127 $280,998 14 $152,194 0 $0 8 $224,821 FILES CLOSED FOR INCOMPLETENESS 5 $340,942 6 $256,818 61 $314,021 2 $384,120 0 $0 4 $335,445
Aggregated Statistics For Year 2008(Based on 9 full tracts) A) FHA, FSA/RHS & VA B) Conventional C) Refinancings D) Home Improvement Loans E) Loans on Dwellings For 5+ Families F) Non-occupant Loans on G) Loans On Manufactured Number Average Value Number Average Value Number Average Value Number Average Value Number Average Value Number Average Value Number Average Value
LOANS ORIGINATED 40 $384,744 118 $298,349 369 $290,918 53 $191,510 5 $421,830 44 $354,094 0 $0 APPLICATIONS APPROVED, NOT ACCEPTED 10 $423,874 23 $384,395 88 $326,544 19 $105,708 0 $0 6 $290,630 3 $46,000 APPLICATIONS DENIED 29 $420,120 60 $363,389 443 $335,192 103 $127,773 4 $1,009,030 22 $342,407 4 $43,008 APPLICATIONS WITHDRAWN 19 $364,056 24 $291,700 147 $319,262 12 $199,600 0 $0 12 $267,055 0 $0 FILES CLOSED FOR INCOMPLETENESS 2 $476,255 12 $317,933 52 $402,620 10 $149,769 0 $0 6 $316,728 0 $0
Aggregated Statistics For Year 2007(Based on 9 full tracts) A) FHA, FSA/RHS & VA B) Conventional C) Refinancings D) Home Improvement Loans E) Loans on Dwellings For 5+ Families F) Non-occupant Loans on G) Loans On Manufactured Number Average Value Number Average Value Number Average Value Number Average Value Number Average Value Number Average Value Number Average Value
LOANS ORIGINATED 2 $317,505 268 $332,774 1,044 $340,218 147 $205,364 10 $672,621 90 $310,724 1 $94,000 APPLICATIONS APPROVED, NOT ACCEPTED 0 $0 130 $308,026 279 $345,708 31 $208,745 0 $0 31 $356,222 0 $0 APPLICATIONS DENIED 0 $0 267 $405,904 807 $375,108 152 $187,388 4 $560,000 74 $388,511 0 $0 APPLICATIONS WITHDRAWN 0 $0 95 $366,457 341 $389,692 52 $255,220 0 $0 33 $417,208 0 $0 FILES CLOSED FOR INCOMPLETENESS 0 $0 24 $386,223 136 $384,666 9 $173,000 0 $0 5 $359,046 0 $0
Aggregated Statistics For Year 2006(Based on 9 full tracts) B) Conventional C) Refinancings D) Home Improvement Loans E) Loans on Dwellings For 5+ Families F) Non-occupant Loans on G) Loans On Manufactured Number Average Value Number Average Value Number Average Value Number Average Value Number Average Value Number Average Value
LOANS ORIGINATED 1,143 $347,682 1,462 $327,874 233 $195,870 14 $1,978,739 155 $345,994 0 $0 APPLICATIONS APPROVED, NOT ACCEPTED 309 $312,430 294 $322,249 44 $200,030 0 $0 56 $291,011 2 $70,000 APPLICATIONS DENIED 431 $370,678 850 $337,932 184 $154,628 0 $0 92 $304,318 0 $0 APPLICATIONS WITHDRAWN 259 $343,703 631 $329,385 70 $220,658 2 $347,270 36 $256,694 0 $0 FILES CLOSED FOR INCOMPLETENESS 57 $313,912 130 $318,573 17 $271,135 0 $0 9 $243,469 0 $0
Aggregated Statistics For Year 2005(Based on 9 full tracts) B) Conventional C) Refinancings D) Home Improvement Loans E) Loans on Dwellings For 5+ Families F) Non-occupant Loans on G) Loans On Manufactured Number Average Value Number Average Value Number Average Value Number Average Value Number Average Value Number Average Value
LOANS ORIGINATED 682 $318,689 1,685 $287,295 233 $179,190 16 $597,853 204 $309,478 4 $81,500 APPLICATIONS APPROVED, NOT ACCEPTED 211 $300,403 276 $262,650 31 $192,106 0 $0 33 $326,670 3 $120,000 APPLICATIONS DENIED 300 $312,256 744 $296,599 137 $164,960 2 $240,075 63 $294,881 5 $19,876 APPLICATIONS WITHDRAWN 298 $303,451 503 $294,873 105 $245,261 4 $486,392 60 $313,910 4 $422,500 FILES CLOSED FOR INCOMPLETENESS 24 $251,148 165 $299,237 8 $150,000 0 $0 16 $291,281 0 $0
Aggregated Statistics For Year 2004(Based on 9 full tracts) A) FHA, FSA/RHS & VA B) Conventional C) Refinancings D) Home Improvement Loans E) Loans on Dwellings For 5+ Families F) Non-occupant Loans on G) Loans On Manufactured Number Average Value Number Average Value Number Average Value Number Average Value Number Average Value Number Average Value Number Average Value
LOANS ORIGINATED 0 $0 482 $239,322 1,724 $239,326 200 $157,012 16 $387,346 128 $233,573 0 $0 APPLICATIONS APPROVED, NOT ACCEPTED 0 $0 139 $262,334 348 $234,385 42 $158,693 2 $196,860 35 $230,122 0 $0 APPLICATIONS DENIED 1 $290,000 164 $246,331 758 $233,219 128 $108,263 4 $380,505 57 $251,125 2 $22,085 APPLICATIONS WITHDRAWN 0 $0 59 $251,679 644 $242,271 82 $139,975 0 $0 35 $210,478 0 $0 FILES CLOSED FOR INCOMPLETENESS 0 $0 7 $156,619 146 $235,448 14 $154,071 0 $0 7 $212,234 0 $0
Aggregated Statistics For Year 2003(Based on 9 full tracts) A) FHA, FSA/RHS & VA B) Conventional C) Refinancings D) Home Improvement Loans E) Loans on Dwellings For 5+ Families F) Non-occupant Loans on Number Average Value Number Average Value Number Average Value Number Average Value Number Average Value Number Average Value
LOANS ORIGINATED 14 $249,380 428 $198,915 2,175 $185,821 56 $56,141 10 $393,098 164 $187,125 APPLICATIONS APPROVED, NOT ACCEPTED 1 $192,000 78 $217,750 462 $196,100 15 $33,439 4 $310,658 35 $212,964 APPLICATIONS DENIED 7 $297,607 165 $186,280 956 $189,021 61 $55,784 8 $2,425,148 78 $205,352 APPLICATIONS WITHDRAWN 2 $389,000 70 $201,485 733 $195,776 29 $41,798 6 $579,025 25 $181,508 FILES CLOSED FOR INCOMPLETENESS 0 $0 17 $193,789 119 $176,064 15 $65,115 0 $0 9 $150,211
Aggregated Statistics For Year 2002(Based on 6 full tracts) A) FHA, FSA/RHS & VA B) Conventional C) Refinancings D) Home Improvement Loans E) Loans on Dwellings For 5+ Families F) Non-occupant Loans on Number Average Value Number Average Value Number Average Value Number Average Value Number Average Value Number Average Value
LOANS ORIGINATED 28 $216,113 230 $161,402 863 $169,952 32 $32,820 6 $276,712 59 $169,630 APPLICATIONS APPROVED, NOT ACCEPTED 6 $162,500 65 $180,498 154 $162,656 12 $37,809 0 $0 15 $173,791 APPLICATIONS DENIED 6 $258,072 78 $172,018 429 $172,442 56 $35,976 2 $644,930 76 $145,046 APPLICATIONS WITHDRAWN 4 $227,500 93 $170,718 371 $169,121 10 $67,809 0 $0 28 $149,114 FILES CLOSED FOR INCOMPLETENESS 0 $0 18 $145,518 87 $169,476 0 $0 0 $0 14 $129,978
Aggregated Statistics For Year 2001(Based on 6 full tracts) A) FHA, FSA/RHS & VA B) Conventional C) Refinancings D) Home Improvement Loans E) Loans on Dwellings For 5+ Families F) Non-occupant Loans on Number Average Value Number Average Value Number Average Value Number Average Value Number Average Value Number Average Value
LOANS ORIGINATED 50 $211,317 182 $149,823 661 $158,732 55 $26,359 2 $4,321,350 51 $163,000 APPLICATIONS APPROVED, NOT ACCEPTED 0 $0 36 $153,552 128 $156,476 10 $25,374 2 $208,360 12 $146,211 APPLICATIONS DENIED 12 $202,134 107 $140,545 434 $147,717 53 $28,799 4 $2,483,140 26 $148,774 APPLICATIONS WITHDRAWN 6 $213,805 65 $153,578 273 $154,450 34 $43,652 2 $4,321,350 6 $127,142 FILES CLOSED FOR INCOMPLETENESS 0 $0 22 $118,670 57 $159,688 2 $196,000 0 $0 6 $124,825
Aggregated Statistics For Year 2000(Based on 6 full tracts) A) FHA, FSA/RHS & VA B) Conventional C) Refinancings D) Home Improvement Loans E) Loans on Dwellings For 5+ Families F) Non-occupant Loans on Number Average Value Number Average Value Number Average Value Number Average Value Number Average Value Number Average Value
LOANS ORIGINATED 55 $179,305 175 $147,089 278 $126,172 46 $32,795 4 $325,442 16 $137,284 APPLICATIONS APPROVED, NOT ACCEPTED 6 $173,988 20 $187,879 85 $111,989 32 $26,299 0 $0 8 $70,492 APPLICATIONS DENIED 8 $177,750 81 $136,717 371 $129,405 51 $31,147 0 $0 19 $158,576 APPLICATIONS WITHDRAWN 4 $186,500 51 $142,702 154 $135,901 6 $16,575 0 $0 6 $159,003 FILES CLOSED FOR INCOMPLETENESS 8 $171,090 22 $164,420 128 $157,763 2 $2,975 4 $2,031,250 14 $184,686
Aggregated Statistics For Year 1999(Based on 2 full and 5 partial tracts) A) FHA, FSA/RHS & VA B) Conventional C) Refinancings D) Home Improvement Loans E) Loans on Dwellings For 5+ Families F) Non-occupant Loans on Number Average Value Number Average Value Number Average Value Number Average Value Number Average Value Number Average Value
LOANS ORIGINATED 75 $163,524 171 $121,637 316 $129,728 73 $17,848 7 $250,354 34 $131,019 APPLICATIONS APPROVED, NOT ACCEPTED 5 $154,316 24 $137,784 102 $119,788 21 $20,166 0 $0 9 $102,858 APPLICATIONS DENIED 19 $171,708 80 $135,118 309 $126,016 66 $23,725 4 $2,637,098 22 $174,869 APPLICATIONS WITHDRAWN 13 $153,723 44 $123,755 153 $128,450 6 $28,073 1 $136,050 13 $164,830 FILES CLOSED FOR INCOMPLETENESS 3 $162,230 13 $143,093 107 $140,608 1 $28,010 0 $0 3 $92,597
Private Mortgage Insurance Companies Aggregated Statistics For Year 2009(Based on 7 full tracts) A) Conventional B) Refinancings Number Average Value Number Average Value
LOANS ORIGINATED 9 $306,836 3 $357,163 APPLICATIONS APPROVED, NOT ACCEPTED 14 $302,030 0 $0 APPLICATIONS DENIED 2 $332,000 2 $408,785 APPLICATIONS WITHDRAWN 0 $0 2 $324,000 FILES CLOSED FOR INCOMPLETENESS 4 $378,900 0 $0
Aggregated Statistics For Year 2008(Based on 9 full tracts) A) Conventional B) Refinancings C) Non-occupant Loans on Number Average Value Number Average Value Number Average Value
LOANS ORIGINATED 55 $360,067 8 $363,870 0 $0 APPLICATIONS APPROVED, NOT ACCEPTED 35 $412,570 15 $490,563 1 $399,000 APPLICATIONS DENIED 8 $380,325 2 $417,000 2 $374,000 APPLICATIONS WITHDRAWN 4 $391,250 0 $0 0 $0 FILES CLOSED FOR INCOMPLETENESS 2 $446,490 4 $507,500 4 $507,500
Aggregated Statistics For Year 2007(Based on 9 full tracts) A) Conventional B) Refinancings C) Non-occupant Loans on Number Average Value Number Average Value Number Average Value
LOANS ORIGINATED 19 $404,504 37 $512,424 6 $397,807 APPLICATIONS APPROVED, NOT ACCEPTED 0 $0 17 $453,128 2 $366,500 APPLICATIONS DENIED 4 $500,722 10 $522,812 3 $513,000 APPLICATIONS WITHDRAWN 6 $426,168 8 $472,854 0 $0 FILES CLOSED FOR INCOMPLETENESS 0 $0 0 $0 0 $0
Aggregated Statistics For Year 2006(Based on 9 full tracts) A) Conventional B) Refinancings Number Average Value Number Average Value
LOANS ORIGINATED 18 $465,289 15 $451,985 APPLICATIONS APPROVED, NOT ACCEPTED 0 $0 3 $403,333 APPLICATIONS DENIED 2 $473,000 2 $539,690 APPLICATIONS WITHDRAWN 0 $0 0 $0 FILES CLOSED FOR INCOMPLETENESS 0 $0 0 $0
Aggregated Statistics For Year 2005(Based on 9 full tracts) A) Conventional B) Refinancings C) Non-occupant Loans on Number Average Value Number Average Value Number Average Value
LOANS ORIGINATED 16 $421,718 17 $361,368 1 $272,000 APPLICATIONS APPROVED, NOT ACCEPTED 0 $0 4 $362,202 0 $0 APPLICATIONS DENIED 2 $414,000 0 $0 2 $414,000 APPLICATIONS WITHDRAWN 4 $465,500 0 $0 2 $414,000 FILES CLOSED FOR INCOMPLETENESS 0 $0 0 $0 0 $0
Aggregated Statistics For Year 2004(Based on 9 full tracts) A) Conventional B) Refinancings C) Non-occupant Loans on Number Average Value Number Average Value Number Average Value
LOANS ORIGINATED 29 $324,004 27 $282,167 2 $209,345 APPLICATIONS APPROVED, NOT ACCEPTED 10 $259,418 15 $273,113 0 $0 APPLICATIONS DENIED 0 $0 2 $396,000 2 $396,000 APPLICATIONS WITHDRAWN 2 $250,000 4 $315,420 0 $0 FILES CLOSED FOR INCOMPLETENESS 0 $0 0 $0 0 $0
Aggregated Statistics For Year 2003(Based on 9 full tracts) A) Conventional B) Refinancings C) Non-occupant Loans on Number Average Value Number Average Value Number Average Value
LOANS ORIGINATED 49 $254,935 69 $242,751 6 $219,675 APPLICATIONS APPROVED, NOT ACCEPTED 8 $242,500 35 $223,955 0 $0 APPLICATIONS DENIED 0 $0 0 $0 0 $0 APPLICATIONS WITHDRAWN 2 $299,000 2 $285,210 0 $0 FILES CLOSED FOR INCOMPLETENESS 0 $0 2 $243,090 0 $0
Aggregated Statistics For Year 2002(Based on 6 full tracts) A) Conventional B) Refinancings C) Non-occupant Loans on Number Average Value Number Average Value Number Average Value
LOANS ORIGINATED 52 $225,737 73 $220,104 2 $183,555 APPLICATIONS APPROVED, NOT ACCEPTED 20 $188,684 30 $203,659 6 $177,888 APPLICATIONS DENIED 2 $189,000 2 $238,130 0 $0 APPLICATIONS WITHDRAWN 0 $0 8 $209,335 0 $0 FILES CLOSED FOR INCOMPLETENESS 0 $0 2 $219,000 0 $0
Aggregated Statistics For Year 2001(Based on 6 full tracts) A) Conventional B) Refinancings C) Non-occupant Loans on Number Average Value Number Average Value Number Average Value
LOANS ORIGINATED 52 $200,598 67 $201,777 4 $185,542 APPLICATIONS APPROVED, NOT ACCEPTED 10 $205,347 24 $197,540 2 $187,525 APPLICATIONS DENIED 4 $208,000 8 $195,154 0 $0 APPLICATIONS WITHDRAWN 0 $0 2 $220,870 0 $0 FILES CLOSED FOR INCOMPLETENESS 0 $0 0 $0 0 $0
Aggregated Statistics For Year 2000(Based on 6 full tracts) A) Conventional B) Refinancings C) Non-occupant Loans on Number Average Value Number Average Value Number Average Value
LOANS ORIGINATED 59 $194,273 55 $173,804 4 $169,548 APPLICATIONS APPROVED, NOT ACCEPTED 12 $171,614 10 $174,211 0 $0 APPLICATIONS DENIED 4 $154,648 0 $0 0 $0 APPLICATIONS WITHDRAWN 2 $117,080 2 $144,045 2 $144,045 FILES CLOSED FOR INCOMPLETENESS 0 $0 0 $0 0 $0
Aggregated Statistics For Year 1999(Based on 2 full and 5 partial tracts) A) Conventional B) Refinancings C) Non-occupant Loans on Number Average Value Number Average Value Number Average Value
LOANS ORIGINATED 54 $163,900 46 $157,920 6 $133,297 APPLICATIONS APPROVED, NOT ACCEPTED 8 $165,880 19 $152,638 0 $0 APPLICATIONS DENIED 4 $150,555 6 $133,837 0 $0 APPLICATIONS WITHDRAWN 1 $211,950 2 $152,430 0 $0 FILES CLOSED FOR INCOMPLETENESS 2 $163,865 4 $139,302 0 $0
Most common first names in zip code 90305 among deceased individuals Name Count Lived (average)
Mary 112 78.5 years John 102 76.0 years James 95 73.2 years William 80 74.0 years Robert 66 69.6 years George 62 73.4 years Joseph 54 74.5 years Charles 46 74.1 years Marie 36 78.7 years Willie 35 72.9 years
Most common last names in zip code 90305 among deceased individuals Last name Count Lived (average)
Johnson 56 72.9 years Williams 56 76.5 years Jones 51 79.2 years Smith 40 72.8 years Jackson 36 72.0 years Brown 32 75.2 years Davis 28 77.2 years Thomas 26 71.4 years Robinson 26 73.8 years Wilson 25 70.1 years
Businesses in zip code 90305
Name Count Name Count
7-Eleven 1 GNC 1 Curves 1 KFC 1

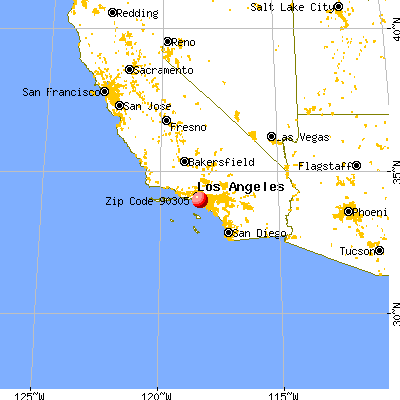

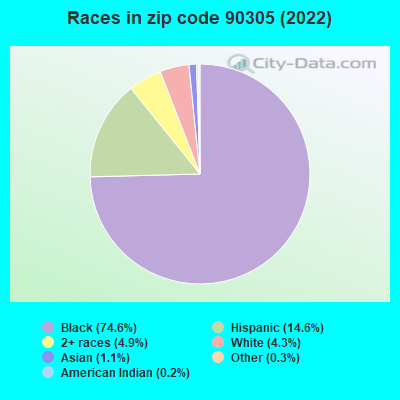


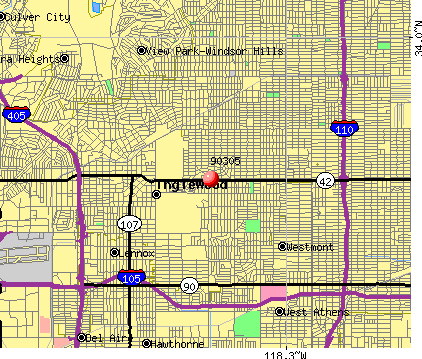 Nearest zip codes: 90303, 90047, 90301, 90302, 90043, 90304.