Estimated zip code population in 2022: 10,380 Zip code population in 2010: 11,451 Zip code population in 2000: 11,401
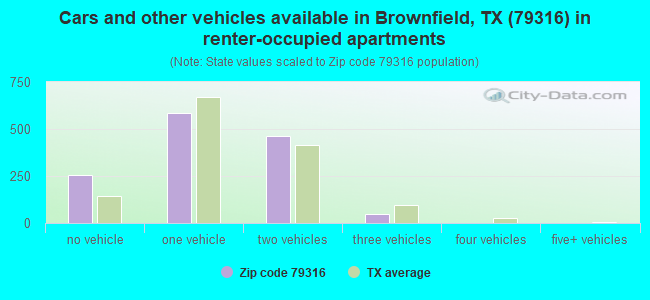
Houses and condos: 4,412 Renter-occupied apartments: 1,354
% of renters here:
34%
State:
38%
March 2022 cost of living index in zip code 79316: 77.5 (low, U.S. average is 100)
Land area: 467.3 sq. mi. Water area: 0.8 sq. mi.
Population density: 22 people per square mile
(very low).
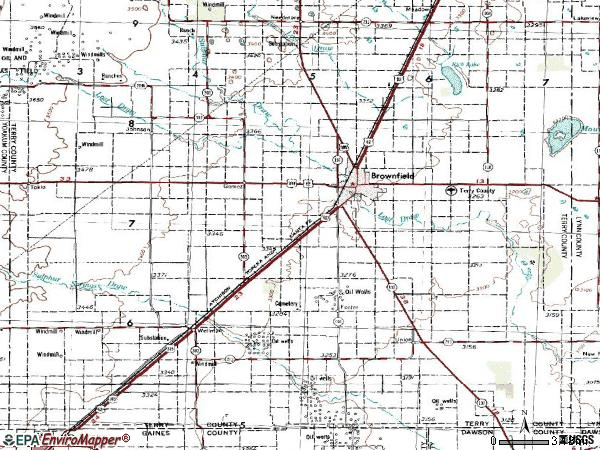
OSM Map
General Map
Google Map
MSN Map
OSM Map
General Map
Google Map
MSN Map
OSM Map
General Map
Google Map
MSN Map
OSM Map
General Map
Google Map
MSN Map
Please wait while loading the map...
Real estate property taxes paid for housing units in 2022:
This zip code:
1.2% ($1,388)
Texas:
1.5% ($4,050)
Median real estate property taxes paid for housing units with mortgages in 2022: $1,995 (1.4%) Median real estate property taxes paid for housing units with no mortgage in 2022: $1,066 (1.1%)
Business Search- 14 Million verified businesses
Males: 5,798
(55.9%)
Females: 4,583
(44.1%)
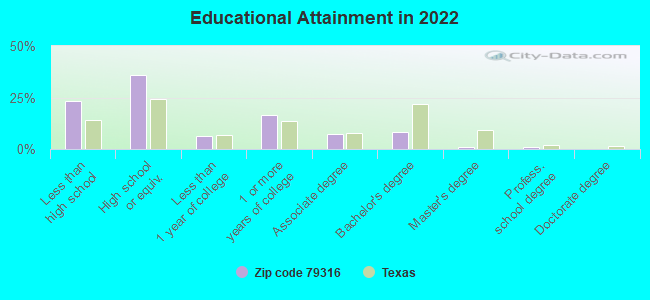
For population 25 years and over in 79316:
High school or higher: 75.3%
Bachelor's degree or higher: 10.4%
Graduate or professional degree: 2.2%
Unemployed: 4.5%
Mean travel time to work (commute): 16.1 minutes
For population 15 years and over in 79316:
Never married: 35.6%
Now married: 45.3%
Separated: 3.9%
Widowed: 6.6%
Divorced: 8.6%
Zip code 79316 compared to state average:
Median household income below state average.
Median house value significantly below state average.
Black race population percentage below state average.
Foreign-born population percentage below state average.
Length of stay since moving in significantly above state average.
House age above state average.
Number of college students significantly below state average.
Percentage of population with a bachelor's degree or higher significantly below state average.
Averages for the 2020 tax year for zip code 79316, filed in 2021:
Average Adjusted Gross Income (AGI) in 2020: $47,057 (Individual Income Tax Returns)
Here:
$47,057
State:
$77,054
Salary/wage: $38,174 (reported on 83.8% of returns)
Here:
$38,174
State:
$62,766
(% of AGI for various income ranges: 1319.0% for AGIs below $25k, 3776.9% for AGIs $25k-50k, 6490.0% for AGIs $50k-75k, 9237.5% for AGIs $75k-100k, 17259.4% for AGIs $100k-200k, 35163.3% for AGIs over 200k)
Taxable interest for individuals: $1,501 (reported on 17.7% of returns)
This zip code:
$1,501
Texas:
$2,665
(% of AGI for various income ranges: 3.6% for AGIs below $25k, 10.5% for AGIs $25k-50k, 26.1% for AGIs $50k-75k, 91.5% for AGIs $75k-100k, 176.9% for AGIs $100k-200k, 1303.3% for AGIs over 200k)
Ordinary dividends: $4,794 (reported on 8.0% of returns)
Here:
$4,794
State:
$10,044
(% of AGI for various income ranges: 6.8% for AGIs below $25k, 7.2% for AGIs $25k-50k, 32.6% for AGIs $50k-75k, 29.0% for AGIs $75k-100k, 255.0% for AGIs $100k-200k, 2793.3% for AGIs over 200k)
Net capital gain/loss in AGI: +$12,166 (reported on 8.5% of returns)
Here:
+$12,166
State:
+$39,590
(% of AGI for various income ranges: 5.6% for AGIs below $25k, 7.7% for AGIs $25k-50k, 69.7% for AGIs $50k-75k, 187.5% for AGIs $75k-100k, 489.4% for AGIs $100k-200k, 8973.3% for AGIs over 200k)
Profit/loss from business: +$6,777 (reported on 20.1% of returns)
Here:
+$6,777
State:
+$10,888
(% of AGI for various income ranges: 88.7% for AGIs below $25k, 141.4% for AGIs $25k-50k, 118.2% for AGIs $50k-75k, 53.0% for AGIs $75k-100k, 412.5% for AGIs $100k-200k, 6620.0% for AGIs over 200k)
Taxable individual retirement arrangement distribution: $15,445 (reported on 5.3% of returns)
79316:
$15,445
Texas:
$24,740
(% of AGI for various income ranges: 20.9% for AGIs below $25k, 74.4% for AGIs $25k-50k, 135.0% for AGIs $50k-75k, 189.5% for AGIs $75k-100k, 983.1% for AGIs $100k-200k)
Total itemized deductions: $35,742 (reported on 2.9% of returns)
Here:
$35,742
State:
$40,428
(% of AGI for various income ranges: 81.4% for AGIs $25k-50k, 277.9% for AGIs $50k-75k, 616.2% for AGIs $100k-200k, 5103.3% for AGIs over 200k)
Charity contributions: $20,650 (reported on 2.4% of returns)
Here:
$20,650
State:
$18,201
(% of AGI for various income ranges: 140.3% for AGIs $50k-75k, 315.0% for AGIs $100k-200k, 3426.7% for AGIs over 200k)
Taxes paid: $4,973 (reported on 2.7% of returns)
79316:
$4,973
State:
$7,821
(% of AGI for various income ranges: 4.6% for AGIs below $25k, 35.5% for AGIs $50k-75k, 106.2% for AGIs $100k-200k, 603.3% for AGIs over 200k)
Earned income credit: $2,678 (reported on 29.5% of returns)
Here:
$2,678
State:
$2,584
(% of AGI for various income ranges: 167.6% for AGIs below $25k, 116.4% for AGIs $25k-50k, 3.7% for AGIs $50k-75k)
Percentage of individuals using paid preparers for their 2020 taxes: 91.3%
Here:
91%
State:
92%
(% for various income ranges: 92.2% for AGIs below $25k, 91.1% for AGIs $25k-50k, 90.6% for AGIs $50k-75k, 89.7% for AGIs $75k-100k, 90.0% for AGIs $100k-200k, 90.0% for AGIs over 200k)
Averages for the 2012 tax year for zip code 79316, filed in 2013:
Average Adjusted Gross Income (AGI) in 2012: $45,914 (Individual Income Tax Returns)
Here:
$45,914
State:
$65,384
Salary/wage: $35,679 (reported on 85.5% of returns)
Here:
$35,679
State:
$52,524
(% of AGI for various income ranges: 83.8% for AGIs below $25k, 84.3% for AGIs $25k-50k, 76.1% for AGIs $50k-75k, 76.6% for AGIs $75k-100k, 62.2% for AGIs $100k-200k, 22.4% for AGIs over 200k)
Taxable interest for individuals: $1,373 (reported on 22.8% of returns)
This zip code:
$1,373
Texas:
$2,372
(% of AGI for various income ranges: 0.7% for AGIs below $25k, 0.4% for AGIs $25k-50k, 0.5% for AGIs $50k-75k, 0.5% for AGIs $75k-100k, 0.9% for AGIs $100k-200k, 1.1% for AGIs over 200k)
Ordinary dividends: $4,941 (reported on 9.7% of returns)
Here:
$4,941
State:
$9,721
(% of AGI for various income ranges: 0.5% for AGIs below $25k, 0.4% for AGIs $25k-50k, 0.7% for AGIs $50k-75k, 0.9% for AGIs $75k-100k, 1.6% for AGIs $100k-200k, 2.0% for AGIs over 200k)
Net capital gain/loss in AGI: +$14,168 (reported on 8.8% of returns)
Here:
+$14,168
State:
+$35,319
(% of AGI for various income ranges: 0.2% for AGIs $25k-50k, 0.2% for AGIs $50k-75k, 1.9% for AGIs $75k-100k, 1.7% for AGIs $100k-200k, 11.4% for AGIs over 200k)
Profit/loss from business: +$12,507 (reported on 16.4% of returns)
Here:
+$12,507
State:
+$13,732
(% of AGI for various income ranges: 4.8% for AGIs below $25k, 4.9% for AGIs $25k-50k, 3.3% for AGIs $50k-75k, 2.2% for AGIs $75k-100k, 3.6% for AGIs $100k-200k, 7.4% for AGIs over 200k)
Taxable individual retirement arrangement distribution: $15,430 (reported on 7.8% of returns)
79316:
$15,430
Texas:
$19,511
(% of AGI for various income ranges: 1.7% for AGIs below $25k, 1.3% for AGIs $25k-50k, 2.6% for AGIs $50k-75k, 2.7% for AGIs $75k-100k, 3.2% for AGIs $100k-200k, 4.2% for AGIs over 200k)
Total itemized deductions: $20,758 (17% of AGI, reported on 11.4% of returns)
Here:
$20,758
State:
$24,724
Here:
17.2% of AGI
State:
15.9% of AGI
(% of AGI for various income ranges: 3.2% for AGIs below $25k, 3.3% for AGIs $25k-50k, 5.8% for AGIs $50k-75k, 5.3% for AGIs $75k-100k, 7.7% for AGIs $100k-200k, 5.1% for AGIs over 200k)
Charity contributions: $7,653 (reported on 9.0% of returns)
Here:
$7,653
State:
$6,808
(% of AGI for various income ranges: 0.5% for AGIs below $25k, 0.5% for AGIs $25k-50k, 1.2% for AGIs $50k-75k, 1.2% for AGIs $75k-100k, 2.6% for AGIs $100k-200k, 2.5% for AGIs over 200k)
Taxes paid: $3,957 (reported on 11.2% of returns)
79316:
$3,957
State:
$6,921
(% of AGI for various income ranges: 0.3% for AGIs below $25k, 0.5% for AGIs $25k-50k, 1.0% for AGIs $50k-75k, 1.0% for AGIs $75k-100k, 1.6% for AGIs $100k-200k, 1.3% for AGIs over 200k)
Earned income credit: $2,509 (reported on 30.6% of returns)
Here:
$2,509
State:
$2,570
(% of AGI for various income ranges: 9.9% for AGIs below $25k, 2.0% for AGIs $25k-50k)
Percentage of individuals using paid preparers for their 2012 taxes: 67.0%
Here:
67%
State:
51%
(% for various income ranges: 63.7% for AGIs below $25k, 67.0% for AGIs $25k-50k, 69.2% for AGIs $50k-75k, 69.0% for AGIs $75k-100k, 75.9% for AGIs $100k-200k, 88.9% for AGIs over 200k)
Averages for the 2004 tax year for zip code 79316, filed in 2005:
Average Adjusted Gross Income (AGI) in 2004: $32,330 (Individual Income Tax Returns)
Here:
$32,330
State:
$47,881
Salary/wage: $25,999 (reported on 84.4% of returns)
Here:
$25,999
State:
$41,947
(% of AGI for various income ranges: 100.0% for AGIs below $10k, 82.5% for AGIs $10k-25k, 78.4% for AGIs $25k-50k, 72.9% for AGIs $50k-75k, 66.3% for AGIs $75k-100k, 38.4% for AGIs over 100k)
Taxable interest for individuals: $2,132 (reported on 28.6% of returns)
This zip code:
$2,132
Texas:
$2,255
(% of AGI for various income ranges: 2.6% for AGIs below $10k, 1.5% for AGIs $10k-25k, 1.8% for AGIs $25k-50k, 1.7% for AGIs $50k-75k, 2.0% for AGIs $75k-100k, 2.2% for AGIs over 100k)
Taxable dividends: $3,339 (reported on 13.8% of returns)
Here:
$3,339
State:
$4,261
(% of AGI for various income ranges: 1.1% for AGIs below $10k, 0.6% for AGIs $10k-25k, 0.7% for AGIs $25k-50k, 1.2% for AGIs $50k-75k, 1.4% for AGIs $75k-100k, 3.1% for AGIs over 100k)
Net capital gain/loss: +$4,841 (reported on 11.1% of returns)
Here:
+$4,841
State:
+$16,110
(% of AGI for various income ranges: -0.5% for AGIs below $10k, 0.0% for AGIs $10k-25k, 0.6% for AGIs $25k-50k, 1.1% for AGIs $50k-75k, 1.0% for AGIs $75k-100k, 5.2% for AGIs over 100k)
Profit/loss from business: +$6,361 (reported on 15.3% of returns)
Here:
+$6,361
State:
+$11,013
(% of AGI for various income ranges: 5.4% for AGIs below $10k, 3.7% for AGIs $10k-25k, 2.3% for AGIs $25k-50k, 1.4% for AGIs $50k-75k, 3.3% for AGIs $75k-100k, 4.0% for AGIs over 100k)
Profit/loss from farming: +$22,045 (reported on 6.0% of returns)
Here:
+$22,045
State:
-$9,403
(% of AGI for various income ranges: -0.6% for AGIs below $10k, -1.0% for AGIs $10k-25k, 1.4% for AGIs $25k-50k, 0.8% for AGIs $50k-75k, 7.3% for AGIs $75k-100k, 12.0% for AGIs over 100k)
IRA payment deduction: $3,500 (reported on 1.7% of returns)
79316:
$3,500
Texas:
$3,120
(% of AGI for various income ranges: 0.2% for AGIs $25k-50k, 0.2% for AGIs $50k-75k, 0.4% for AGIs $75k-100k, 0.2% for AGIs over 100k)
Self-employed pension: $16,941 (reported on 0.4% of returns)
Here:
$16,941
Texas:
$16,401
Total itemized deductions: $16,872 (20% of AGI, reported on 11.2% of returns)
Here:
$16,872
State:
$19,631
Here:
20.3% of AGI
State:
18.9% of AGI
(% of AGI for various income ranges: 4.7% for AGIs below $10k, 3.2% for AGIs $10k-25k, 5.2% for AGIs $25k-50k, 7.1% for AGIs $50k-75k, 6.7% for AGIs $75k-100k, 7.2% for AGIs over 100k)
Charity contributions deductions: $6,339 (7% of AGI, reported on 9.5% of returns)
Here:
$6,339
State:
$4,753
Here:
7.0% of AGI
State:
4.2% of AGI
(% of AGI for various income ranges: 0.3% for AGIs below $10k, 0.5% for AGIs $10k-25k, 1.2% for AGIs $25k-50k, 2.0% for AGIs $50k-75k, 2.2% for AGIs $75k-100k, 3.4% for AGIs over 100k)
Total tax: $5,515 (reported on 59.6% of returns)
79316:
$5,515
State:
$9,058
(% of AGI for various income ranges: 2.4% for AGIs below $10k, 3.0% for AGIs $10k-25k, 5.8% for AGIs $25k-50k, 8.9% for AGIs $50k-75k, 13.0% for AGIs $75k-100k, 20.5% for AGIs over 100k)
Earned income credit: $2,025 (reported on 33.7% of returns)
Here:
$2,025
State:
$2,024
Percentage of individuals using paid preparers for their 2004 taxes: 76.4%
Here:
76%
State:
57%
(% for various income ranges: 69.3% for AGIs below $10k, 81.2% for AGIs $10k-25k, 76.6% for AGIs $25k-50k, 74.4% for AGIs $50k-75k, 77.4% for AGIs $75k-100k, 86.8% for AGIs over 100k)
Household received Food Stamps/SNAP in the past 12 months: 897 Household did not receive Food Stamps/SNAP in the past 12 months: 3,058
Women who had a birth in the past 12 months: 72 (59 now married, 13 unmarried) Women who did not have a birth in the past 12 months: 1,943 (738 now married, 1,208 unmarried)
Housing units in zip code 79316 with a mortgage: 915 (50 second mortgage, 55 both second mortgage and home equity loan) Median monthly owner costs for units with a mortgage: $1,361 Median monthly owner costs for units without a mortgage: $399
Residents with income below the poverty level in 2022:
This zip code:
24.2%
Whole state:
14.0%
Residents with income below 50% of the poverty level in 2022:
This zip code:
12.0%
Whole state:
7.4%
Median number of rooms in houses and condos:
Here:
5.7
State:
6.3
Median number of rooms in apartments:
Here:
5.0
State:
4.0
Notable locations in this zip code not listed on our city pages
Notable locations in zip code 79316: Brownfield Country Club (A), Terry County Courthouse (B), Terry County Historical Museum (C), Brownfield Fire Department (D). Display/hide their locations on the map
Churches in zip code 79316 include: Challis Church (A), First Presbyterian Church (B), Brownfield United Pentecostal Church (C), Shady Oak Church of God (D), Church of God (E), Church of Christ (F), Saint Anthonys Catholic Church (G), Immanuel Baptist Church (H), Fellowship Baptist Church (I). Display/hide their locations on the map
Cemeteries: Meadow Cemetery (1), Old County Cemetery (2), Old Mount Zion Cemetery (3), Gomez Cemetery (4), New Mount Zion Cemetery (5), County Memorial Cemetery (6), Union Cemetery (7). Display/hide their locations on the map
In group quarters: 786 (-1 institutionalized population)
Size of family households: 1,028 2-persons, 687 3-persons, 478 4-persons, 235 5-persons, 38 6-persons, 95 7-or-more-persons
Size of nonfamily households: 1,167 1-person, 216 2-persons
1,197 married couples with children.
1,057 single-parent households (1,057 women).
61.2% of residents of 79316 zip code speak English at home.
35.3% of residents speak Spanish at home (75% very well, 4% well, 8% not well, 13% not at all).
4.0% of residents speak other Indo-European language at home (45% very well, 34% well, 14% not well, 7% not at all).
0.1% of residents speak Asian or Pacific Island language at home (100% very well).
0.1% of residents speak other language at home (100% very well).
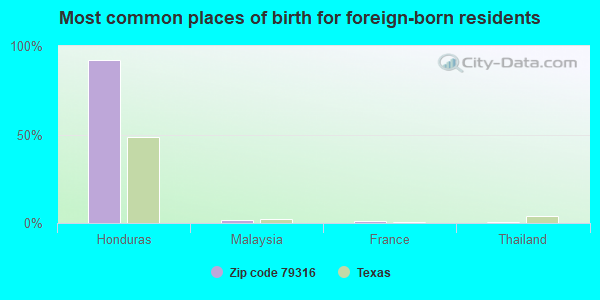
Foreign born population: 923 (8.9%) (28.0% of them are naturalized citizens)
This zip code:
8.9%
Whole state:
17.2%
92%Honduras
2%Malaysia
1%France
0%Thailand
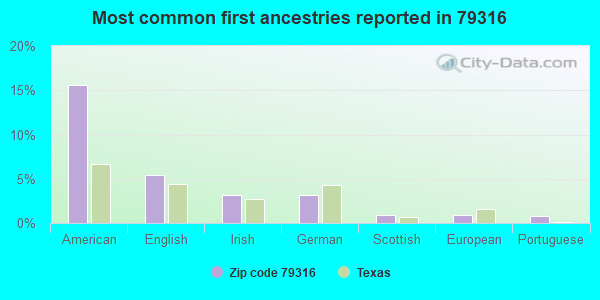
16%American
5%English
3%Irish
3%German
1%Scottish
1%European
1%Portuguese
Year of entry for the foreign-born population
3192010 or later
2102000 to 2009
2041990 to 1999
332Before 1990
Facilities with environmental interests located in this zip code:
AMERADA HESS CORPORATION (17 M S OF BROWNFIELD ON FM 403 in BROWNFIELD, TX)
AIR MAJOR (AIRS/AFS) CRITERIA AND HAZARDOUS AIR POLLUTANT INVENTORY (Inventory of air pollution sources) (Resource Conservation and Recovery Act (tracking hazardous waste)) Business SIC classification: CRUDE PETROLEUM AND NATURAL GAS; NATURAL GAS LIQUIDS Business NAICS classification: CRUDE PETROLEUM AND NATURAL GAS EXTRACTION.; CRUDE PETROLEUM AND NATURAL GAS EXTRACTION. Organizations: AMERADA HESS CORP. (CONTACT/OPERATOR)
ASHLAND INC (DAVID BAILEY RD & I2006 in BROWNFIELD, TX)
(Resource Conservation and Recovery Act (tracking hazardous waste)) Alternative names: SCURLOCK PERMIAN CORP
B E IMPLEMENT (SEAGRAVES RD in BROWNFIELD, TX)
Small Quantity Generators, between 100 kg and 1000 kg of hazardous waste/month (Resource Conservation and Recovery Act (tracking hazardous waste)) - notification Organizations: B E IMPLEMENT CO (CONTACT/OPERATOR)
ANDERSON GRAIN CORP. (LEVELLAND "Y" in BROWNFIELD, TX)
COMPLIANCE ACTIVITY (Tracking inspections of insecticide, fungicide, and rodenticide, and toxic substances)
Housing units lacking complete plumbing facilities: 6.8% Housing units lacking complete kitchen facilities: 6.5%
54.8%Utility gas
41.1%Electricity
4.1%Bottled, tank, or LP gas
Population in 1990: 11,954.
Place of birth for U.S.-born residents:
This state: 7,884
Northeast: 322
Midwest: 234
South: 389
West: 404
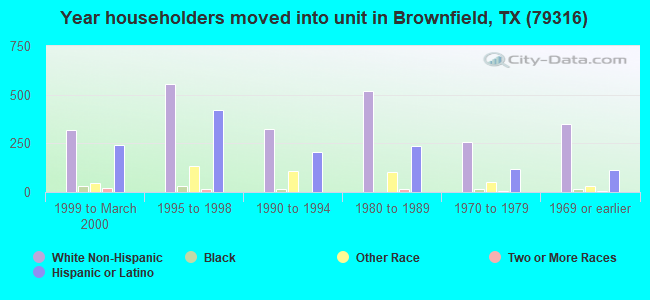
61% of the 79316 zip code residents lived in the same house 5 years ago. Out of people who lived in different houses, 60% lived in this county. Out of people who lived in different counties, 50% lived in Texas.
84% of the 79316 zip code residents lived in the same house 1 year ago. Out of people who lived in different houses, 36% moved from this county. Out of people who lived in different houses, 55% moved from different county within same state. Out of people who lived in different houses, 7% moved from different state. Out of people who lived in different houses, 2% moved from abroad.
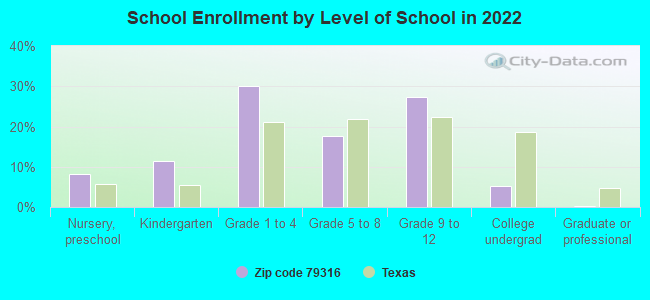
Private vs. public school enrollment:
Students in private schools in grades 1 to 8 (elementary and middle school): 90
Here:
7.5%
Texas:
8.8%
Students in private schools in grades 9 to 12 (high school): 19
Here:
2.8%
Texas:
8.0%
Students in private undergraduate colleges: 19
Here:
14.8%
Texas:
16.2%
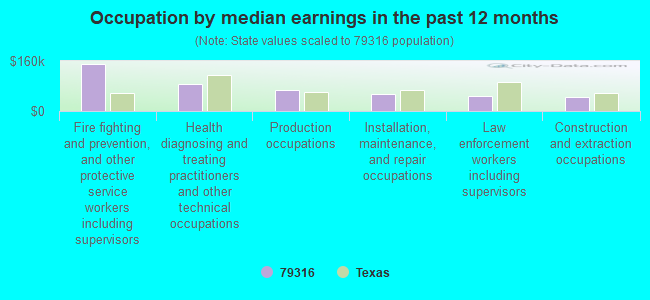
Occupation by median earnings in the past 12 months ($)
150,071Fire fighting and prevention, and other protective service workers including supervisors
86,131Health diagnosing and treating practitioners and other technical occupations
66,524Production occupations
55,564Installation, maintenance, and repair occupations
47,274Law enforcement workers including supervisors
45,086Construction and extraction occupations
Top industries in this zip code by the number of employees in 2005:
Health Care and Social Assistance: Nursing Care Facilities (100-249 employees: 1 establishment, 50-99 employees: 1 establishment)
Health Care and Social Assistance: General Medical and Surgical Hospitals (100-249: 1)
135 people in nursing facilities/skilled-nursing facilities
123 people in local jails and other municipal confinement facilities
50 people in correctional residential facilities
People in group quarters in 2000:
764 people in state prisons
119 people in local jails and other confinement facilities (including police lockups)
88 people in nursing homes
Fatal accident statistics in 2014:
Fatal accident count: 2
Vehicles involved in fatal accidents: 5
Fatal accidents caused by drunken drivers: 1
Fatalities: 3
Persons involved in fatal accidents: 10
Pedestrians involved in fatal accidents: 0
Fatal accident statistics in 2013:
Fatal accident count: 1
Vehicles involved in fatal accidents: 2
Fatal accidents caused by drunken drivers: 0
Fatalities: 2
Persons involved in fatal accidents: 4
Pedestrians involved in fatal accidents: 0
2002 - 2018 National Fire Incident Reporting System (NFIRS) incidents
According to the data from the years 2002 - 2018 the average number of fire incidents per year is 91. The highest number of fires - 154 took place in 2008, and the least - 49 in 2003. The data has a dropping trend.
When looking into fire subcategories, the most reports belonged to: Outside Fires (65.8%), and Structure Fires (16.6%).
Fire incident types reported to NFIRS in Zip Code 79316


+$22,045
-$9,403
(% of AGI for various income ranges: -0.6% for AGIs below $10k, -1.0% for AGIs $10k-25k, 1.4% for AGIs $25k-50k, 0.8% for AGIs $50k-75k, 7.3% for AGIs $75k-100k, 12.0% for AGIs over 100k) Nearest zip codes: 79378, 79345, 79342, 79377, 79359, 79358.


 According to the data from the years 2002 - 2018 the average number of fire incidents per year is 91. The highest number of fires - 154 took place in 2008, and the least - 49 in 2003. The data has a dropping trend.
 When looking into fire subcategories, the most reports belonged to: Outside Fires (65.8%), and Structure Fires (16.6%).