Estimated zip code population in 2022: 7,713 Zip code population in 2010: 7,854 Zip code population in 2000: 7,653
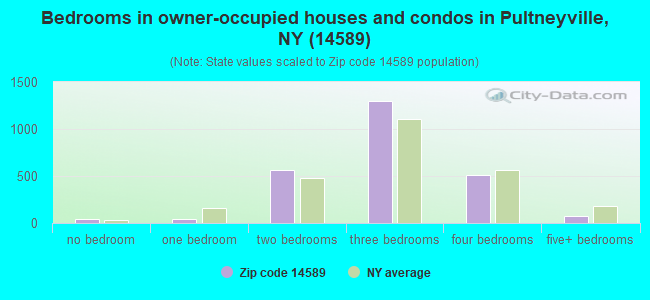
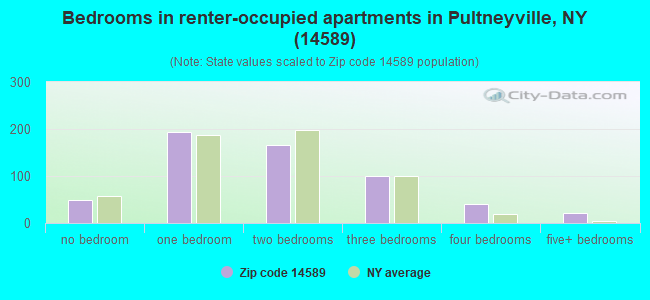
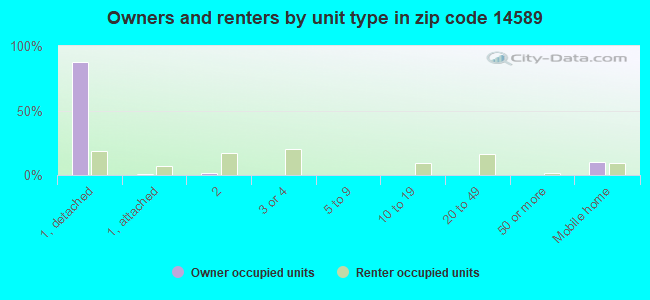
Houses and condos: 3,404 Renter-occupied apartments: 571
% of renters here:
18%
State:
46%
March 2022 cost of living index in zip code 14589: 94.0 (less than average, U.S. average is 100)
Land area: 43.8 sq. mi. Water area: 0.0 sq. mi.
Population density: 176 people per square mile
(very low).
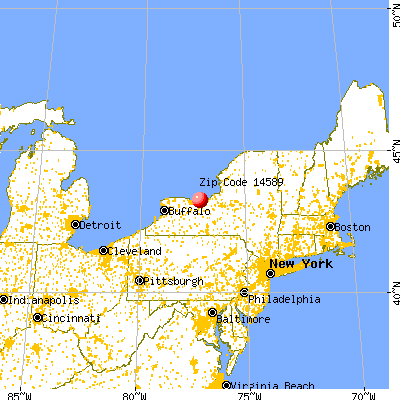
OSM Map
General Map
Google Map
MSN Map
OSM Map
General Map
Google Map
MSN Map
OSM Map
General Map
Google Map
MSN Map
OSM Map
General Map
Google Map
MSN Map
Please wait while loading the map...
Real estate property taxes paid for housing units in 2022:
This zip code:
2.6% ($4,644)
New York:
1.5% ($6,180)
Median real estate property taxes paid for housing units with mortgages in 2022: $4,733 (2.6%) Median real estate property taxes paid for housing units with no mortgage in 2022: $4,418 (2.8%)
Business Search- 14 Million verified businesses
Males: 3,966
(51.4%)
Females: 3,747
(48.6%)
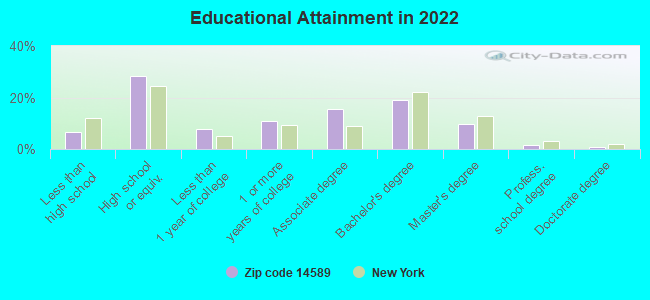
For population 25 years and over in 14589:
High school or higher: 93.1%
Bachelor's degree or higher: 30.7%
Graduate or professional degree: 11.8%
Unemployed: 5.3%
Mean travel time to work (commute): 24.0 minutes
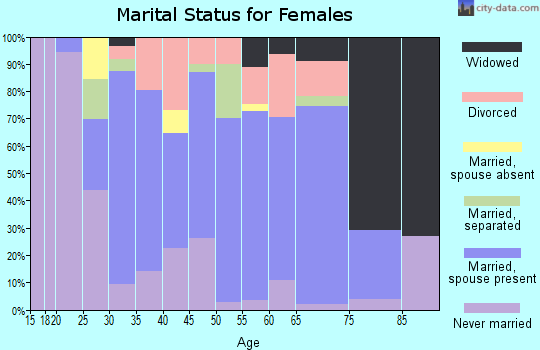
For population 15 years and over in 14589:
Never married: 28.7%
Now married: 56.9%
Separated: 1.7%
Widowed: 4.0%
Divorced: 8.7%
Zip code 14589 compared to state average:
Median house value significantly below state average.
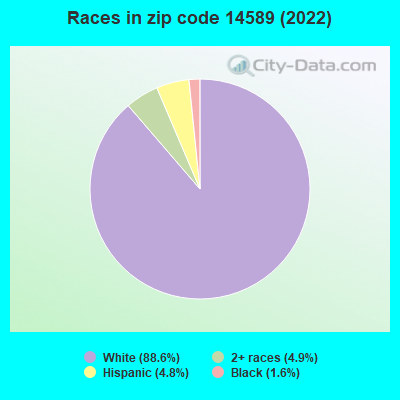
Black race population percentage significantly below state average.
Hispanic race population percentage significantly below state average.
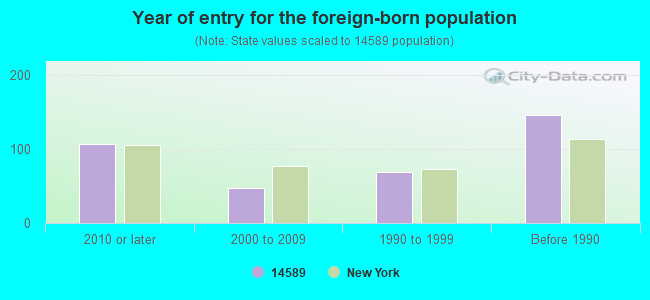
Foreign-born population percentage significantly below state average.
Renting percentage significantly below state average.
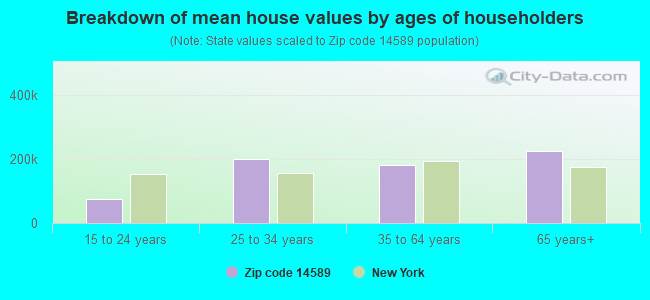
Estimated median house/condo value in 2022: $176,172
14589:
$176,172
New York:
$400,400
According to our research of New York and other state lists, there were 8 registered sex offenders living in 14589 zip code as of June 07, 2024. The ratio of all residents to sex offenders in zip code 14589 is 966 to 1. The ratio of registered sex offenders to all residents in this zip code is near the state average.
Median resident age:
This zip code:
40.8 years
New York median age:
40.0 years
Average household size:
This zip code:
2.4 people
New York:
2.5 people
Averages for the 2020 tax year for zip code 14589, filed in 2021:
Average Adjusted Gross Income (AGI) in 2020: $59,332 (Individual Income Tax Returns)
Here:
$59,332
State:
$90,930
Salary/wage: $49,171 (reported on 81.8% of returns)
Here:
$49,171
State:
$72,104
(% of AGI for various income ranges: 1289.7% for AGIs below $25k, 3616.9% for AGIs $25k-50k, 6053.4% for AGIs $50k-75k, 9232.6% for AGIs $75k-100k, 16263.0% for AGIs $100k-200k, 58513.3% for AGIs over 200k)
Taxable interest for individuals: $916 (reported on 39.7% of returns)
This zip code:
$916
New York:
$3,075
(% of AGI for various income ranges: 12.1% for AGIs below $25k, 13.1% for AGIs $25k-50k, 35.9% for AGIs $50k-75k, 75.2% for AGIs $75k-100k, 145.5% for AGIs $100k-200k, 1413.3% for AGIs over 200k)
Ordinary dividends: $3,897 (reported on 18.7% of returns)
Here:
$3,897
State:
$11,095
(% of AGI for various income ranges: 26.5% for AGIs below $25k, 29.0% for AGIs $25k-50k, 79.3% for AGIs $50k-75k, 94.1% for AGIs $75k-100k, 221.2% for AGIs $100k-200k, 3886.7% for AGIs over 200k)
Net capital gain/loss in AGI: +$5,989 (reported on 15.5% of returns)
Here:
+$5,989
State:
+$44,925
(% of AGI for various income ranges: 2.7% for AGIs below $25k, 26.5% for AGIs $25k-50k, 129.0% for AGIs $50k-75k, 175.2% for AGIs $75k-100k, 475.2% for AGIs $100k-200k, 2996.7% for AGIs over 200k)
Profit/loss from business: +$12,114 (reported on 10.5% of returns)
Here:
+$12,114
State:
+$14,940
(% of AGI for various income ranges: 103.0% for AGIs below $25k, 93.2% for AGIs $25k-50k, 192.9% for AGIs $50k-75k, 139.6% for AGIs $75k-100k, 710.3% for AGIs $100k-200k)
Taxable individual retirement arrangement distribution: $21,741 (reported on 14.0% of returns)
14589:
$21,741
New York:
$19,609
(% of AGI for various income ranges: 130.9% for AGIs below $25k, 169.2% for AGIs $25k-50k, 548.5% for AGIs $50k-75k, 844.4% for AGIs $75k-100k, 1580.9% for AGIs $100k-200k)
Total itemized deductions: $24,959 (reported on 4.2% of returns)
Here:
$24,959
State:
$39,326
(% of AGI for various income ranges: 75.7% for AGIs $25k-50k, 216.1% for AGIs $50k-75k, 260.7% for AGIs $75k-100k, 353.9% for AGIs $100k-200k, 2830.0% for AGIs over 200k)
Charity contributions: $6,450 (reported on 3.0% of returns)
Here:
$6,450
State:
$15,420
(% of AGI for various income ranges: 40.7% for AGIs $50k-75k, 38.5% for AGIs $75k-100k, 63.9% for AGIs $100k-200k, 973.3% for AGIs over 200k)
Taxes paid: $8,265 (reported on 4.2% of returns)
14589:
$8,265
State:
$9,183
(% of AGI for various income ranges: 19.2% for AGIs $25k-50k, 82.7% for AGIs $50k-75k, 98.5% for AGIs $75k-100k, 120.9% for AGIs $100k-200k, 800.0% for AGIs over 200k)
Earned income credit: $1,984 (reported on 14.2% of returns)
Here:
$1,984
State:
$2,138
(% of AGI for various income ranges: 87.3% for AGIs below $25k, 54.6% for AGIs $25k-50k)
Percentage of individuals using paid preparers for their 2020 taxes: 95.5%
Here:
96%
State:
95%
(% for various income ranges: 93.0% for AGIs below $25k, 96.2% for AGIs $25k-50k, 96.6% for AGIs $50k-75k, 95.1% for AGIs $75k-100k, 98.2% for AGIs $100k-200k, 100.0% for AGIs over 200k)
Averages for the 2012 tax year for zip code 14589, filed in 2013:
Average Adjusted Gross Income (AGI) in 2012: $51,034 (Individual Income Tax Returns)
Here:
$51,034
State:
$77,088
Salary/wage: $42,286 (reported on 85.2% of returns)
Here:
$42,286
State:
$60,593
(% of AGI for various income ranges: 74.6% for AGIs below $25k, 75.5% for AGIs $25k-50k, 75.6% for AGIs $50k-75k, 75.4% for AGIs $75k-100k, 73.9% for AGIs $100k-200k, 38.3% for AGIs over 200k)
Taxable interest for individuals: $666 (reported on 44.8% of returns)
This zip code:
$666
New York:
$3,125
(% of AGI for various income ranges: 0.8% for AGIs below $25k, 0.6% for AGIs $25k-50k, 0.4% for AGIs $50k-75k, 0.5% for AGIs $75k-100k, 0.6% for AGIs $100k-200k, 0.8% for AGIs over 200k)
Ordinary dividends: $2,515 (reported on 21.4% of returns)
Here:
$2,515
State:
$10,299
(% of AGI for various income ranges: 1.7% for AGIs below $25k, 0.9% for AGIs $25k-50k, 0.7% for AGIs $50k-75k, 0.6% for AGIs $75k-100k, 1.0% for AGIs $100k-200k, 2.3% for AGIs over 200k)
Net capital gain/loss in AGI: +$3,367 (reported on 14.8% of returns)
Here:
+$3,367
State:
+$42,474
(% of AGI for various income ranges: 0.5% for AGIs $25k-50k, 0.3% for AGIs $50k-75k, 0.7% for AGIs $75k-100k, 1.8% for AGIs $100k-200k, 2.5% for AGIs over 200k)
Profit/loss from business: +$11,721 (reported on 11.5% of returns)
Here:
+$11,721
State:
+$16,168
(% of AGI for various income ranges: 3.1% for AGIs below $25k, 2.6% for AGIs $25k-50k, 1.7% for AGIs $50k-75k, 0.9% for AGIs $75k-100k, 5.6% for AGIs $100k-200k)
Taxable individual retirement arrangement distribution: $18,984 (reported on 15.4% of returns)
14589:
$18,984
New York:
$17,621
(% of AGI for various income ranges: 5.9% for AGIs below $25k, 6.6% for AGIs $25k-50k, 6.5% for AGIs $50k-75k, 6.2% for AGIs $75k-100k, 6.8% for AGIs $100k-200k)
Self-employment retirement plans: $17,350 (reported on 0.5% of returns)
14589:
$17,350
New York:
$27,330
Total itemized deductions: $18,721 (20% of AGI, reported on 32.1% of returns)
Here:
$18,721
State:
$34,985
Here:
20.3% of AGI
State:
21.3% of AGI
(% of AGI for various income ranges: 6.8% for AGIs below $25k, 8.8% for AGIs $25k-50k, 11.7% for AGIs $50k-75k, 12.5% for AGIs $75k-100k, 14.8% for AGIs $100k-200k, 12.3% for AGIs over 200k)
Charity contributions: $2,468 (reported on 25.3% of returns)
Here:
$2,468
State:
$5,572
(% of AGI for various income ranges: 0.5% for AGIs below $25k, 0.9% for AGIs $25k-50k, 1.2% for AGIs $50k-75k, 1.3% for AGIs $75k-100k, 1.6% for AGIs $100k-200k, 1.3% for AGIs over 200k)
Taxes paid: $9,558 (reported on 32.1% of returns)
14589:
$9,558
State:
$18,656
(% of AGI for various income ranges: 2.0% for AGIs below $25k, 3.6% for AGIs $25k-50k, 5.3% for AGIs $50k-75k, 6.4% for AGIs $75k-100k, 8.0% for AGIs $100k-200k, 8.7% for AGIs over 200k)
Earned income credit: $1,982 (reported on 15.7% of returns)
Here:
$1,982
State:
$2,230
(% of AGI for various income ranges: 5.0% for AGIs below $25k, 0.9% for AGIs $25k-50k)
Percentage of individuals using paid preparers for their 2012 taxes: 62.4%
Here:
62%
State:
66%
(% for various income ranges: 54.7% for AGIs below $25k, 63.2% for AGIs $25k-50k, 69.0% for AGIs $50k-75k, 69.4% for AGIs $75k-100k, 68.4% for AGIs $100k-200k, 83.3% for AGIs over 200k)
Averages for the 2004 tax year for zip code 14589, filed in 2005:
Average Adjusted Gross Income (AGI) in 2004: $43,502 (Individual Income Tax Returns)
Here:
$43,502
State:
$59,519
Salary/wage: $38,516 (reported on 85.8% of returns)
Here:
$38,516
State:
$50,673
(% of AGI for various income ranges: 98.6% for AGIs below $10k, 72.1% for AGIs $10k-25k, 78.3% for AGIs $25k-50k, 80.7% for AGIs $50k-75k, 84.0% for AGIs $75k-100k, 64.6% for AGIs over 100k)
Taxable interest for individuals: $786 (reported on 59.2% of returns)
This zip code:
$786
New York:
$2,377
(% of AGI for various income ranges: 4.9% for AGIs below $10k, 2.6% for AGIs $10k-25k, 1.2% for AGIs $25k-50k, 0.5% for AGIs $50k-75k, 0.4% for AGIs $75k-100k, 1.2% for AGIs over 100k)
Taxable dividends: $1,396 (reported on 28.1% of returns)
Here:
$1,396
State:
$5,394
(% of AGI for various income ranges: 5.4% for AGIs below $10k, 1.7% for AGIs $10k-25k, 0.8% for AGIs $25k-50k, 0.6% for AGIs $50k-75k, 0.4% for AGIs $75k-100k, 1.0% for AGIs over 100k)
Net capital gain/loss: +$2,797 (reported on 20.1% of returns)
Here:
+$2,797
State:
+$23,581
(% of AGI for various income ranges: -1.0% for AGIs below $10k, 0.8% for AGIs $10k-25k, 0.5% for AGIs $25k-50k, 0.6% for AGIs $50k-75k, 0.8% for AGIs $75k-100k, 3.1% for AGIs over 100k)
Profit/loss from business: +$10,863 (reported on 12.5% of returns)
Here:
+$10,863
State:
+$13,809
(% of AGI for various income ranges: 7.6% for AGIs below $10k, 4.4% for AGIs $10k-25k, 3.1% for AGIs $25k-50k, 0.5% for AGIs $50k-75k, 1.8% for AGIs $75k-100k, 5.6% for AGIs over 100k)
Profit/loss from farming: +$2,373 (reported on 2.2% of returns)
Here:
+$2,373
State:
-$2,666
(% of AGI for various income ranges: 0.3% for AGIs $10k-25k, 0.2% for AGIs $25k-50k, 0.5% for AGIs $50k-75k, -0.3% for AGIs $75k-100k)
IRA payment deduction: $3,144 (reported on 2.6% of returns)
14589:
$3,144
New York:
$3,115
(% of AGI for various income ranges: 0.3% for AGIs $10k-25k, 0.4% for AGIs $25k-50k, 0.2% for AGIs $50k-75k, 0.1% for AGIs over 100k)
Self-employed pension: $12,273 (reported on 0.6% of returns)
Here:
$12,273
New York:
$19,016
Total itemized deductions: $15,838 (21% of AGI, reported on 38.0% of returns)
Here:
$15,838
State:
$25,864
Here:
20.9% of AGI
State:
21.9% of AGI
(% of AGI for various income ranges: 10.6% for AGIs below $10k, 9.8% for AGIs $10k-25k, 11.9% for AGIs $25k-50k, 14.8% for AGIs $50k-75k, 15.9% for AGIs $75k-100k, 14.6% for AGIs over 100k)
Charity contributions deductions: $2,214 (3% of AGI, reported on 34.4% of returns)
Here:
$2,214
State:
$4,439
Here:
2.8% of AGI
State:
3.6% of AGI
(% of AGI for various income ranges: 0.5% for AGIs below $10k, 0.9% for AGIs $10k-25k, 1.3% for AGIs $25k-50k, 1.8% for AGIs $50k-75k, 2.2% for AGIs $75k-100k, 2.1% for AGIs over 100k)
Total tax: $6,023 (reported on 75.5% of returns)
14589:
$6,023
State:
$11,730
(% of AGI for various income ranges: 2.4% for AGIs below $10k, 4.1% for AGIs $10k-25k, 6.5% for AGIs $25k-50k, 8.1% for AGIs $50k-75k, 10.3% for AGIs $75k-100k, 18.2% for AGIs over 100k)
Earned income credit: $1,612 (reported on 12.6% of returns)
Here:
$1,612
State:
$1,757
Percentage of individuals using paid preparers for their 2004 taxes: 64.2%
Here:
64%
State:
67%
(% for various income ranges: 50.6% for AGIs below $10k, 64.8% for AGIs $10k-25k, 68.3% for AGIs $25k-50k, 70.6% for AGIs $50k-75k, 67.4% for AGIs $75k-100k, 68.3% for AGIs over 100k)
Household received Food Stamps/SNAP in the past 12 months: 422 Household did not receive Food Stamps/SNAP in the past 12 months: 2,668
Women who had a birth in the past 12 months: 175 (95 now married, 81 unmarried) Women who did not have a birth in the past 12 months: 1,423 (603 now married, 815 unmarried)
Housing units in zip code 14589 with a mortgage: 1,621 (211 second mortgage, 9 home equity loan, 204 both second mortgage and home equity loan) Houses without a mortgage: 299
Median monthly owner costs for units with a mortgage: $1,416 Median monthly owner costs for units without a mortgage: $742
Residents with income below the poverty level in 2022:
This zip code:
7.6%
Whole state:
14.3%
Residents with income below 50% of the poverty level in 2022:
This zip code:
3.2%
Whole state:
6.8%
Median number of rooms in houses and condos:
Here:
6.3
State:
6.3
Median number of rooms in apartments:
Here:
3.6
State:
3.8
Notable locations in this zip code not listed on our city pages
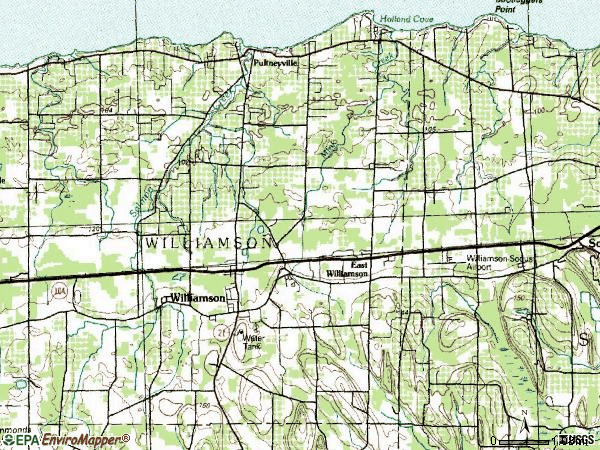
Notable locations in zip code 14589: CC Farms (A), Lagoner Farms (B), Mason Farms (C), Noto Fruit Farm (D), Orbakers Fruit Farm (E), Hughes Marina (F), Pultneyville Yacht Club (G), Myra Shipley Garfield Memorial Building (H), Williamson Fire Company Number 1 (I), Williamson Free Public Library (J), Williamson Town Hall (K). Display/hide their locations on the map
Churches in zip code 14589 include: First Methodist Church (A), Reformed Church of East Williamson (B), Free Methodist Church (C), The First Baptist Church of Williamson (D), Williamson Presbyterian Church (E), Bible Baptist Church (F), Community of Faith Church (G), Harvest Fellowship Assembly of God (H), Pultneyville United Methodist Church (I). Display/hide their locations on the map
In group quarters: 284 (-1 institutionalized population)
Size of family households: 1,175 2-persons, 370 3-persons, 382 4-persons, 192 5-persons, 94 6-persons, 18 7-or-more-persons
Size of nonfamily households: 664 1-person, 197 2-persons
865 married couples with children.
595 single-parent households (208 men, 387 women).
94.6% of residents of 14589 zip code speak English at home.
3.2% of residents speak Spanish at home (72% very well, 25% well, 3% not well, 1% not at all).
1.1% of residents speak other Indo-European language at home (80% very well, 14% well, 6% not well).
0.9% of residents speak other language at home (100% very well).
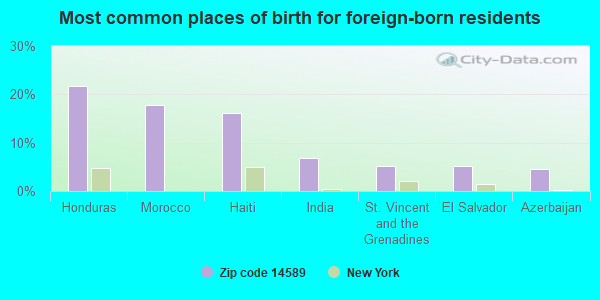
Foreign born population: 305 (4.0%) (67.4% of them are naturalized citizens)
This zip code:
4.0%
Whole state:
22.7%
22%Honduras
18%Morocco
16%Haiti
7%India
5%St. Vincent and the Grenadines
5%El Salvador
5%Azerbaijan
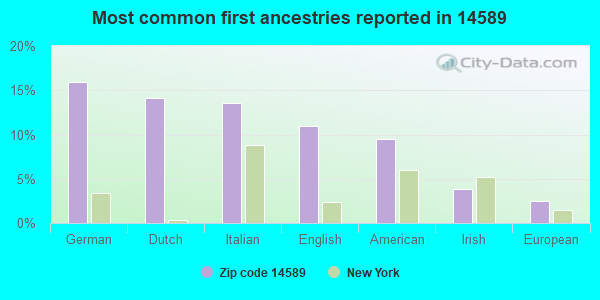
16%German
14%Dutch
14%Italian
11%English
9%American
4%Irish
3%European
Year of entry for the foreign-born population
1072010 or later
472000 to 2009
691990 to 1999
146Before 1990
Facilities with environmental interests located in this zip code:
AGWAY INC WAREHOUSE (4392 RTE 104 in WILLIAMSON, NY)
(Resource Conservation and Recovery Act (tracking hazardous waste)) Alternative names: AGWAY INC UNION CARBIDE
APPLETOWN MOTORS US EPA TS-766C (4392 RTE 104 in WILLIAMSON, NY)
(Resource Conservation and Recovery Act (tracking hazardous waste))
ALARD EQUIPMENT CORP (6483 LAKE AVE BLDG 5 in WILLIAMSON, NY)
(Resource Conservation and Recovery Act (tracking hazardous waste))
HAPPY REFRIGERATED SERVICES (4009 RTE 104 in WILLIAMSON, NY)
(Resource Conservation and Recovery Act (tracking hazardous waste))
Housing units lacking complete plumbing facilities: 2.9% Housing units lacking complete kitchen facilities: 2.1%
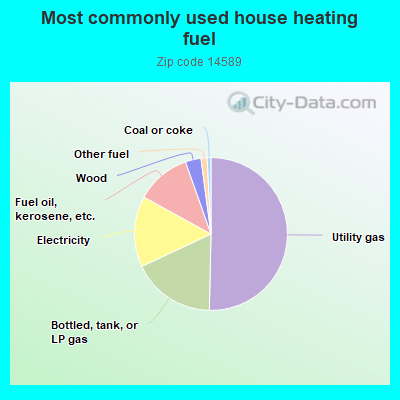
50.4%Utility gas
17.7%Bottled, tank, or LP gas
15.0%Electricity
11.6%Fuel oil, kerosene, etc.
3.3%Wood
1.3%Other fuel
0.8%Coal or coke
Population in 1990: 7,947.
Place of birth for U.S.-born residents:
This state: 6,619
Northeast: 225
Midwest: 97
South: 273
West: 101
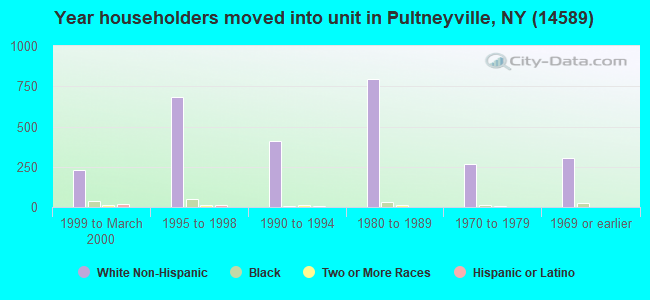
71% of the 14589 zip code residents lived in the same house 5 years ago. Out of people who lived in different houses, 58% lived in this county. Out of people who lived in different counties, 50% lived in New York.
90% of the 14589 zip code residents lived in the same house 1 year ago. Out of people who lived in different houses, 49% moved from this county. Out of people who lived in different houses, 42% moved from different county within same state. Out of people who lived in different houses, 8% moved from different state.
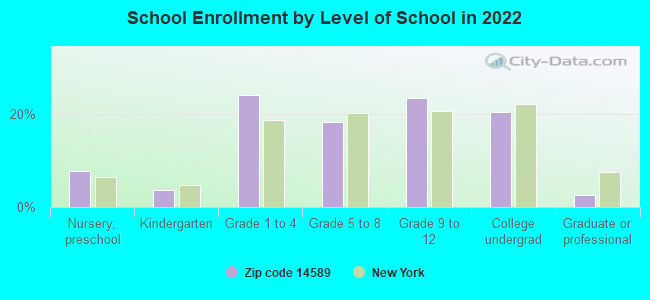
Private vs. public school enrollment:
Students in private schools in grades 1 to 8 (elementary and middle school): 2
Here:
0.3%
New York:
15.6%
Students in private schools in grades 9 to 12 (high school): 35
Here:
9.0%
New York:
15.0%
Students in private undergraduate colleges: 72
Here:
21.3%
New York:
39.2%
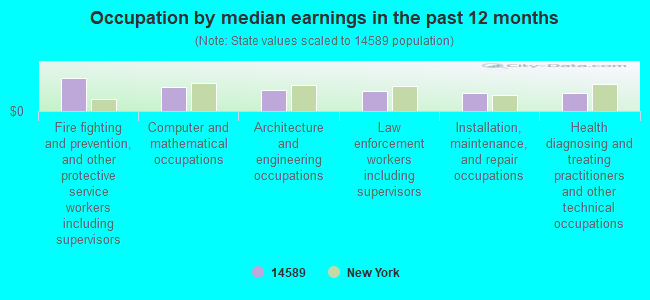
Occupation by median earnings in the past 12 months ($)
126,607Fire fighting and prevention, and other protective service workers including supervisors
92,473Computer and mathematical occupations
78,632Architecture and engineering occupations
75,558Law enforcement workers including supervisors
68,863Installation, maintenance, and repair occupations
68,144Health diagnosing and treating practitioners and other technical occupations
Companies with federal contracts located in this zip code:
R BROOKS ASSOCIATES, INC (6546 POUND RD in WILLIAMSON, NY; small business) : $199,079 in 7 contractsfrom 2000 to 2005
Contracts for Miscellaneous Alarm, Signal and Security Detection Systems, Miscellaneous Communication Equipment, Intercommunication and Public Address Systems, Except Airborne, Maintenance, Repair and Rebuilding of Equipment -- Photographic Equipment by Tennessee Valley Authority, Navy, U.S. Army Corps of Engineers - civil program financing only Signed by year:2000: $146,000; 2001: $0; 2002: $4,035; 2003: $2,021; 2004: $28,286; 2005: $18,737; 2006: $0.
Biggest contracts:
$88,000 with Tennessee Valley Authority for Miscellaneous Alarm, Signal and Security Detection Systems. Signed on 2000-03-15. Completion date: 2000-05-15.
$58,000, same as above.Signed on 2000-03-15. Completion date: 2000-04-15.
$28,386 with Navy for Miscellaneous Communication Equipment. Signed on 2004-12-16. Completion date: 2005-01-03.
$18,737 with Navy for Intercommunication and Public Address Systems, Except Airborne. Taking place in VA. Signed on 2005-03-14. Completion date: 2005-04-01.
Top industries in this zip code by the number of employees in 2005:
2002 - 2018 National Fire Incident Reporting System (NFIRS) incidents
According to the data from the years 2002 - 2018 the average number of fire incidents per year is 9. The highest number of fire incidents - 25 took place in 2018, and the least - 0 in 2006. The data has a rising trend.
When looking into fire subcategories, the most reports belonged to: Structure Fires (72.4%), and Outside Fires (18.6%).
Fire incident types reported to NFIRS in Zip Code 14589


+$2,373
-$2,666
(% of AGI for various income ranges: 0.3% for AGIs $10k-25k, 0.2% for AGIs $25k-50k, 0.5% for AGIs $50k-75k, -0.3% for AGIs $75k-100k) Nearest zip codes: 14505, 14551, 14568, 14519, 14513, 14522.


 According to the data from the years 2002 - 2018 the average number of fire incidents per year is 9. The highest number of fire incidents - 25 took place in 2018, and the least - 0 in 2006. The data has a rising trend.
 When looking into fire subcategories, the most reports belonged to: Structure Fires (72.4%), and Outside Fires (18.6%).