Estimated zip code population in 2022: 12,556 Zip code population in 2010: 11,669 Zip code population in 2000: 11,568
Houses and condos: 5,197 Renter-occupied apartments: 1,195
% of renters here:
24%
State:
38%
March 2022 cost of living index in zip code 01030: 118.3 (more than average, U.S. average is 100)
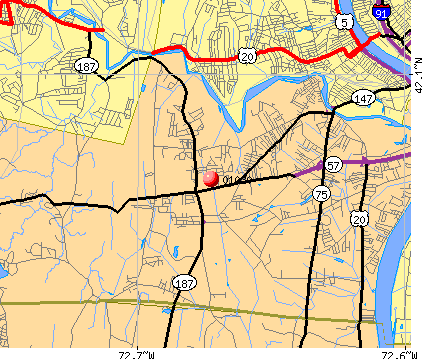
Land area: 11.9 sq. mi. Water area: 0.2 sq. mi.
Population density: 1,058 people per square mile
(low).
OSM Map
Google Map
MSN Map
OSM Map
General Map
Google Map
MSN Map
OSM Map
Google Map
MSN Map
OSM Map
Google Map
MSN Map
Please wait while loading the map...
Real estate property taxes paid for housing units in 2022:
This zip code:
1.3% ($4,145)
Massachusetts:
1.0% ($5,536)
Median real estate property taxes paid for housing units with mortgages in 2022: $4,228 (1.3%) Median real estate property taxes paid for housing units with no mortgage in 2022: $3,946 (1.3%)
Estimated median house/condo value in 2022: $318,345
01030:
$318,345
Massachusetts:
$534,700
According to our research of Massachusetts and other state lists, there were 4 registered sex offenders living in 01030 zip code as of June 01, 2024. The ratio of all residents to sex offenders in zip code 01030 is 2,860 to 1. The ratio of registered sex offenders to all residents in this zip code is lower than the state average.
Median resident age:
This zip code:
46.7 years
Massachusetts median age:
40.3 years
Average household size:
This zip code:
2.5 people
Massachusetts:
2.4 people
Averages for the 2020 tax year for zip code 01030, filed in 2021:
Average Adjusted Gross Income (AGI) in 2020: $72,185 (Individual Income Tax Returns)
Here:
$72,185
State:
$105,130
Salary/wage: $63,336 (reported on 81.0% of returns)
Here:
$63,336
State:
$82,951
(% of AGI for various income ranges: 1108.8% for AGIs below $25k, 3403.6% for AGIs $25k-50k, 6140.7% for AGIs $50k-75k, 8436.3% for AGIs $75k-100k, 18348.5% for AGIs $100k-200k, 71733.8% for AGIs over 200k)
Taxable interest for individuals: $973 (reported on 35.5% of returns)
This zip code:
$973
Massachusetts:
$2,361
(% of AGI for various income ranges: 16.3% for AGIs below $25k, 19.1% for AGIs $25k-50k, 32.3% for AGIs $50k-75k, 73.0% for AGIs $75k-100k, 92.6% for AGIs $100k-200k, 667.5% for AGIs over 200k)
Ordinary dividends: $2,903 (reported on 22.2% of returns)
Here:
$2,903
State:
$10,365
(% of AGI for various income ranges: 25.0% for AGIs below $25k, 36.1% for AGIs $25k-50k, 46.1% for AGIs $50k-75k, 164.3% for AGIs $75k-100k, 158.9% for AGIs $100k-200k, 1405.0% for AGIs over 200k)
Net capital gain/loss in AGI: +$11,889 (reported on 17.8% of returns)
Here:
+$11,889
State:
+$48,178
(% of AGI for various income ranges: 11.8% for AGIs below $25k, 33.5% for AGIs $25k-50k, 23.6% for AGIs $50k-75k, 167.0% for AGIs $75k-100k, 356.5% for AGIs $100k-200k, 11396.2% for AGIs over 200k)
Profit/loss from business: +$14,144 (reported on 13.1% of returns)
Here:
+$14,144
State:
+$20,792
(% of AGI for various income ranges: 76.6% for AGIs below $25k, 143.2% for AGIs $25k-50k, 167.1% for AGIs $50k-75k, 283.7% for AGIs $75k-100k, 563.2% for AGIs $100k-200k, 3345.0% for AGIs over 200k)
Taxable individual retirement arrangement distribution: $17,321 (reported on 11.5% of returns)
01030:
$17,321
Massachusetts:
$22,790
(% of AGI for various income ranges: 78.6% for AGIs below $25k, 140.5% for AGIs $25k-50k, 257.4% for AGIs $50k-75k, 423.0% for AGIs $75k-100k, 670.1% for AGIs $100k-200k, 1860.0% for AGIs over 200k)
Self-employed (Keogh) retirement plans: $20,000 (reported on 0.5% of returns)
01030:
$20,000
Massachusetts:
$26,868
(% of AGI for various income ranges: 83.3% for AGIs $100k-200k)
Total itemized deductions: $24,317 (reported on 7.6% of returns)
Here:
$24,317
State:
$36,722
(% of AGI for various income ranges: 74.7% for AGIs below $25k, 90.5% for AGIs $25k-50k, 267.4% for AGIs $50k-75k, 465.2% for AGIs $75k-100k, 530.3% for AGIs $100k-200k, 2376.2% for AGIs over 200k)
Charity contributions: $4,281 (reported on 5.2% of returns)
Here:
$4,281
State:
$12,529
(% of AGI for various income ranges: 9.2% for AGIs $25k-50k, 21.3% for AGIs $50k-75k, 39.1% for AGIs $75k-100k, 89.0% for AGIs $100k-200k, 388.8% for AGIs over 200k)
Taxes paid: $8,213 (reported on 7.6% of returns)
01030:
$8,213
State:
$8,782
(% of AGI for various income ranges: 13.6% for AGIs below $25k, 26.0% for AGIs $25k-50k, 101.7% for AGIs $50k-75k, 168.9% for AGIs $75k-100k, 192.2% for AGIs $100k-200k, 736.2% for AGIs over 200k)
Earned income credit: $1,664 (reported on 8.6% of returns)
Here:
$1,664
State:
$1,909
(% of AGI for various income ranges: 39.2% for AGIs below $25k, 45.2% for AGIs $25k-50k)
Percentage of individuals using paid preparers for their 2020 taxes: 92.4%
Here:
92%
State:
92%
(% for various income ranges: 89.5% for AGIs below $25k, 93.2% for AGIs $25k-50k, 92.7% for AGIs $50k-75k, 93.9% for AGIs $75k-100k, 93.6% for AGIs $100k-200k, 96.2% for AGIs over 200k)
Averages for the 2012 tax year for zip code 01030, filed in 2013:
Average Adjusted Gross Income (AGI) in 2012: $58,014 (Individual Income Tax Returns)
Here:
$58,014
State:
$81,425
Salary/wage: $52,853 (reported on 86.6% of returns)
Here:
$52,853
State:
$64,752
(% of AGI for various income ranges: 73.7% for AGIs below $25k, 75.9% for AGIs $25k-50k, 74.7% for AGIs $50k-75k, 80.7% for AGIs $75k-100k, 84.0% for AGIs $100k-200k, 71.9% for AGIs over 200k)
Taxable interest for individuals: $861 (reported on 43.6% of returns)
This zip code:
$861
Massachusetts:
$2,136
(% of AGI for various income ranges: 1.6% for AGIs below $25k, 0.6% for AGIs $25k-50k, 0.9% for AGIs $50k-75k, 0.5% for AGIs $75k-100k, 0.5% for AGIs $100k-200k, 0.4% for AGIs over 200k)
Ordinary dividends: $2,005 (reported on 22.7% of returns)
Here:
$2,005
State:
$9,473
(% of AGI for various income ranges: 1.2% for AGIs below $25k, 0.7% for AGIs $25k-50k, 0.8% for AGIs $50k-75k, 0.7% for AGIs $75k-100k, 0.7% for AGIs $100k-200k, 1.1% for AGIs over 200k)
Net capital gain/loss in AGI: +$3,050 (reported on 14.4% of returns)
Here:
+$3,050
State:
+$31,437
(% of AGI for various income ranges: 0.2% for AGIs $25k-50k, 0.4% for AGIs $50k-75k, 0.4% for AGIs $75k-100k, 1.1% for AGIs $100k-200k, 2.1% for AGIs over 200k)
Profit/loss from business: +$14,820 (reported on 12.7% of returns)
Here:
+$14,820
State:
+$20,662
(% of AGI for various income ranges: 6.4% for AGIs below $25k, 4.5% for AGIs $25k-50k, 3.5% for AGIs $50k-75k, 3.2% for AGIs $75k-100k, 3.0% for AGIs $100k-200k)
Taxable individual retirement arrangement distribution: $11,246 (reported on 9.8% of returns)
01030:
$11,246
Massachusetts:
$18,892
(% of AGI for various income ranges: 3.6% for AGIs below $25k, 2.3% for AGIs $25k-50k, 2.5% for AGIs $50k-75k, 2.0% for AGIs $75k-100k, 1.7% for AGIs $100k-200k)
Self-employment retirement plans: $14,400 (reported on 0.5% of returns)
01030:
$14,400
Massachusetts:
$20,669
Total itemized deductions: $19,618 (20% of AGI, reported on 39.6% of returns)
Here:
$19,618
State:
$28,907
Here:
20.1% of AGI
State:
18.2% of AGI
(% of AGI for various income ranges: 8.6% for AGIs below $25k, 10.7% for AGIs $25k-50k, 13.8% for AGIs $50k-75k, 14.9% for AGIs $75k-100k, 14.5% for AGIs $100k-200k, 12.6% for AGIs over 200k)
Charity contributions: $1,808 (reported on 32.1% of returns)
Here:
$1,808
State:
$4,208
(% of AGI for various income ranges: 0.4% for AGIs below $25k, 0.7% for AGIs $25k-50k, 0.9% for AGIs $50k-75k, 1.1% for AGIs $75k-100k, 1.2% for AGIs $100k-200k, 1.0% for AGIs over 200k)
Taxes paid: $8,695 (reported on 39.6% of returns)
01030:
$8,695
State:
$13,303
(% of AGI for various income ranges: 2.3% for AGIs below $25k, 3.5% for AGIs $25k-50k, 5.2% for AGIs $50k-75k, 6.4% for AGIs $75k-100k, 7.3% for AGIs $100k-200k, 6.8% for AGIs over 200k)
Earned income credit: $1,783 (reported on 10.5% of returns)
Here:
$1,783
State:
$1,971
(% of AGI for various income ranges: 3.4% for AGIs below $25k, 0.8% for AGIs $25k-50k)
Percentage of individuals using paid preparers for their 2012 taxes: 56.3%
Here:
56%
State:
56%
(% for various income ranges: 49.8% for AGIs below $25k, 56.7% for AGIs $25k-50k, 61.1% for AGIs $50k-75k, 61.3% for AGIs $75k-100k, 58.5% for AGIs $100k-200k, 75.0% for AGIs over 200k)
Averages for the 2004 tax year for zip code 01030, filed in 2005:
Average Adjusted Gross Income (AGI) in 2004: $49,496 (Individual Income Tax Returns)
Here:
$49,496
State:
$62,877
Salary/wage: $46,254 (reported on 89.3% of returns)
Here:
$46,254
State:
$52,969
(% of AGI for various income ranges: 98.4% for AGIs below $10k, 71.9% for AGIs $10k-25k, 82.3% for AGIs $25k-50k, 84.5% for AGIs $50k-75k, 88.5% for AGIs $75k-100k, 81.1% for AGIs over 100k)
Taxable interest for individuals: $909 (reported on 57.2% of returns)
This zip code:
$909
Massachusetts:
$1,945
(% of AGI for various income ranges: 3.2% for AGIs below $10k, 2.6% for AGIs $10k-25k, 1.1% for AGIs $25k-50k, 0.9% for AGIs $50k-75k, 0.6% for AGIs $75k-100k, 1.0% for AGIs over 100k)
Taxable dividends: $1,086 (reported on 26.7% of returns)
Here:
$1,086
State:
$5,323
(% of AGI for various income ranges: 2.0% for AGIs below $10k, 1.2% for AGIs $10k-25k, 0.7% for AGIs $25k-50k, 0.6% for AGIs $50k-75k, 0.4% for AGIs $75k-100k, 0.4% for AGIs over 100k)
Net capital gain/loss: +$3,825 (reported on 18.3% of returns)
Here:
+$3,825
State:
+$20,377
(% of AGI for various income ranges: -1.1% for AGIs below $10k, -0.0% for AGIs $10k-25k, 0.2% for AGIs $25k-50k, 0.4% for AGIs $50k-75k, 0.4% for AGIs $75k-100k, 3.9% for AGIs over 100k)
Profit/loss from business: +$12,710 (reported on 12.9% of returns)
Here:
+$12,710
State:
+$17,837
(% of AGI for various income ranges: 5.0% for AGIs below $10k, 7.5% for AGIs $10k-25k, 2.9% for AGIs $25k-50k, 2.7% for AGIs $50k-75k, 2.3% for AGIs $75k-100k, 3.7% for AGIs over 100k)
IRA payment deduction: $3,107 (reported on 2.9% of returns)
01030:
$3,107
Massachusetts:
$3,100
(% of AGI for various income ranges: 0.3% for AGIs $10k-25k, 0.3% for AGIs $25k-50k, 0.2% for AGIs $50k-75k, 0.1% for AGIs $75k-100k, 0.1% for AGIs over 100k)
Self-employed pension: $10,420 (reported on 0.9% of returns)
Here:
$10,420
Massachusetts:
$14,516
(% of AGI for various income ranges: 0.3% for AGIs $50k-75k, 0.1% for AGIs $75k-100k, 0.3% for AGIs over 100k)
Total itemized deductions: $16,161 (20% of AGI, reported on 43.9% of returns)
Here:
$16,161
State:
$22,573
Here:
20.3% of AGI
State:
19.5% of AGI
(% of AGI for various income ranges: 13.8% for AGIs below $10k, 8.0% for AGIs $10k-25k, 12.3% for AGIs $25k-50k, 16.0% for AGIs $50k-75k, 16.0% for AGIs $75k-100k, 14.3% for AGIs over 100k)
Charity contributions deductions: $1,568 (2% of AGI, reported on 40.4% of returns)
Here:
$1,568
State:
$3,295
Here:
1.9% of AGI
State:
2.7% of AGI
(% of AGI for various income ranges: 0.5% for AGIs below $10k, 0.6% for AGIs $10k-25k, 1.1% for AGIs $25k-50k, 1.4% for AGIs $50k-75k, 1.4% for AGIs $75k-100k, 1.4% for AGIs over 100k)
Total tax: $6,420 (reported on 82.8% of returns)
01030:
$6,420
State:
$11,494
(% of AGI for various income ranges: 2.6% for AGIs below $10k, 5.1% for AGIs $10k-25k, 7.8% for AGIs $25k-50k, 8.8% for AGIs $50k-75k, 10.0% for AGIs $75k-100k, 15.8% for AGIs over 100k)
Earned income credit: $1,352 (reported on 7.6% of returns)
Here:
$1,352
State:
$1,518
Percentage of individuals using paid preparers for their 2004 taxes: 55.0%
Here:
55%
State:
58%
(% for various income ranges: 41.1% for AGIs below $10k, 50.5% for AGIs $10k-25k, 57.3% for AGIs $25k-50k, 63.5% for AGIs $50k-75k, 60.6% for AGIs $75k-100k, 60.6% for AGIs over 100k)
Likely homosexual households (counted as self-reported same-sex unmarried-partner households)
Lesbian couples: 0.0% of all households
Gay men: 0.2% of all households
Household received Food Stamps/SNAP in the past 12 months: 474 Household did not receive Food Stamps/SNAP in the past 12 months: 4,537
Women who had a birth in the past 12 months: 44 (35 now married, 9 unmarried) Women who did not have a birth in the past 12 months: 2,715 (1,144 now married, 1,561 unmarried)
Housing units in zip code 01030 with a mortgage: 2,639 (436 second mortgage, 409 both second mortgage and home equity loan) Houses without a mortgage: 56
Median monthly owner costs for units with a mortgage: $1,897 Median monthly owner costs for units without a mortgage: $729
Residents with income below the poverty level in 2022:
This zip code:
6.1%
Whole state:
10.4%
Residents with income below 50% of the poverty level in 2022:
This zip code:
2.2%
Whole state:
5.1%
Median number of rooms in houses and condos:
Here:
6.3
State:
6.5
Median number of rooms in apartments:
Here:
3.9
State:
4.0
Notable locations in this zip code not listed on our city pages
Notable locations in zip code 01030: Oak Ridge Golf Club (A), Saint Anne Country Club (B), Agawam Fire Department Station 2 (C), Clifford M Granger School Library (D). Display/hide their locations on the map
Churches in zip code 01030 include: Valley Community Church (A), Saint Davids Episcopal Church (B), Sacred Heart Parish Center (C), Grace Baptist Church (D), Feeding Hills Congregational Church (E), Crossroads Christian Church (F), Calvary Assembly of God Church (G). Display/hide their locations on the map
Lakes and reservoirs: Taylor Pond (A), Leonard Pond (B), Harts Pond (C), Westfield River Reservoir (D), Provin Mountain Reservoir (E). Display/hide their locations on the map
In group quarters: 30 (-1 institutionalized population)
Size of family households: 1,533 2-persons, 518 3-persons, 809 4-persons, 431 5-persons, 61 6-persons, 36 7-or-more-persons
Size of nonfamily households: 1,321 1-person, 351 2-persons
1,638 married couples with children.
345 single-parent households (111 men, 234 women).
93.1% of residents of 01030 zip code speak English at home.
0.7% of residents speak Spanish at home (83% very well, 12% not well, 4% not at all).
3.7% of residents speak other Indo-European language at home (54% very well, 26% well, 14% not well, 6% not at all).
1.7% of residents speak Asian or Pacific Island language at home (74% very well, 26% well).
0.1% of residents speak other language at home (100% well).
Foreign born population: 717 (5.7%) (91.2% of them are naturalized citizens)
This zip code:
5.7%
Whole state:
18.0%
22%Romania
12%Serbia
10%Sri Lanka
8%Uzbekistan
5%Italy
5%Singapore
3%Greece
22%American
14%Irish
13%Italian
7%French Canadian
6%Polish
6%French
5%English
Year of entry for the foreign-born population
382010 or later
2062000 to 2009
1351990 to 1999
391Before 1990
Facilities with environmental interests located in this zip code:
CLIFFORD M GRANGER (31 SO. WESTFIELD STREET in FEEDING HILLS, MA)
(National Center for Education Statistics) - STATE ID-005010 Organizations: AGAWAM (SCHOOL DISTRICT)
AGAWAM PUBLIC SCHOOLS (1305 SPRINGFIELD STREET in FEEDING HILLS, MA)
COMPLIANCE ACTIVITY (Tracking inspections of insecticide, fungicide, and rodenticide, and toxic substances) Alternative names: AGAWAM JUNIOR HIGH
Housing units lacking complete plumbing facilities: 0.9% Housing units lacking complete kitchen facilities: 1.1%
52.0%Utility gas
22.1%Electricity
22.1%Fuel oil, kerosene, etc.
1.9%Bottled, tank, or LP gas
1.4%Other fuel
Population in 1990: 11,985.
Place of birth for U.S.-born residents:
This state: 8,825
Northeast: 1,871
Midwest: 181
South: 719
West: 98
72% of the 01030 zip code residents lived in the same house 5 years ago. Out of people who lived in different houses, 89% lived in this county. Out of people who lived in different counties, 50% lived in Massachusetts.
94% of the 01030 zip code residents lived in the same house 1 year ago. Out of people who lived in different houses, 50% moved from this county. Out of people who lived in different houses, 7% moved from different county within same state. Out of people who lived in different houses, 38% moved from different state. Out of people who lived in different houses, 8% moved from abroad.
Private vs. public school enrollment:
Students in private schools in grades 1 to 8 (elementary and middle school): 126
Here:
12.7%
Massachusetts:
10.3%
Students in private schools in grades 9 to 12 (high school): 20
Here:
2.9%
Massachusetts:
12.3%
Students in private undergraduate colleges: 362
Here:
47.5%
Massachusetts:
51.2%
Occupation by median earnings in the past 12 months ($)
103,882Computer and mathematical occupations
102,158Architecture and engineering occupations
100,525Community and social service occupations
96,465Management occupations
82,948Health diagnosing and treating practitioners and other technical occupations
69,206Arts, design, entertainment, sports, and media occupations
Companies with federal contracts located in this zip code:
KUDLIC BROS, INC (491B SPRINGFIELD STREET in FEEDING HILLS, MA; small business) : $88,165 in 3 contractsfrom 2001 to 2002
$76,750 with Air Force for Other Environmental Services, Studies, and Analytical Support. Signed on 2001-09-30. Completion date: 2002-01-14.
$10,400 with Navy for Maintenance, Repair or Alteration of Real Property -- Highways, Roads, Streets, Bridges, and Railways (includes resurfacing). Taking place in CA. Signed on 2002-05-30. Completion date: 2002-06-30.
$1,015, same as above.Signed on 2002-06-05. Completion date: 2002-06-30.
CONTENTI OSCAR (CORSO BUOZZI, 2/4 in CIVITA CASTELL, In; small business)
-$2,011 with Air Force for Maintenance, Repair or Alteration of Real Property -- Office Buildings. Taking place in DC. Signed on 2000-09-13. Completion date: 2000-09-13.
Top industries in this zip code by the number of employees in 2005:
2004 - 2018 National Fire Incident Reporting System (NFIRS) incidents
According to the data from the years 2004 - 2018 the average number of fire incidents per year is 7. The highest number of reported fire incidents - 29 took place in 2006, and the least - 0 in 2015. The data has a constant trend.
When looking into fire subcategories, the most incidents belonged to: Structure Fires (49.5%), and Outside Fires (35.0%).
Fire incident types reported to NFIRS in Zip Code 01030


 Nearest zip codes: 01001, 01089, 06093, 06078, 01077, 01107.


 According to the data from the years 2004 - 2018 the average number of fire incidents per year is 7. The highest number of reported fire incidents - 29 took place in 2006, and the least - 0 in 2015. The data has a constant trend.
 When looking into fire subcategories, the most incidents belonged to: Structure Fires (49.5%), and Outside Fires (35.0%).