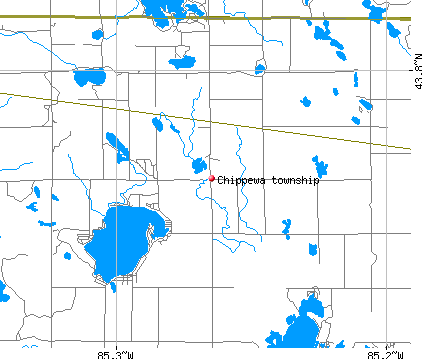
Chippewa township, Mecosta County, Michigan (MI) detailed profile
Number of foreign born residents: 1 (100% naturalized citizens)
| Chippewa township: | 0.9% |
| Whole state: | 5.3% |
62% of Chippewa township residents lived in the same house 5 years ago.
Out of people who lived in different houses, 38% lived in this county.
Out of people who lived in different counties, 88% lived in Michigan.
Place of birth for U.S.-born residents:
- This state: 1097
- Northeast: 14
- Midwest: 60
- South: 38
- West: 9
Median price asked for vacant for-sale houses in 2000: $72,500
Percentage of households with unmarried partners: 6.8%
Likely homosexual households (counted as self-reported same-sex unmarried-partner households)
- Lesbian couples: 0.2% of all households
- Gay men: 0.0% of all households
8 people in other group homes

Housing units in structures:
- One, detached: 864
- One, attached: 4
- 3 or 4: 3
- 5 to 9: 5
- Mobile homes: 248
- Boats, RVs, vans, etc.: 16
Median worth of mobile homes: $46,100
Housing units in Chippewa township with a mortgage: 133 (0 second mortgage, 6 home equity loan, 0 both second mortgage and home equity loan)
Houses without a mortgage: 103
- Construction (13%)
- Transportation equipment (12%)
- Agriculture, forestry, fishing and hunting (5%)
- Public administration (5%)
- Educational services (5%)
- Machinery (5%)
- Food and beverage stores (5%)
- Educational services (16%)
- Health care (12%)
- Transportation equipment (9%)
- Department and other general merchandise stores (8%)
- Accommodation and food services (8%)
- Leather and allied products (5%)
- Publishing, and motion picture and sound recording industries (4%)
- Other production occupations including supervisors (12%)
- Metal workers and plastic workers (7%)
- Driver/sales workers and truck drivers (6%)
- Laborers and material movers, hand (6%)
- Construction laborers (5%)
- Assemblers and fabricators (5%)
- Material recording, scheduling, dispatching, and distributing workers (4%)
- Other office and administrative support workers including supervisors (8%)
- Assemblers and fabricators (7%)
- Retail sales workers except cashiers (6%)
- Other sales and related workers including supervisors (6%)
- Other production occupations including supervisors (6%)
- Other healthcare support occupations (5%)
- Other teachers and instructors, education, training, and library occupations (5%)
Most common first ancestries reported in Chippewa township:
- German (27.3%)
- English (12.8%)
- Irish (11.3%)
- United States or American (11.2%)
- Polish (6.6%)
- Scottish (5.5%)
- Italian (3.1%)
Most common places of birth for the foreign-born residents:
- Italy (45%)
- Netherlands (18%)
- Poland (18%)
- Canada (18%)
Means of transportation to work:
- Drove a car alone: 351 (76%)
- Carpooled: 81 (17%)
- Walked: 6 (1%)
- Other means: 1 (0%)
- Worked at home: 24 (5%)
Most commonly used house heating fuel:
- Utility gas (48%)
- Bottled, tank, or LP gas (36%)
- Wood (6%)
- Fuel oil, kerosene, etc. (6%)
- Electricity (4%)
8 people in other group homes
96.3% of residents of Chippewa township speak English at home.
1.4% of residents speak Spanish at home (88% speak English very well, 13% speak English not well).
2.3% of residents speak other Indo-European language at home (81% speak English very well, 7% speak English well, 11% speak English not well).
Household type by relationship:
Households: 1,222- In family households: 1,039 (294 male householders, 63 female householders)
281 spouses, 328 children (298 natural, 3 adopted, 27 stepchildren), 21 grandchildren, 5 brothers or sisters, 5 parents, 12 other relatives, 30 non-relatives
- In nonfamily households: 183 (88 male householders (63 living alone)), 62 female householders (56 living alone)), 33 nonrelatives
- In group quarters: 7 (0 institutionalized population)
Size of family households: 185 2-persons, 63 3-persons, 77 4-persons, 26 5-persons, 6 7-or-more-persons,
Size of nonfamily households: 119 1-person, 26 2-persons, 3 3-persons, 2 4-persons,
163 married couples with children.
69 single-parent households (22 men, 47 women).
Private vs. public school enrollment:
Students in private schools in grades 1 to 8 (elementary and middle school): 6
| Here: | 5.8% |
| Michigan: | 11.2% |
Students in private schools in grades 9 to 12 (high school): 4
| Here: | 4.9% |
| Michigan: | 8.7% |
Students in private undergraduate colleges: 5
| Here: | 11.4% |
| Michigan: | 16.5% |