Races in Warrensburg, Missouri (MO) Detailed Stats
Data:
Races - White alone (%)
Races - White alone (% change since 2000)
Races - Black alone (%)
Races - Black alone (% change since 2000)
Races - American Indian alone (%)
Races - American Indian alone (% change since 2000)
Races - Asian alone (%)
Races - Asian alone (% change since 2000)
Races - Hispanic (%)
Races - Hispanic (% change since 2000)
Races - Native Hawaiian and Other Pacific Islander alone (%)
Races - Native Hawaiian and Other Pacific Islander alone (% change since 2000)
Races - Two or more races(%)
Races - Two or more races(% change since 2000)
Races - Other race alone (%)
Races - Other race alone (% change since 2000)
Racial diversity
Place of birth - Born in state of residence (%)
Place of birth - Born in state of residence (%) - White
Place of birth - Born in state of residence (%) - Black or African American
Place of birth - Born in state of residence (%) - Asian
Place of birth - Born in state of residence (%) - Hispanic or Latino
Place of birth - Born in state of residence (%) - American Indian and Alaska Native
Place of birth - Born in state of residence (%) - Multirace
Place of birth - Born in state of residence (%) - Other Race
Place of birth - Born in other state (%)
Place of birth - Born in other state (%) - White
Place of birth - Born in other state (%) - Black or African American
Place of birth - Born in other state (%) - Asian
Place of birth - Born in other state (%) - Hispanic or Latino
Place of birth - Born in other state (%) - American Indian and Alaska Native
Place of birth - Born in other state (%) - Multirace
Place of birth - Born in other state (%) - Other Race
Place of birth - Native, outside of US (%)
Place of birth - Native, outside of US (%) - White
Place of birth - Native, outside of US (%) - Black or African American
Place of birth - Native, outside of US (%) - Asian
Place of birth - Native, outside of US (%) - Hispanic or Latino
Place of birth - Native, outside of US (%) - American Indian and Alaska Native
Place of birth - Native, outside of US (%) - Multirace
Place of birth - Native, outside of US (%) - Other Race
Place of birth - Foreign born (%)
Place of birth - Foreign born (%) - White
Place of birth - Foreign born (%) - Black or African American
Place of birth - Foreign born (%) - Asian
Place of birth - Foreign born (%) - Hispanic or Latino
Place of birth - Foreign born (%) - American Indian and Alaska Native
Place of birth - Foreign born (%) - Multirace
Place of birth - Foreign born (%) - Other Race
Residents speaking English at home (%)
Residents speaking English at home - Born in the United States (%)
Residents speaking English at home - Native, born elsewhere (%)
Residents speaking English at home - Foreign born (%)
Residents speaking Spanish at home (%)
Residents speaking Spanish at home - Born in the United States (%)
Residents speaking Spanish at home - Native, born elsewhere (%)
Residents speaking Spanish at home - Foreign born (%)
Residents speaking other language at home (%)
Residents speaking other language at home - Born in the United States (%)
Residents speaking other language at home - Native, born elsewhere (%)
Residents speaking other language at home - Foreign born (%)
Marital status - Never married (%)
Marital status - Now married (%)
Marital status - Separated (%)
Marital status - Widowed (%)
Marital status - Divorced (%)
Ancestries Reported - Arab (%)
Ancestries Reported - Czech (%)
Ancestries Reported - Danish (%)
Ancestries Reported - Dutch (%)
Ancestries Reported - English (%)
Ancestries Reported - French (%)
Ancestries Reported - French Canadian (%)
Ancestries Reported - German (%)
Ancestries Reported - Greek (%)
Ancestries Reported - Hungarian (%)
Ancestries Reported - Irish (%)
Ancestries Reported - Italian (%)
Ancestries Reported - Lithuanian (%)
Ancestries Reported - Norwegian (%)
Ancestries Reported - Polish (%)
Ancestries Reported - Portuguese (%)
Ancestries Reported - Russian (%)
Ancestries Reported - Scotch-Irish (%)
Ancestries Reported - Scottish (%)
Ancestries Reported - Slovak (%)
Ancestries Reported - Subsaharan African (%)
Ancestries Reported - Swedish (%)
Ancestries Reported - Swiss (%)
Ancestries Reported - Ukrainian (%)
Ancestries Reported - United States (%)
Ancestries Reported - Welsh (%)
Ancestries Reported - West Indian (%)
Ancestries Reported - Other (%)
Geographical mobility - Same house 1 year ago (%)
Geographical mobility - Same house 1 year ago (%) - White
Geographical mobility - Same house 1 year ago (%) - Black or African American
Geographical mobility - Same house 1 year ago (%) - Asian
Geographical mobility - Same house 1 year ago (%) - Hispanic or Latino
Geographical mobility - Same house 1 year ago (%) - American Indian and Alaska Native
Geographical mobility - Same house 1 year ago (%) - Multirace
Geographical mobility - Same house 1 year ago (%) - Other Race
Geographical mobility - Moved within same county (%)
Geographical mobility - Moved within same county (%) - White
Geographical mobility - Moved within same county (%) - Black or African American
Geographical mobility - Moved within same county (%) - Asian
Geographical mobility - Moved within same county (%) - Hispanic or Latino
Geographical mobility - Moved within same county (%) - American Indian and Alaska Native
Geographical mobility - Moved within same county (%) - Multirace
Geographical mobility - Moved within same county (%) - Other Race
Geographical mobility - Moved from different county within same state (%)
Geographical mobility - Moved from different county within same state (%) - White
Geographical mobility - Moved from different county within same state (%) - Black or African American
Geographical mobility - Moved from different county within same state (%) - Asian
Geographical mobility - Moved from different county within same state (%) - Hispanic or Latino
Geographical mobility - Moved from different county within same state (%) - American Indian and Alaska Native
Geographical mobility - Moved from different county within same state (%) - Multirace
Geographical mobility - Moved from different county within same state (%) - Other Race
Geographical mobility - Moved from different state (%)
Geographical mobility - Moved from different state (%) - White
Geographical mobility - Moved from different state (%) - Black or African American
Geographical mobility - Moved from different state (%) - Asian
Geographical mobility - Moved from different state (%) - Hispanic or Latino
Geographical mobility - Moved from different state (%) - American Indian and Alaska Native
Geographical mobility - Moved from different state (%) - Multirace
Geographical mobility - Moved from different state (%) - Other Race
Geographical mobility - Moved from abroad (%)
Geographical mobility - Moved from abroad (%) - White
Geographical mobility - Moved from abroad (%) - Black or African American
Geographical mobility - Moved from abroad (%) - Asian
Geographical mobility - Moved from abroad (%) - Hispanic or Latino
Geographical mobility - Moved from abroad (%) - American Indian and Alaska Native
Geographical mobility - Moved from abroad (%) - Multirace
Geographical mobility - Moved from abroad (%) - Other Race
Place of birth for the foreign-born population - Ireland (%)
Place of birth for the foreign-born population - Denmark (%)
Place of birth for the foreign-born population - Norway (%)
Place of birth for the foreign-born population - Sweden (%)
Place of birth for the foreign-born population - United Kingdom (%)
Place of birth for the foreign-born population - England (%)
Place of birth for the foreign-born population - Scotland (%)
Place of birth for the foreign-born population - Other Northern Europe (%)
Place of birth for the foreign-born population - Austria (%)
Place of birth for the foreign-born population - Belgium (%)
Place of birth for the foreign-born population - France (%)
Place of birth for the foreign-born population - Germany (%)
Place of birth for the foreign-born population - Netherlands (%)
Place of birth for the foreign-born population - Switzerland (%)
Place of birth for the foreign-born population - Other Western Europe (%)
Place of birth for the foreign-born population - Greece (%)
Place of birth for the foreign-born population - Italy (%)
Place of birth for the foreign-born population - Portugal (%)
Place of birth for the foreign-born population - Spain (%)
Place of birth for the foreign-born population - Other Southern Europe (%)
Place of birth for the foreign-born population - Albania (%)
Place of birth for the foreign-born population - Belarus (%)
Place of birth for the foreign-born population - Bosnia and Herzegovina (%)
Place of birth for the foreign-born population - Bulgaria (%)
Place of birth for the foreign-born population - Croatia (%)
Place of birth for the foreign-born population - Czechoslovakia (%)
Place of birth for the foreign-born population - Hungary (%)
Place of birth for the foreign-born population - Latvia (%)
Place of birth for the foreign-born population - Lithuania (%)
Place of birth for the foreign-born population - North Macedonia (Macedonia) (%)
Place of birth for the foreign-born population - Moldova (%)
Place of birth for the foreign-born population - Poland (%)
Place of birth for the foreign-born population - Romania (%)
Place of birth for the foreign-born population - Russia (%)
Place of birth for the foreign-born population - Serbia (%)
Place of birth for the foreign-born population - Ukraine (%)
Place of birth for the foreign-born population - Other Eastern Europe (%)
Place of birth for the foreign-born population - China (%)
Place of birth for the foreign-born population - Hong Kong (%)
Place of birth for the foreign-born population - Taiwan (%)
Place of birth for the foreign-born population - Japan (%)
Place of birth for the foreign-born population - Korea (%)
Place of birth for the foreign-born population - Other Eastern Asia (%)
Place of birth for the foreign-born population - Afghanistan (%)
Place of birth for the foreign-born population - Bangladesh (%)
Place of birth for the foreign-born population - India (%)
Place of birth for the foreign-born population - Iran (%)
Place of birth for the foreign-born population - Kazakhstan (%)
Place of birth for the foreign-born population - Nepal (%)
Place of birth for the foreign-born population - Pakistan (%)
Place of birth for the foreign-born population - Sri Lanka (%)
Place of birth for the foreign-born population - Uzbekistan (%)
Place of birth for the foreign-born population - Other South Central Asia (%)
Place of birth for the foreign-born population - Burma (%)
Place of birth for the foreign-born population - Cambodia (%)
Place of birth for the foreign-born population - Indonesia (%)
Place of birth for the foreign-born population - Laos (%)
Place of birth for the foreign-born population - Malaysia (%)
Place of birth for the foreign-born population - Philippines (%)
Place of birth for the foreign-born population - Singapore (%)
Place of birth for the foreign-born population - Thailand (%)
Place of birth for the foreign-born population - Vietnam (%)
Place of birth for the foreign-born population - Other South Eastern Asia (%)
Place of birth for the foreign-born population - Armenia (%)
Place of birth for the foreign-born population - Iraq (%)
Place of birth for the foreign-born population - Israel (%)
Place of birth for the foreign-born population - Jordan (%)
Place of birth for the foreign-born population - Kuwait (%)
Place of birth for the foreign-born population - Lebanon (%)
Place of birth for the foreign-born population - Saudi Arabia (%)
Place of birth for the foreign-born population - Syria (%)
Place of birth for the foreign-born population - Turkey (%)
Place of birth for the foreign-born population - Yemen (%)
Place of birth for the foreign-born population - Other Western Asia (%)
Place of birth for the foreign-born population - Eritrea (%)
Place of birth for the foreign-born population - Ethiopia (%)
Place of birth for the foreign-born population - Kenya (%)
Place of birth for the foreign-born population - Somalia (%)
Place of birth for the foreign-born population - Uganda (%)
Place of birth for the foreign-born population - Zimbabwe (%)
Place of birth for the foreign-born population - Other Eastern Africa (%)
Place of birth for the foreign-born population - Cameroon (%)
Place of birth for the foreign-born population - Congo (%)
Place of birth for the foreign-born population - Democratic Republic of Congo (Zaire) (%)
Place of birth for the foreign-born population - Other Middle Africa (%)
Place of birth for the foreign-born population - Egypt (%)
Place of birth for the foreign-born population - Morocco (%)
Place of birth for the foreign-born population - Sudan (%)
Place of birth for the foreign-born population - Other Northern Africa (%)
Place of birth for the foreign-born population - South Africa (%)
Place of birth for the foreign-born population - Other Southern Africa (%)
Place of birth for the foreign-born population - Cabo Verde (%)
Place of birth for the foreign-born population - Ghana (%)
Place of birth for the foreign-born population - Liberia (%)
Place of birth for the foreign-born population - Nigeria (%)
Place of birth for the foreign-born population - Senegal (%)
Place of birth for the foreign-born population - Sierra Leone (%)
Place of birth for the foreign-born population - Other Western Africa (%)
Place of birth for the foreign-born population - Australia (%)
Place of birth for the foreign-born population - New Zealand (%)
Place of birth for the foreign-born population - Fiji (%)
Place of birth for the foreign-born population - Micronesia (%)
Place of birth for the foreign-born population - Bahamas (%)
Place of birth for the foreign-born population - Barbados (%)
Place of birth for the foreign-born population - Cuba (%)
Place of birth for the foreign-born population - Dominica (%)
Place of birth for the foreign-born population - Dominican Republic (%)
Place of birth for the foreign-born population - Grenada (%)
Place of birth for the foreign-born population - Haiti (%)
Place of birth for the foreign-born population - Jamaica (%)
Place of birth for the foreign-born population - St. Vincent and the Grenadines (%)
Place of birth for the foreign-born population - Trinidad and Tobago (%)
Place of birth for the foreign-born population - West Indies (%)
Place of birth for the foreign-born population - Other Caribbean (%)
Place of birth for the foreign-born population - Belize (%)
Place of birth for the foreign-born population - Costa Rica (%)
Place of birth for the foreign-born population - El Salvador (%)
Place of birth for the foreign-born population - Guatemala (%)
Place of birth for the foreign-born population - Honduras (%)
Place of birth for the foreign-born population - Mexico (%)
Place of birth for the foreign-born population - Nicaragua (%)
Place of birth for the foreign-born population - Panama (%)
Place of birth for the foreign-born population - Other Central America (%)
Place of birth for the foreign-born population - Argentina (%)
Place of birth for the foreign-born population - Bolivia (%)
Place of birth for the foreign-born population - Brazil (%)
Place of birth for the foreign-born population - Chile (%)
Place of birth for the foreign-born population - Colombia (%)
Place of birth for the foreign-born population - Ecuador (%)
Place of birth for the foreign-born population - Guyana (%)
Place of birth for the foreign-born population - Peru (%)
Place of birth for the foreign-born population - Uruguay (%)
Place of birth for the foreign-born population - Venezuela (%)
Place of birth for the foreign-born population - Other South America (%)
Place of birth for the foreign-born population - Canada (%)
Place of birth for the foreign-born population - Other Northern America (%)
Place of birth for the foreign-born population - Other (%)
Latest news about races in Warrensburg, MO collected exclusively by city-data.com from local newspapers, TV, and radio stations
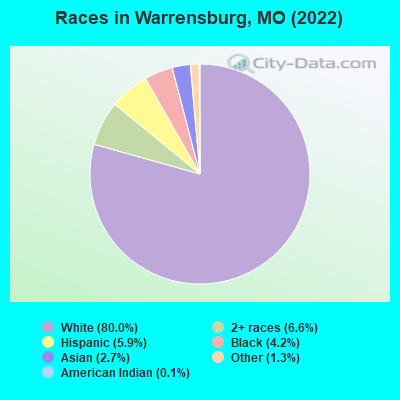
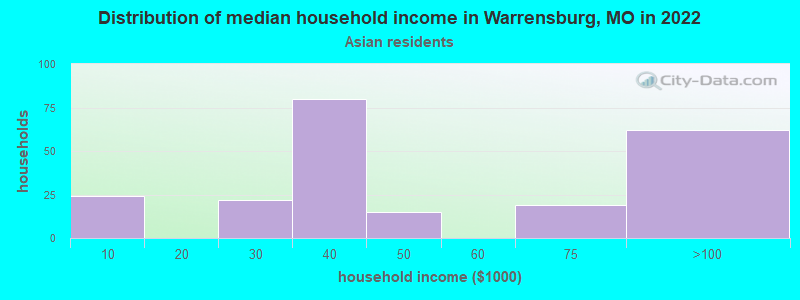
According to 2022 data, the most numerous races in Warrensburg, MO are White alone (15,517 residents), Black alone (819 residents), and Two or more races (1,286 residents). 94.5% of Warrensburg residents speak English at home. 2.6% of Warrensburg, MO residents are foreign-born (2.2% born in Asia), which is 56.4% less than the foreign-born rate of 4.0% across the entire state of Missouri.
Race distribution in Warrensburg
2000 2022
4,686,474 83.8% White alone 625,667 11.2% Black alone 118,592 2.1% Hispanic 71,905 1.3% Two or more races 61,041 1.1% Asian alone 23,302 0.4% American Indian alone 5,291 0.09% Other race alone 2,939 0.05% Native Hawaiian and Other
4,733,411 76.6% White alone 656,739 10.6% Black alone 316,300 5.1% Two or more races 291,763 4.7% Hispanic 132,436 2.1% Asian alone 27,467 0.4% Other race alone 12,313 0.2% American Indian alone 7,528 0.1% Native Hawaiian and Other
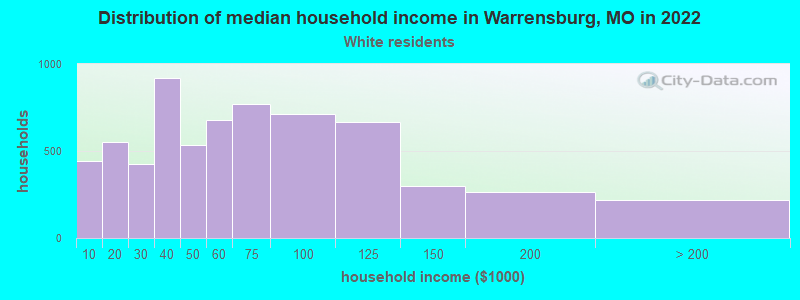
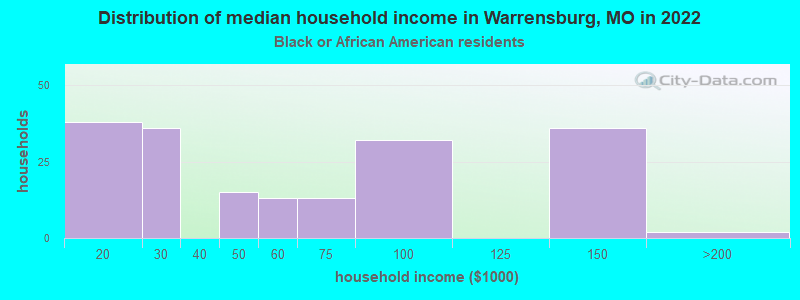
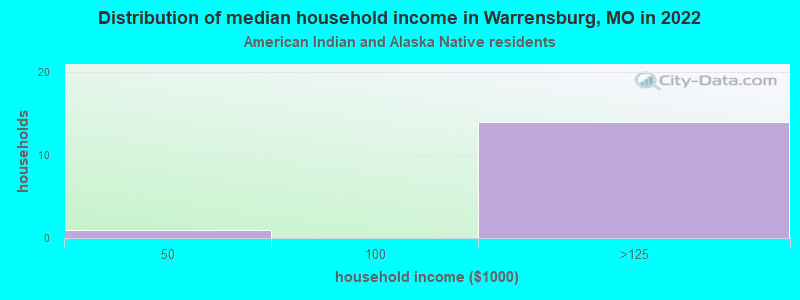
Income and house value in Warrensburg Median household income in 2022 $56,181 White non-Hispanic householders$47,862 Black householders$63,887 Two or more races householders$33,902 Hispanic or Latino race householdersMedian 2022 house value $219,366 White Non-Hispanic householders$98,798 Black or African American householders$203,338 American Indian or Alaska Native householders $294,721 Asian householders$203,338 Some other race householders$223,672 Two or more races householders$218,648 Hispanic or Latino householders
Median age by race in Warrensburg
25.0 Median age for White residents24.7 25.9 22.6 Median age for Black or African American residents22.3 22.7 16.9 Median age for American Indian / Alaska Native residents-652,291,104.5 15.9 24.9 Median age for Asian residents25.5 24.6 -693,430,656.2 Median age for Native Hawaiian / Pacific Islander residents-683,513,838.1 -752,136,751.4 49.5 Median age for Other race residents75.2 21.1 23.1 Median age for Two or more races residents23.1 23.5 25.0 Median age for White alone residents24.9 25.6 22.0 Median age for Hispanic or Latino residents21.8 21.7
Owner/renter occupied households by race in Warrensburg
House owners and renters - White residents 3,106 48.3% Owner occupied3,328 51.7% Renter occupiedHouse owners and renters - Black or African American residents 61 32.4% Owner occupied128 67.6% Renter occupiedHouse owners and renters - American Indian / Alaska Native residents 9 100.0% Owner occupiedHouse owners and renters - Asian residents 53 26.4% Owner occupied148 73.6% Renter occupiedHouse owners and renters - Other race residents 103 75.4% Owner occupied34 24.6% Renter occupiedHouse owners and renters - Two or more races residents 162 30.6% Owner occupied368 69.4% Renter occupiedHouse owners and renters - White alone residents 3,066 49.8% Owner occupied3,089 50.2% Renter occupiedHouse owners and renters - Hispanic or Latino residents 110 25.2% Owner occupied325 74.8% Renter occupied
Language usage in Warrensburg
English speakers - Total 94.5% of residents of Warrensburg speak English at home.
2.4% of residents speak Spanish at home 377 86.3% Speak English very well60 13.7% Speak English less than very well3.1% of residents speak other language at home 359 63.2% Speak English very well209 36.8% Speak English less than very well
English speakers - Born in the United States 94.7% of residents of Warrensburg speak English at home.
3.7% of residents speak Spanish at home 268 100.0% Speak English very well1.6% of residents speak other language at home 73 62.4% Speak English very well44 37.6% Speak English less than very well
English speakers - Native, born elsewhere 95.6% of residents of Warrensburg speak English at home.
5.9% of residents speak Spanish at home 16 100.0% Speak English less than very well
English speakers - Foreign-born 19.1% of residents of Warrensburg speak English at home.
6.4% of residents speak Spanish at home 32 100.0% Speak English less than very well74.2% of residents speak other language at home 225 61.0% Speak English very well144 39.0% Speak English less than very well
White (Caucasian) - Speak only English Native:
97.9% (14,960)Foreign-born:
20.7% (15)
White (Caucasian) - Speak another language Native:
2.1% (318)Foreign-born:
79.0% (56)
Black or African American - Speak only English Native:
95.4% (764)Foreign-born:
42.6% (16)
Black or African American - Speak another language Native:
5.5% (44)Foreign-born:
57.6% (22)
Asian - Speak only English Native:
85.1% (158)Foreign-born:
18.4% (63)
Asian - Speak another language Native:
20.7% (38)Foreign-born:
81.5% (277)
Other race - Speak only English Native:
100.0% (286)Foreign-born:
100.0% (6)
Two or more races - Speak another language Native:
13.6% (219)Foreign-born:
100.0% (49)
White alone - Speak only English Native:
98.9% (14,598)Foreign-born:
17.7% (15)
White alone - Speak another language Native:
1.1% (161)Foreign-born:
85.3% (72)
Hispanic or Latino - Speak another language Native:
30.1% (305)Foreign-born:
99.4% (32)
Foreign-born residents in Warrensburg 496 residents are foreign born (2.2% Asia ).
This city:
2.6%Missouri:
4.2%
Marital status for residents in Warrensburg Marital status - White (Caucasian) population 15 years and over
Males 53.5% Never married35.3% Now married1.5% Separated2.6% Widowed7.2% DivorcedFemales 44.9% Never married31.8% Now married0.9% Separated10.2% Widowed12.3% DivorcedWomen who gave birth in the past 12 months Now married:
69.8% (109)Unmarried:
30.2% (47)
Women who did not give birth in the past 12 months Now married:
29.1% (1,374)Unmarried:
70.9% (3,355)
Marital status - Black or African American population 15 years and over
Males 74.6% Never married16.3% Now married0.5% Separated4.5% Widowed4.0% DivorcedFemales 69.4% Never married19.4% Now married0.0% Separated3.0% Widowed8.1% DivorcedWomen who did not give birth in the past 12 months Now married:
16.6% (59)Unmarried:
83.4% (297)
Marital status - American Indian / Alaska Native population 15 years and over
Males 0.0% Never married12.5% Now married0.0% Separated0.0% Widowed87.5% DivorcedFemales 100.0% Never married0.0% Now married0.0% Separated0.0% Widowed0.0% DivorcedWomen who did not give birth in the past 12 months Now married:
0.0% (0)Unmarried:
100.0% (17)
Marital status - Asian population 15 years and over
Males 84.5% Never married8.8% Now married0.0% Separated0.0% Widowed6.7% DivorcedFemales 67.6% Never married27.4% Now married0.0% Separated0.0% Widowed5.0% DivorcedWomen who did not give birth in the past 12 months Now married:
7.3% (10)Unmarried:
92.7% (124)
Marital status - Other race population 15 years and over
Males 64.8% Never married35.2% Now married0.0% Separated0.0% Widowed0.0% DivorcedFemales 61.5% Never married38.5% Now married0.0% Separated0.0% Widowed0.0% DivorcedWomen who did not give birth in the past 12 months Now married:
38.5% (36)Unmarried:
61.5% (58)
Marital status - Two or more races population 15 years and over
Males 69.2% Never married27.6% Now married0.0% Separated0.0% Widowed3.1% DivorcedFemales 56.3% Never married26.5% Now married0.0% Separated3.8% Widowed13.4% DivorcedWomen who gave birth in the past 12 months Now married:
17.9% (14)Unmarried:
82.1% (64)
Women who did not give birth in the past 12 months Now married:
21.9% (97)Unmarried:
78.1% (344)
Marital status - White alone, not Hispanic / Latino population 15 years and over
Males 52.3% Never married35.9% Now married1.6% Separated2.7% Widowed7.5% DivorcedFemales 45.1% Never married32.1% Now married0.9% Separated10.5% Widowed11.3% DivorcedWomen who gave birth in the past 12 months Now married:
69.8% (110)Unmarried:
30.2% (47)
Women who did not give birth in the past 12 months Now married:
28.8% (1,341)Unmarried:
71.2% (3,324)
Marital status - Hispanic or Latino population 15 years and over
Males 84.0% Never married16.0% Now married0.0% Separated0.0% Widowed0.0% DivorcedFemales 53.8% Never married18.6% Now married0.0% Separated0.0% Widowed27.6% DivorcedWomen who gave birth in the past 12 months Now married:
0.0% (0)Unmarried:
100.0% (50)
Women who did not give birth in the past 12 months Now married:
23.6% (60)Unmarried:
76.4% (195)
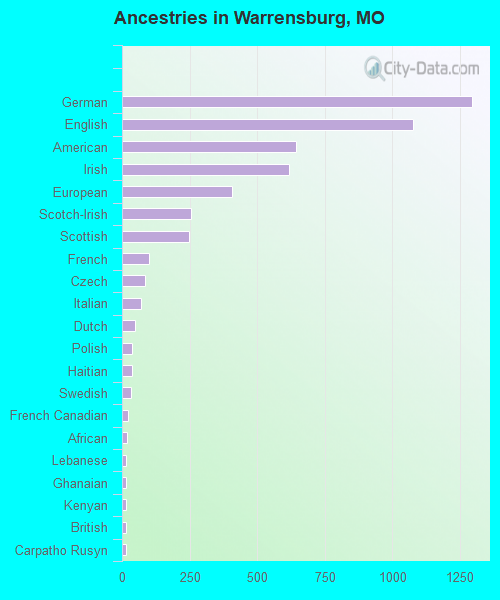
Ancestries in Warrensburg
1,294 17.5% German1,079 14.6% English644 8.7% American619 8.4% Irish406 5.5% European255 3.4% Scotch-Irish247 3.3% Scottish100 1.4% French84 1.1% Czech71 1.0% Italian48 0.6% Dutch37 0.5% Polish36 0.5% Haitian34 0.5% Swedish21 0.3% French Canadian17 0.2% African15 0.2% Lebanese15 0.2% Ghanaian15 0.2% Kenyan14 0.2% British14 0.2% Carpatho Rusyn7 0.09% Bulgarian7 0.09% Jamaican6 0.08% Norwegian6 0.08% Welsh3 0.04% Eastern European
Geographical mobility in Warrensburg Same house 1 year ago 10,605 66.7% White (Caucasian)373 44.8% Black or African American12 40.6% American Indian / Alaska Native196 37.4% Asian123 40.8% Other race1,213 65.9% Two or more races10,255 66.7% White alone, not Hispanic / Latino743 64.9% Hispanic or LatinoMoved within same county 2,179 13.7% White / Caucasian97 11.6% Black or African American1 3.4% American Indian / Alaska Native115 21.9% Asian89 29.4% Other race139 7.5% Two or more races2,140 13.9% White alone, not Hispanic / Latino107 9.3% Hispanic or LatinoMoved within same state 2,183 13.7% White / Caucasian301 36.1% Black or African American19 65.8% American Indian / Alaska Native97 18.6% Asian59 19.5% Other race301 16.3% Two or more races2,148 14.0% White alone, not Hispanic / Latino155 13.5% Hispanic or LatinoMoved from different state 788 5.0% White / Caucasian49 5.9% Black or African American8 1.5% Asian48 2.6% Two or more races684 4.4% White alone, not Hispanic / Latino165 14.4% Hispanic or LatinoMoved from abroad 70 13.4% Asian149 8.1% Two or more races
Children Nativity (place of birth) in Warrensburg
Children under 6 years - Living with two parents Both parents native 711 100.0% NativeOne native, one foreign-born parent 11 100.0% NativeChildren under 6 years - Living with one parent Native parent 334 100.0% Native
Children 6 to 17 years - Living with two parents Both parents native 1,454 98.5% Native23 1.5% Foreign-bornChildren 6 to 17 years - Living with one parent Native parent 600 100.0% Native
Grandparents responsible for own grandchildren in Warrensburg
Grandparents (30 to 59 years) White / Caucasian 40 32.4% Responsible for grandchildren84 67.6% Not responsible for grandchildrenWhite alone, not Hispanic / Latino 41 32.3% Responsible for grandchildren85 67.7% Not responsible for grandchildrenGrandparents (60 years and over) White / Caucasian 27 73.7% Responsible for grandchildren10 26.3% Not responsible for grandchildrenWhite alone, not Hispanic / Latino 27 100.0% Responsible for grandchildren