Races in South Bradley, Tennessee (TN) Detailed Stats
Ancestries, Foreign-born residents, place of birth
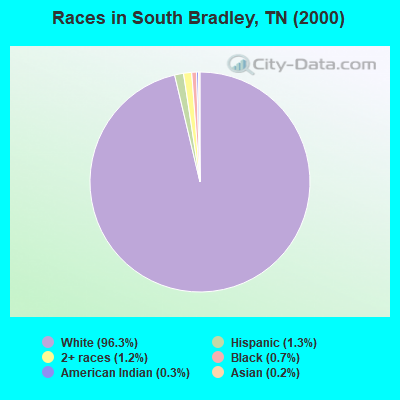
Race distribution in South Bradley

- 6,43796.3%White alone
- 841.3%Hispanic
- 801.2%Two or more races
- 460.7%Black alone
- 210.3%American Indian alone
- 110.2%Asian alone
- 60.09%Other race alone
2000
2022
-
- 4,505,93079.2%White alone
- 928,20416.3%Black alone
- 123,8382.2%Hispanic
- 54,8241.0%Two or more races
- 56,0771.0%Asian alone
- 13,8200.2%American Indian alone
- 4,7800.08%Other race alone
- 1,8100.03%Native Hawaiian and Other
Pacific Islander alone

-
- 5,070,02671.9%White alone
- 1,089,73815.5%Black alone
- 442,6296.3%Hispanic
- 279,3814.0%Two or more races
- 131,8171.9%Asian alone
- 26,9720.4%Other race alone
- 6,3870.09%American Indian alone
- 4,3890.06%Native Hawaiian and Other
Pacific Islander alone

Income and house value in South Bradley
- Median household income in 2022
- $75,839White non-Hispanic householders
- $46,225Black householders
- $78,182Some other race householders
- $50,776Two or more races householders
- $92,040Hispanic or Latino race householders
- Median 2022 house value
- $275,408White Non-Hispanic householders
- $124,807Some other race householders
- $109,275Two or more races householders
- $194,144Hispanic or Latino householders
Household income for White non-Hispanic householders

Household income for Black householders

Household income for American Indian and Alaska Native householders

Household income for Two or more races householders

Household income for Hispanic or Latino race householders

Zip code: 37311