Races in San Antonio, Texas (TX) Detailed Stats
Data:
Races - White alone (%)
Races - White alone (% change since 2000)
Races - Black alone (%)
Races - Black alone (% change since 2000)
Races - American Indian alone (%)
Races - American Indian alone (% change since 2000)
Races - Asian alone (%)
Races - Asian alone (% change since 2000)
Races - Hispanic (%)
Races - Hispanic (% change since 2000)
Races - Native Hawaiian and Other Pacific Islander alone (%)
Races - Native Hawaiian and Other Pacific Islander alone (% change since 2000)
Races - Two or more races(%)
Races - Two or more races(% change since 2000)
Races - Other race alone (%)
Races - Other race alone (% change since 2000)
Racial diversity
Place of birth - Born in state of residence (%)
Place of birth - Born in state of residence (%) - White
Place of birth - Born in state of residence (%) - Black or African American
Place of birth - Born in state of residence (%) - Asian
Place of birth - Born in state of residence (%) - Hispanic or Latino
Place of birth - Born in state of residence (%) - American Indian and Alaska Native
Place of birth - Born in state of residence (%) - Multirace
Place of birth - Born in state of residence (%) - Other Race
Place of birth - Born in other state (%)
Place of birth - Born in other state (%) - White
Place of birth - Born in other state (%) - Black or African American
Place of birth - Born in other state (%) - Asian
Place of birth - Born in other state (%) - Hispanic or Latino
Place of birth - Born in other state (%) - American Indian and Alaska Native
Place of birth - Born in other state (%) - Multirace
Place of birth - Born in other state (%) - Other Race
Place of birth - Native, outside of US (%)
Place of birth - Native, outside of US (%) - White
Place of birth - Native, outside of US (%) - Black or African American
Place of birth - Native, outside of US (%) - Asian
Place of birth - Native, outside of US (%) - Hispanic or Latino
Place of birth - Native, outside of US (%) - American Indian and Alaska Native
Place of birth - Native, outside of US (%) - Multirace
Place of birth - Native, outside of US (%) - Other Race
Place of birth - Foreign born (%)
Place of birth - Foreign born (%) - White
Place of birth - Foreign born (%) - Black or African American
Place of birth - Foreign born (%) - Asian
Place of birth - Foreign born (%) - Hispanic or Latino
Place of birth - Foreign born (%) - American Indian and Alaska Native
Place of birth - Foreign born (%) - Multirace
Place of birth - Foreign born (%) - Other Race
Residents speaking English at home (%)
Residents speaking English at home - Born in the United States (%)
Residents speaking English at home - Native, born elsewhere (%)
Residents speaking English at home - Foreign born (%)
Residents speaking Spanish at home (%)
Residents speaking Spanish at home - Born in the United States (%)
Residents speaking Spanish at home - Native, born elsewhere (%)
Residents speaking Spanish at home - Foreign born (%)
Residents speaking other language at home (%)
Residents speaking other language at home - Born in the United States (%)
Residents speaking other language at home - Native, born elsewhere (%)
Residents speaking other language at home - Foreign born (%)
Marital status - Never married (%)
Marital status - Now married (%)
Marital status - Separated (%)
Marital status - Widowed (%)
Marital status - Divorced (%)
Ancestries Reported - Arab (%)
Ancestries Reported - Czech (%)
Ancestries Reported - Danish (%)
Ancestries Reported - Dutch (%)
Ancestries Reported - English (%)
Ancestries Reported - French (%)
Ancestries Reported - French Canadian (%)
Ancestries Reported - German (%)
Ancestries Reported - Greek (%)
Ancestries Reported - Hungarian (%)
Ancestries Reported - Irish (%)
Ancestries Reported - Italian (%)
Ancestries Reported - Lithuanian (%)
Ancestries Reported - Norwegian (%)
Ancestries Reported - Polish (%)
Ancestries Reported - Portuguese (%)
Ancestries Reported - Russian (%)
Ancestries Reported - Scotch-Irish (%)
Ancestries Reported - Scottish (%)
Ancestries Reported - Slovak (%)
Ancestries Reported - Subsaharan African (%)
Ancestries Reported - Swedish (%)
Ancestries Reported - Swiss (%)
Ancestries Reported - Ukrainian (%)
Ancestries Reported - United States (%)
Ancestries Reported - Welsh (%)
Ancestries Reported - West Indian (%)
Ancestries Reported - Other (%)
Geographical mobility - Same house 1 year ago (%)
Geographical mobility - Same house 1 year ago (%) - White
Geographical mobility - Same house 1 year ago (%) - Black or African American
Geographical mobility - Same house 1 year ago (%) - Asian
Geographical mobility - Same house 1 year ago (%) - Hispanic or Latino
Geographical mobility - Same house 1 year ago (%) - American Indian and Alaska Native
Geographical mobility - Same house 1 year ago (%) - Multirace
Geographical mobility - Same house 1 year ago (%) - Other Race
Geographical mobility - Moved within same county (%)
Geographical mobility - Moved within same county (%) - White
Geographical mobility - Moved within same county (%) - Black or African American
Geographical mobility - Moved within same county (%) - Asian
Geographical mobility - Moved within same county (%) - Hispanic or Latino
Geographical mobility - Moved within same county (%) - American Indian and Alaska Native
Geographical mobility - Moved within same county (%) - Multirace
Geographical mobility - Moved within same county (%) - Other Race
Geographical mobility - Moved from different county within same state (%)
Geographical mobility - Moved from different county within same state (%) - White
Geographical mobility - Moved from different county within same state (%) - Black or African American
Geographical mobility - Moved from different county within same state (%) - Asian
Geographical mobility - Moved from different county within same state (%) - Hispanic or Latino
Geographical mobility - Moved from different county within same state (%) - American Indian and Alaska Native
Geographical mobility - Moved from different county within same state (%) - Multirace
Geographical mobility - Moved from different county within same state (%) - Other Race
Geographical mobility - Moved from different state (%)
Geographical mobility - Moved from different state (%) - White
Geographical mobility - Moved from different state (%) - Black or African American
Geographical mobility - Moved from different state (%) - Asian
Geographical mobility - Moved from different state (%) - Hispanic or Latino
Geographical mobility - Moved from different state (%) - American Indian and Alaska Native
Geographical mobility - Moved from different state (%) - Multirace
Geographical mobility - Moved from different state (%) - Other Race
Geographical mobility - Moved from abroad (%)
Geographical mobility - Moved from abroad (%) - White
Geographical mobility - Moved from abroad (%) - Black or African American
Geographical mobility - Moved from abroad (%) - Asian
Geographical mobility - Moved from abroad (%) - Hispanic or Latino
Geographical mobility - Moved from abroad (%) - American Indian and Alaska Native
Geographical mobility - Moved from abroad (%) - Multirace
Geographical mobility - Moved from abroad (%) - Other Race
Place of birth for the foreign-born population - Ireland (%)
Place of birth for the foreign-born population - Denmark (%)
Place of birth for the foreign-born population - Norway (%)
Place of birth for the foreign-born population - Sweden (%)
Place of birth for the foreign-born population - United Kingdom (%)
Place of birth for the foreign-born population - England (%)
Place of birth for the foreign-born population - Scotland (%)
Place of birth for the foreign-born population - Other Northern Europe (%)
Place of birth for the foreign-born population - Austria (%)
Place of birth for the foreign-born population - Belgium (%)
Place of birth for the foreign-born population - France (%)
Place of birth for the foreign-born population - Germany (%)
Place of birth for the foreign-born population - Netherlands (%)
Place of birth for the foreign-born population - Switzerland (%)
Place of birth for the foreign-born population - Other Western Europe (%)
Place of birth for the foreign-born population - Greece (%)
Place of birth for the foreign-born population - Italy (%)
Place of birth for the foreign-born population - Portugal (%)
Place of birth for the foreign-born population - Spain (%)
Place of birth for the foreign-born population - Other Southern Europe (%)
Place of birth for the foreign-born population - Albania (%)
Place of birth for the foreign-born population - Belarus (%)
Place of birth for the foreign-born population - Bosnia and Herzegovina (%)
Place of birth for the foreign-born population - Bulgaria (%)
Place of birth for the foreign-born population - Croatia (%)
Place of birth for the foreign-born population - Czechoslovakia (%)
Place of birth for the foreign-born population - Hungary (%)
Place of birth for the foreign-born population - Latvia (%)
Place of birth for the foreign-born population - Lithuania (%)
Place of birth for the foreign-born population - North Macedonia (Macedonia) (%)
Place of birth for the foreign-born population - Moldova (%)
Place of birth for the foreign-born population - Poland (%)
Place of birth for the foreign-born population - Romania (%)
Place of birth for the foreign-born population - Russia (%)
Place of birth for the foreign-born population - Serbia (%)
Place of birth for the foreign-born population - Ukraine (%)
Place of birth for the foreign-born population - Other Eastern Europe (%)
Place of birth for the foreign-born population - China (%)
Place of birth for the foreign-born population - Hong Kong (%)
Place of birth for the foreign-born population - Taiwan (%)
Place of birth for the foreign-born population - Japan (%)
Place of birth for the foreign-born population - Korea (%)
Place of birth for the foreign-born population - Other Eastern Asia (%)
Place of birth for the foreign-born population - Afghanistan (%)
Place of birth for the foreign-born population - Bangladesh (%)
Place of birth for the foreign-born population - India (%)
Place of birth for the foreign-born population - Iran (%)
Place of birth for the foreign-born population - Kazakhstan (%)
Place of birth for the foreign-born population - Nepal (%)
Place of birth for the foreign-born population - Pakistan (%)
Place of birth for the foreign-born population - Sri Lanka (%)
Place of birth for the foreign-born population - Uzbekistan (%)
Place of birth for the foreign-born population - Other South Central Asia (%)
Place of birth for the foreign-born population - Burma (%)
Place of birth for the foreign-born population - Cambodia (%)
Place of birth for the foreign-born population - Indonesia (%)
Place of birth for the foreign-born population - Laos (%)
Place of birth for the foreign-born population - Malaysia (%)
Place of birth for the foreign-born population - Philippines (%)
Place of birth for the foreign-born population - Singapore (%)
Place of birth for the foreign-born population - Thailand (%)
Place of birth for the foreign-born population - Vietnam (%)
Place of birth for the foreign-born population - Other South Eastern Asia (%)
Place of birth for the foreign-born population - Armenia (%)
Place of birth for the foreign-born population - Iraq (%)
Place of birth for the foreign-born population - Israel (%)
Place of birth for the foreign-born population - Jordan (%)
Place of birth for the foreign-born population - Kuwait (%)
Place of birth for the foreign-born population - Lebanon (%)
Place of birth for the foreign-born population - Saudi Arabia (%)
Place of birth for the foreign-born population - Syria (%)
Place of birth for the foreign-born population - Turkey (%)
Place of birth for the foreign-born population - Yemen (%)
Place of birth for the foreign-born population - Other Western Asia (%)
Place of birth for the foreign-born population - Eritrea (%)
Place of birth for the foreign-born population - Ethiopia (%)
Place of birth for the foreign-born population - Kenya (%)
Place of birth for the foreign-born population - Somalia (%)
Place of birth for the foreign-born population - Uganda (%)
Place of birth for the foreign-born population - Zimbabwe (%)
Place of birth for the foreign-born population - Other Eastern Africa (%)
Place of birth for the foreign-born population - Cameroon (%)
Place of birth for the foreign-born population - Congo (%)
Place of birth for the foreign-born population - Democratic Republic of Congo (Zaire) (%)
Place of birth for the foreign-born population - Other Middle Africa (%)
Place of birth for the foreign-born population - Egypt (%)
Place of birth for the foreign-born population - Morocco (%)
Place of birth for the foreign-born population - Sudan (%)
Place of birth for the foreign-born population - Other Northern Africa (%)
Place of birth for the foreign-born population - South Africa (%)
Place of birth for the foreign-born population - Other Southern Africa (%)
Place of birth for the foreign-born population - Cabo Verde (%)
Place of birth for the foreign-born population - Ghana (%)
Place of birth for the foreign-born population - Liberia (%)
Place of birth for the foreign-born population - Nigeria (%)
Place of birth for the foreign-born population - Senegal (%)
Place of birth for the foreign-born population - Sierra Leone (%)
Place of birth for the foreign-born population - Other Western Africa (%)
Place of birth for the foreign-born population - Australia (%)
Place of birth for the foreign-born population - New Zealand (%)
Place of birth for the foreign-born population - Fiji (%)
Place of birth for the foreign-born population - Micronesia (%)
Place of birth for the foreign-born population - Bahamas (%)
Place of birth for the foreign-born population - Barbados (%)
Place of birth for the foreign-born population - Cuba (%)
Place of birth for the foreign-born population - Dominica (%)
Place of birth for the foreign-born population - Dominican Republic (%)
Place of birth for the foreign-born population - Grenada (%)
Place of birth for the foreign-born population - Haiti (%)
Place of birth for the foreign-born population - Jamaica (%)
Place of birth for the foreign-born population - St. Vincent and the Grenadines (%)
Place of birth for the foreign-born population - Trinidad and Tobago (%)
Place of birth for the foreign-born population - West Indies (%)
Place of birth for the foreign-born population - Other Caribbean (%)
Place of birth for the foreign-born population - Belize (%)
Place of birth for the foreign-born population - Costa Rica (%)
Place of birth for the foreign-born population - El Salvador (%)
Place of birth for the foreign-born population - Guatemala (%)
Place of birth for the foreign-born population - Honduras (%)
Place of birth for the foreign-born population - Mexico (%)
Place of birth for the foreign-born population - Nicaragua (%)
Place of birth for the foreign-born population - Panama (%)
Place of birth for the foreign-born population - Other Central America (%)
Place of birth for the foreign-born population - Argentina (%)
Place of birth for the foreign-born population - Bolivia (%)
Place of birth for the foreign-born population - Brazil (%)
Place of birth for the foreign-born population - Chile (%)
Place of birth for the foreign-born population - Colombia (%)
Place of birth for the foreign-born population - Ecuador (%)
Place of birth for the foreign-born population - Guyana (%)
Place of birth for the foreign-born population - Peru (%)
Place of birth for the foreign-born population - Uruguay (%)
Place of birth for the foreign-born population - Venezuela (%)
Place of birth for the foreign-born population - Other South America (%)
Place of birth for the foreign-born population - Canada (%)
Place of birth for the foreign-born population - Other Northern America (%)
Place of birth for the foreign-born population - Other (%)
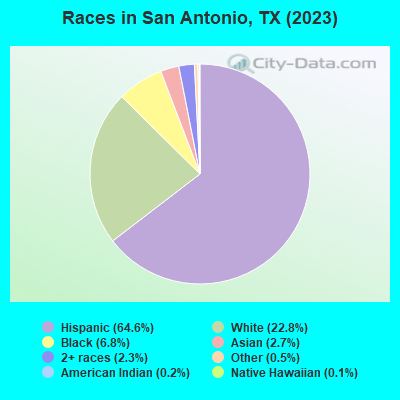
According to 2022 data, the most numerous races in San Antonio, TX are Hispanic (969,179 residents), White alone (320,944 residents), and Black alone (92,792 residents). 59.3% of San Antonio residents speak English at home. 14.4% of San Antonio, TX residents are foreign-born (10.6% born in Latin America, 2.6% born in Asia), which is 17.7% less than the foreign-born rate of 17.0% across the entire state of Texas.
Race distribution in San Antonio
2000 2022
671,394 58.7% Hispanic 364,357 31.8% White alone 74,778 6.5% Black alone 17,084 1.5% Asian alone 12,521 1.1% Two or more races 2,666 0.2% American Indian alone 1,182 0.1% Other race alone 664 0.06% Native Hawaiian and Other
969,179 65.8% Hispanic 320,944 21.8% White alone 92,792 6.3% Black alone 44,473 3.0% Asian alone 35,470 2.4% Two or more races 7,620 0.5% Other race alone 1,575 0.1% Native Hawaiian and Other 851 0.06% American Indian alone
2000 2022
10,933,313 52.4% White alone 6,669,666 32.0% Hispanic 2,364,255 11.3% Black alone 554,445 2.7% Asian alone 230,567 1.1% Two or more races 68,859 0.3% American Indian alone 19,958 0.10% Other race alone 10,757 0.05% Native Hawaiian and Other
12,070,642 40.2% Hispanic 11,683,430 38.9% White alone 3,508,706 11.7% Black alone 1,608,173 5.4% Asian alone 956,560 3.2% Two or more races 125,763 0.4% Other race alone 47,023 0.2% American Indian alone 29,275 0.10% Native Hawaiian and Other
Income and house value in San Antonio Median household income in 2022 $76,944 White non-Hispanic householders$43,039 Black householders$50,101 American Indian and Alaska Native householders$71,135 Asian householders$61,059 Native Hawaiian and other Pacific Islander householders$53,695 Some other race householders$55,257 Two or more races householders$53,282 Hispanic or Latino race householdersMedian 2022 house value $313,410 White Non-Hispanic householders$208,826 Black or African American householders$205,750 American Indian or Alaska Native householders $306,916 Asian householders$248,130 Native Hawaiian and other Pacific Islander householders$167,471 Some other race householders$203,357 Two or more races householders$178,066 Hispanic or Latino householders
Median age by race in San Antonio
35.3 Median age for White residents33.9 36.7 31.5 Median age for Black or African American residents30.9 32.0 33.4 Median age for American Indian / Alaska Native residents32.6 34.0 33.8 Median age for Asian residents31.8 35.1 31.4 Median age for Native Hawaiian / Pacific Islander residents28.9 45.7 36.4 Median age for Other race residents36.2 36.9 32.9 Median age for Two or more races residents31.8 33.7 41.3 Median age for White alone residents39.4 43.7 32.2 Median age for Hispanic or Latino residents31.4 33.1
Owner/renter occupied households by race in San Antonio
House owners and renters - White residents 136,374 55.5% Owner occupied109,386 44.5% Renter occupiedHouse owners and renters - Black or African American residents 11,152 27.9% Owner occupied28,785 72.1% Renter occupiedHouse owners and renters - American Indian / Alaska Native residents 2,921 41.6% Owner occupied4,109 58.4% Renter occupiedHouse owners and renters - Asian residents 7,518 45.5% Owner occupied9,015 54.5% Renter occupiedHouse owners and renters - Native Hawaiian / Pacific Islander residents 232 23.1% Owner occupied772 76.9% Renter occupiedHouse owners and renters - Other race residents 30,151 49.2% Owner occupied31,077 50.8% Renter occupiedHouse owners and renters - Two or more races residents 100,887 54.3% Owner occupied84,739 45.7% Renter occupiedHouse owners and renters - White alone residents 89,270 58.6% Owner occupied63,133 41.4% Renter occupiedHouse owners and renters - Hispanic or Latino residents 174,995 52.1% Owner occupied161,089 47.9% Renter occupied
Language usage in San Antonio
English speakers - Total 59.3% of residents of San Antonio speak English at home.
36.8% of residents speak Spanish at home 349,070 68.8% Speak English very well158,402 31.2% Speak English less than very well3.9% of residents speak other language at home 31,995 59.6% Speak English very well21,714 40.4% Speak English less than very well
English speakers - Born in the United States 84.9% of residents of San Antonio speak English at home.
13.6% of residents speak Spanish at home 31,784 85.8% Speak English very well5,244 14.2% Speak English less than very well1.5% of residents speak other language at home 3,580 85.4% Speak English very well612 14.6% Speak English less than very well
English speakers - Native, born elsewhere 51.3% of residents of San Antonio speak English at home.
39.1% of residents speak Spanish at home 9,718 73.1% Speak English very well3,579 26.9% Speak English less than very well9.6% of residents speak other language at home 3,144 95.9% Speak English very well136 4.1% Speak English less than very well
English speakers - Foreign-born 10.9% of residents of San Antonio speak English at home.
68.9% of residents speak Spanish at home 47,913 33.1% Speak English very well96,628 66.9% Speak English less than very well20.2% of residents speak other language at home 22,175 52.3% Speak English very well20,242 47.7% Speak English less than very well
White (Caucasian) - Speak only English Native:
80.0% (413,698)Foreign-born:
18.2% (6,669)
White (Caucasian) - Speak another language Native:
20.0% (103,672)Foreign-born:
81.8% (29,961)
Black or African American - Speak only English Native:
94.9% (81,788)Foreign-born:
35.3% (1,973)
Black or African American - Speak another language Native:
5.1% (4,421)Foreign-born:
64.7% (3,617)
American Indian / Alaska Native - Speak only English Native:
52.1% (7,217)Foreign-born:
3.0% (85)
American Indian / Alaska Native - Speak another language Native:
47.9% (6,627)Foreign-born:
97.0% (2,733)
Asian - Speak only English Native:
60.5% (5,868)Foreign-born:
17.7% (5,851)
Asian - Speak another language Native:
39.5% (3,827)Foreign-born:
82.3% (27,128)
Native Hawaiian / Pacific Islander - Speak only English Native:
75.5% (1,180)Foreign-born:
21.0% (44)
Native Hawaiian / Pacific Islander - Speak another language Native:
24.5% (384)Foreign-born:
69.5% (147)
Other race - Speak only English Native:
48.7% (66,490)Foreign-born:
5.5% (2,123)
Other race - Speak another language Native:
51.3% (69,977)Foreign-born:
94.5% (36,825)
Two or more races - Speak only English Native:
54.2% (219,083)Foreign-born:
6.7% (6,193)
Two or more races - Speak another language Native:
45.8% (185,069)Foreign-born:
93.3% (86,694)
White alone - Speak only English Native:
95.5% (279,481)Foreign-born:
35.1% (5,696)
White alone - Speak another language Native:
4.5% (13,287)Foreign-born:
64.9% (10,535)
Hispanic or Latino - Speak only English Native:
53.1% (398,040)Foreign-born:
5.4% (8,270)
Hispanic or Latino - Speak another language Native:
46.9% (351,905)Foreign-born:
94.6% (144,684)
Foreign-born residents in San Antonio 213,536 residents are foreign born (10.6% Latin America , 2.6% Asia ).
This city:
14.4%Texas:
17.1%
Marital status for residents in San Antonio Marital status - White (Caucasian) population 15 years and over
Males 41.8% Never married44.6% Now married1.4% Separated2.0% Widowed10.2% DivorcedFemales 33.7% Never married41.6% Now married2.0% Separated8.0% Widowed14.6% DivorcedWomen who gave birth in the past 12 months Now married:
62.5% (7,196)Unmarried:
37.5% (4,321)
Women who did not give birth in the past 12 months Now married:
37.3% (48,598)Unmarried:
62.7% (81,610)
Marital status - Black or African American population 15 years and over
Males 53.9% Never married31.2% Now married2.8% Separated2.9% Widowed9.2% DivorcedFemales 50.4% Never married25.1% Now married3.4% Separated6.8% Widowed14.3% DivorcedWomen who gave birth in the past 12 months Now married:
29.5% (291)Unmarried:
70.5% (697)
Women who did not give birth in the past 12 months Now married:
21.4% (5,218)Unmarried:
78.6% (19,128)
Marital status - American Indian / Alaska Native population 15 years and over
Males 58.9% Never married28.6% Now married5.6% Separated0.0% Widowed7.0% DivorcedFemales 41.4% Never married35.1% Now married0.6% Separated6.5% Widowed16.4% DivorcedWomen who gave birth in the past 12 months Now married:
11.8% (9)Unmarried:
88.2% (65)
Women who did not give birth in the past 12 months Now married:
34.9% (1,692)Unmarried:
65.1% (3,153)
Marital status - Asian population 15 years and over
Males 41.0% Never married53.7% Now married0.0% Separated1.6% Widowed3.7% DivorcedFemales 29.1% Never married52.1% Now married2.5% Separated9.4% Widowed7.0% DivorcedWomen who gave birth in the past 12 months Now married:
100.0% (1,155)Unmarried:
0.0% (0)
Women who did not give birth in the past 12 months Now married:
50.1% (5,609)Unmarried:
49.9% (5,584)
Marital status - Native Hawaiian / Pacific Islander population 15 years and over
Males 27.3% Never married49.9% Now married0.0% Separated0.0% Widowed22.8% DivorcedFemales 31.3% Never married57.3% Now married2.4% Separated1.9% Widowed7.1% DivorcedWomen who did not give birth in the past 12 months Now married:
42.6% (178)Unmarried:
57.4% (240)
Marital status - Other race population 15 years and over
Males 49.5% Never married34.4% Now married2.7% Separated3.7% Widowed9.7% DivorcedFemales 41.0% Never married37.0% Now married4.0% Separated8.5% Widowed9.5% DivorcedWomen who gave birth in the past 12 months Now married:
67.7% (1,568)Unmarried:
32.3% (747)
Women who did not give birth in the past 12 months Now married:
36.6% (16,872)Unmarried:
63.4% (29,190)
Marital status - Two or more races population 15 years and over
Males 42.6% Never married42.0% Now married4.1% Separated2.1% Widowed9.3% DivorcedFemales 38.9% Never married37.3% Now married3.5% Separated7.8% Widowed12.5% DivorcedWomen who gave birth in the past 12 months Now married:
57.7% (3,364)Unmarried:
42.3% (2,469)
Women who did not give birth in the past 12 months Now married:
34.2% (47,188)Unmarried:
65.8% (90,620)
Marital status - White alone, not Hispanic / Latino population 15 years and over
Males 35.6% Never married49.0% Now married1.0% Separated2.6% Widowed11.7% DivorcedFemales 25.4% Never married45.4% Now married1.5% Separated9.7% Widowed18.0% DivorcedWomen who gave birth in the past 12 months Now married:
80.4% (4,119)Unmarried:
19.6% (1,005)
Women who did not give birth in the past 12 months Now married:
43.1% (27,850)Unmarried:
56.9% (36,830)
Marital status - Hispanic or Latino population 15 years and over
Males 46.2% Never married39.3% Now married3.4% Separated2.2% Widowed9.0% DivorcedFemales 41.1% Never married37.2% Now married3.2% Separated7.2% Widowed11.4% DivorcedWomen who gave birth in the past 12 months Now married:
54.7% (7,900)Unmarried:
45.3% (6,532)
Women who did not give birth in the past 12 months Now married:
33.7% (83,081)Unmarried:
66.3% (163,551)
Ancestries in San Antonio
33,474 3.6% American29,345 3.1% German22,956 2.4% English15,729 1.7% Irish6,932 0.7% Italian6,477 0.7% European6,406 0.7% Afghan3,245 0.3% Scottish3,221 0.3% Polish3,122 0.3% African2,852 0.3% French2,424 0.3% Scotch-Irish1,363 0.1% Nigerian1,284 0.1% Jamaican1,208 0.1% Iranian1,184 0.1% Norwegian1,116 0.1% Arab1,076 0.1% Dutch1,036 0.1% Iraqi989 0.1% Russian973 0.1% British953 0.1% Eastern European917 0.10% Czech852 0.09% Swedish730 0.08% Turkish715 0.08% Lebanese707 0.08% Portuguese680 0.07% French Canadian677 0.07% Romanian676 0.07% Egyptian591 0.06% Hungarian588 0.06% Haitian575 0.06% Canadian540 0.06% Brazilian498 0.05% Welsh487 0.05% Scandinavian444 0.05% Northern European439 0.05% Greek416 0.04% Palestinian369 0.04% Danish354 0.04% Somali324 0.03% Czechoslovakian312 0.03% Ukrainian280 0.03% Jordanian273 0.03% Austrian263 0.03% Ghanaian263 0.03% Guyanese251 0.03% Swiss183 0.02% Belgian176 0.02% Sudanese144 0.02% Basque141 0.01% Israeli133 0.01% Icelander123 0.01% West Indian116 0.01% Moroccan109 0.01% Finnish105 0.01% Syrian102 0.01% Bulgarian101 0.01% Slovak93 0.01% Liberian93 0.01% Yugoslavian88 0.01% Ethiopian79 0.01% Kenyan79 0.01% Slovene77 0.01% Croatian77 0.01% Cajun77 0.01% Australian75 0.01% Lithuanian74 0.01% Alsatian72 0.01% Celtic68 0.01% Trinidadian and Tobagonian68 0.01% Armenian67 0.01% Barbadian58 0.01% South African57 0.01% Slavic48 0.01% Senegalese
Geographical mobility in San Antonio Same house 1 year ago 464,099 80.5% White (Caucasian)74,234 75.6% Black or African American14,989 78.8% American Indian / Alaska Native34,757 77.5% Asian1,522 85.2% Native Hawaiian / Pacific Islander154,644 85.2% Other race442,571 83.0% Two or more races254,015 80.2% White alone, not Hispanic / Latino791,746 82.7% Hispanic or LatinoMoved within same county 76,767 13.3% White / Caucasian15,508 15.8% Black or African American2,673 14.1% American Indian / Alaska Native3,761 8.4% Asian84 4.7% Native Hawaiian / Pacific Islander18,912 10.4% Other race70,994 13.3% Two or more races38,236 12.1% White alone, not Hispanic / Latino128,349 13.4% Hispanic or LatinoMoved within same state 15,302 2.7% White / Caucasian3,571 3.6% Black or African American377 2.0% American Indian / Alaska Native2,829 6.3% Asian2,587 1.4% Other race8,542 1.6% Two or more races8,245 2.6% White alone, not Hispanic / Latino17,806 1.9% Hispanic or LatinoMoved from different state 18,760 3.3% White / Caucasian3,906 4.0% Black or African American454 2.4% American Indian / Alaska Native1,719 3.8% Asian23 1.3% Native Hawaiian / Pacific Islander2,046 1.1% Other race7,374 1.4% Two or more races15,217 4.8% White alone, not Hispanic / Latino11,203 1.2% Hispanic or LatinoMoved from abroad 1,701 0.3% White943 1.0% Black or African American146 0.8% American Indian / Alaska Native1,789 4.0% Asian20 1.1% Native Hawaiian / Pacific Islander3,282 1.8% Other race3,812 0.7% Two or more races987 0.3% White alone, not Hispanic / Latino7,873 0.8% Hispanic or Latino
Children Nativity (place of birth) in San Antonio
Children under 6 years - Living with two parents Both parents native 43,735 100.0% NativeBoth parents foreign-born 7,464 76.9% Native2,240 23.1% Foreign-bornOne native, one foreign-born parent 9,180 100.0% NativeChildren under 6 years - Living with one parent Native parent 35,077 100.0% NativeForeign-born parent 5,525 100.0% NativeChildren 6 to 17 years - Living with two parents Both parents native 78,883 99.4% Native446 0.6% Foreign-bornBoth parents foreign-born 15,521 68.0% Native7,307 32.0% Foreign-bornOne native, one foreign-born parent 17,265 97.3% Native477 2.7% Foreign-bornChildren 6 to 17 years - Living with one parent Native parent 84,238 100.0% NativeForeign-born parent 20,061 53.2% Native17,634 46.8% Foreign-born
Place of birth for residents in San Antonio 160,529 Americas159,152 Latin America147,681 Central America38,488 Asia15,550 South Central Asia10,961 South Eastern Asia8,219 Europe7,501 Eastern Asia7,332 South America5,714 Africa4,343 China4,261 Western Asia4,138 Caribbean2,677 Western Europe2,538 Eastern Europe1,940 Northern Europe1,881 Northern Africa1,377 Northern America1,324 Western Africa1,009 Eastern Africa1,006 Southern Europe999 Middle Africa584 Oceania350 Australia and New Zealand Subregion296 Southern Africa133,660 Mexico8,621 India5,514 Honduras5,500 Philippines3,804 El Salvador3,617 China3,501 Afghanistan3,169 Vietnam2,414 Guatemala2,409 Colombia2,336 Cuba2,014 Korea2,002 Iraq1,922 Germany1,348 Canada1,341 Iran1,282 Venezuela1,205 Peru1,143 Japan961 Nicaragua900 Burma (Myanmar)887 Panama846 Russia804 Nigeria801 Egypt773 Brazil768 Pakistan740 Bangladesh736 Jamaica736 Argentina723 England707 Thailand642 Spain596 Turkey585 United Kingdom532 Saudi Arabia503 Dominican Republic502 Taiwan473 France463 Congo461 Ecuador413 Sudan390 Jordan379 Algeria369 Romania366 Democratic Republic of Congo (Zaire)331 Lebanon330 Costa Rica323 Ireland299 Trinidad and Tobago289 Kenya281 Poland279 Morocco273 Indonesia267 Ukraine257 Italy243 South Africa241 Nepal237 Eritrea227 Australia222 Hong Kong215 Malaysia204 Somalia200 Ghana192 Haiti187 Israel187 Chile157 Austria156 Cameroon122 Liberia122 New Zealand118 Bulgaria110 Czechoslovakia108 Laos108 Belize101 Sri Lanka101 Scotland90 Uganda86 United Arab Emirates86 Bolivia81 Hungary81 Serbia81 Netherlands77 Ethiopia75 Senegal73 Denmark58 Syria55 Portugal55 Sweden53 Uruguay50 Greece49 Barbados49 Guyana47 Singapore45 Sierra Leone43 Ivory Coast37 Cambodia35 Kuwait33 Lithuania33 Togo33 Switzerland31 Fiji27 Tanzania27 Bhutan26 Zimbabwe25 Latvia23 Belarus20 Bosnia and Herzegovina20 Moldova19 Georgia18 Uzbekistan16 Norway14 North Macedonia (Macedonia)9 Belgium7 Azores Islands4 Bahamas
Grandparents responsible for own grandchildren in San Antonio
Grandparents (30 to 59 years) White / Caucasian 1,536 53.4% Responsible for grandchildren1,341 46.6% Not responsible for grandchildrenBlack or African American 201 25.2% Responsible for grandchildren597 74.8% Not responsible for grandchildrenAmerican Indian / Alaska Native 124 41.0% Responsible for grandchildren178 59.0% Not responsible for grandchildrenAsian 72 100.0% Not responsible for grandchildrenOther race 959 39.2% Responsible for grandchildren1,487 60.8% Not responsible for grandchildrenTwo or more races 2,439 39.8% Responsible for grandchildren3,696 60.2% Not responsible for grandchildrenWhite alone, not Hispanic / Latino 807 60.6% Responsible for grandchildren524 39.4% Not responsible for grandchildrenHispanic or Latino 4,282 40.3% Responsible for grandchildren6,353 59.7% Not responsible for grandchildrenGrandparents (60 years and over) White / Caucasian 1,845 21.8% Responsible for grandchildren6,599 78.2% Not responsible for grandchildrenBlack or African American 596 67.2% Responsible for grandchildren291 32.8% Not responsible for grandchildrenAmerican Indian / Alaska Native 207 100.0% Not responsible for grandchildrenAsian 101 10.7% Responsible for grandchildren844 89.3% Not responsible for grandchildrenOther race 1,788 43.5% Responsible for grandchildren2,327 56.5% Not responsible for grandchildrenTwo or more races 1,300 15.6% Responsible for grandchildren7,039 84.4% Not responsible for grandchildrenWhite alone, not Hispanic / Latino 915 20.6% Responsible for grandchildren3,534 79.4% Not responsible for grandchildrenHispanic or Latino 3,955 23.8% Responsible for grandchildren12,649 76.2% Not responsible for grandchildren
Zip codes: 78056 , 78073 , 78202 , 78203 , 78204 , 78205 , 78207 , 78208 , 78210 , 78211 , 78214 , 78215 , 78217 , 78218 , 78220 , 78221 , 78222 , 78224 , 78225 , 78226 , 78227 , 78229 , 78230 , 78231 , 78234 , 78235 , 78237 , 78242 , 78243 , 78245 , 78247 , 78248 , 78249 , 78250 , 78251 , 78252 , 78253 , 78257 , 78258 , 78259 , 78260 , 78264 .