Races in Rock Island, Illinois (IL) Detailed Stats
Data:
Races - White alone (%)
Races - White alone (% change since 2000)
Races - Black alone (%)
Races - Black alone (% change since 2000)
Races - American Indian alone (%)
Races - American Indian alone (% change since 2000)
Races - Asian alone (%)
Races - Asian alone (% change since 2000)
Races - Hispanic (%)
Races - Hispanic (% change since 2000)
Races - Native Hawaiian and Other Pacific Islander alone (%)
Races - Native Hawaiian and Other Pacific Islander alone (% change since 2000)
Races - Two or more races(%)
Races - Two or more races(% change since 2000)
Races - Other race alone (%)
Races - Other race alone (% change since 2000)
Racial diversity
Place of birth - Born in state of residence (%)
Place of birth - Born in state of residence (%) - White
Place of birth - Born in state of residence (%) - Black or African American
Place of birth - Born in state of residence (%) - Asian
Place of birth - Born in state of residence (%) - Hispanic or Latino
Place of birth - Born in state of residence (%) - American Indian and Alaska Native
Place of birth - Born in state of residence (%) - Multirace
Place of birth - Born in state of residence (%) - Other Race
Place of birth - Born in other state (%)
Place of birth - Born in other state (%) - White
Place of birth - Born in other state (%) - Black or African American
Place of birth - Born in other state (%) - Asian
Place of birth - Born in other state (%) - Hispanic or Latino
Place of birth - Born in other state (%) - American Indian and Alaska Native
Place of birth - Born in other state (%) - Multirace
Place of birth - Born in other state (%) - Other Race
Place of birth - Native, outside of US (%)
Place of birth - Native, outside of US (%) - White
Place of birth - Native, outside of US (%) - Black or African American
Place of birth - Native, outside of US (%) - Asian
Place of birth - Native, outside of US (%) - Hispanic or Latino
Place of birth - Native, outside of US (%) - American Indian and Alaska Native
Place of birth - Native, outside of US (%) - Multirace
Place of birth - Native, outside of US (%) - Other Race
Place of birth - Foreign born (%)
Place of birth - Foreign born (%) - White
Place of birth - Foreign born (%) - Black or African American
Place of birth - Foreign born (%) - Asian
Place of birth - Foreign born (%) - Hispanic or Latino
Place of birth - Foreign born (%) - American Indian and Alaska Native
Place of birth - Foreign born (%) - Multirace
Place of birth - Foreign born (%) - Other Race
Residents speaking English at home (%)
Residents speaking English at home - Born in the United States (%)
Residents speaking English at home - Native, born elsewhere (%)
Residents speaking English at home - Foreign born (%)
Residents speaking Spanish at home (%)
Residents speaking Spanish at home - Born in the United States (%)
Residents speaking Spanish at home - Native, born elsewhere (%)
Residents speaking Spanish at home - Foreign born (%)
Residents speaking other language at home (%)
Residents speaking other language at home - Born in the United States (%)
Residents speaking other language at home - Native, born elsewhere (%)
Residents speaking other language at home - Foreign born (%)
Marital status - Never married (%)
Marital status - Now married (%)
Marital status - Separated (%)
Marital status - Widowed (%)
Marital status - Divorced (%)
Ancestries Reported - Arab (%)
Ancestries Reported - Czech (%)
Ancestries Reported - Danish (%)
Ancestries Reported - Dutch (%)
Ancestries Reported - English (%)
Ancestries Reported - French (%)
Ancestries Reported - French Canadian (%)
Ancestries Reported - German (%)
Ancestries Reported - Greek (%)
Ancestries Reported - Hungarian (%)
Ancestries Reported - Irish (%)
Ancestries Reported - Italian (%)
Ancestries Reported - Lithuanian (%)
Ancestries Reported - Norwegian (%)
Ancestries Reported - Polish (%)
Ancestries Reported - Portuguese (%)
Ancestries Reported - Russian (%)
Ancestries Reported - Scotch-Irish (%)
Ancestries Reported - Scottish (%)
Ancestries Reported - Slovak (%)
Ancestries Reported - Subsaharan African (%)
Ancestries Reported - Swedish (%)
Ancestries Reported - Swiss (%)
Ancestries Reported - Ukrainian (%)
Ancestries Reported - United States (%)
Ancestries Reported - Welsh (%)
Ancestries Reported - West Indian (%)
Ancestries Reported - Other (%)
Geographical mobility - Same house 1 year ago (%)
Geographical mobility - Same house 1 year ago (%) - White
Geographical mobility - Same house 1 year ago (%) - Black or African American
Geographical mobility - Same house 1 year ago (%) - Asian
Geographical mobility - Same house 1 year ago (%) - Hispanic or Latino
Geographical mobility - Same house 1 year ago (%) - American Indian and Alaska Native
Geographical mobility - Same house 1 year ago (%) - Multirace
Geographical mobility - Same house 1 year ago (%) - Other Race
Geographical mobility - Moved within same county (%)
Geographical mobility - Moved within same county (%) - White
Geographical mobility - Moved within same county (%) - Black or African American
Geographical mobility - Moved within same county (%) - Asian
Geographical mobility - Moved within same county (%) - Hispanic or Latino
Geographical mobility - Moved within same county (%) - American Indian and Alaska Native
Geographical mobility - Moved within same county (%) - Multirace
Geographical mobility - Moved within same county (%) - Other Race
Geographical mobility - Moved from different county within same state (%)
Geographical mobility - Moved from different county within same state (%) - White
Geographical mobility - Moved from different county within same state (%) - Black or African American
Geographical mobility - Moved from different county within same state (%) - Asian
Geographical mobility - Moved from different county within same state (%) - Hispanic or Latino
Geographical mobility - Moved from different county within same state (%) - American Indian and Alaska Native
Geographical mobility - Moved from different county within same state (%) - Multirace
Geographical mobility - Moved from different county within same state (%) - Other Race
Geographical mobility - Moved from different state (%)
Geographical mobility - Moved from different state (%) - White
Geographical mobility - Moved from different state (%) - Black or African American
Geographical mobility - Moved from different state (%) - Asian
Geographical mobility - Moved from different state (%) - Hispanic or Latino
Geographical mobility - Moved from different state (%) - American Indian and Alaska Native
Geographical mobility - Moved from different state (%) - Multirace
Geographical mobility - Moved from different state (%) - Other Race
Geographical mobility - Moved from abroad (%)
Geographical mobility - Moved from abroad (%) - White
Geographical mobility - Moved from abroad (%) - Black or African American
Geographical mobility - Moved from abroad (%) - Asian
Geographical mobility - Moved from abroad (%) - Hispanic or Latino
Geographical mobility - Moved from abroad (%) - American Indian and Alaska Native
Geographical mobility - Moved from abroad (%) - Multirace
Geographical mobility - Moved from abroad (%) - Other Race
Place of birth for the foreign-born population - Ireland (%)
Place of birth for the foreign-born population - Denmark (%)
Place of birth for the foreign-born population - Norway (%)
Place of birth for the foreign-born population - Sweden (%)
Place of birth for the foreign-born population - United Kingdom (%)
Place of birth for the foreign-born population - England (%)
Place of birth for the foreign-born population - Scotland (%)
Place of birth for the foreign-born population - Other Northern Europe (%)
Place of birth for the foreign-born population - Austria (%)
Place of birth for the foreign-born population - Belgium (%)
Place of birth for the foreign-born population - France (%)
Place of birth for the foreign-born population - Germany (%)
Place of birth for the foreign-born population - Netherlands (%)
Place of birth for the foreign-born population - Switzerland (%)
Place of birth for the foreign-born population - Other Western Europe (%)
Place of birth for the foreign-born population - Greece (%)
Place of birth for the foreign-born population - Italy (%)
Place of birth for the foreign-born population - Portugal (%)
Place of birth for the foreign-born population - Spain (%)
Place of birth for the foreign-born population - Other Southern Europe (%)
Place of birth for the foreign-born population - Albania (%)
Place of birth for the foreign-born population - Belarus (%)
Place of birth for the foreign-born population - Bosnia and Herzegovina (%)
Place of birth for the foreign-born population - Bulgaria (%)
Place of birth for the foreign-born population - Croatia (%)
Place of birth for the foreign-born population - Czechoslovakia (%)
Place of birth for the foreign-born population - Hungary (%)
Place of birth for the foreign-born population - Latvia (%)
Place of birth for the foreign-born population - Lithuania (%)
Place of birth for the foreign-born population - North Macedonia (Macedonia) (%)
Place of birth for the foreign-born population - Moldova (%)
Place of birth for the foreign-born population - Poland (%)
Place of birth for the foreign-born population - Romania (%)
Place of birth for the foreign-born population - Russia (%)
Place of birth for the foreign-born population - Serbia (%)
Place of birth for the foreign-born population - Ukraine (%)
Place of birth for the foreign-born population - Other Eastern Europe (%)
Place of birth for the foreign-born population - China (%)
Place of birth for the foreign-born population - Hong Kong (%)
Place of birth for the foreign-born population - Taiwan (%)
Place of birth for the foreign-born population - Japan (%)
Place of birth for the foreign-born population - Korea (%)
Place of birth for the foreign-born population - Other Eastern Asia (%)
Place of birth for the foreign-born population - Afghanistan (%)
Place of birth for the foreign-born population - Bangladesh (%)
Place of birth for the foreign-born population - India (%)
Place of birth for the foreign-born population - Iran (%)
Place of birth for the foreign-born population - Kazakhstan (%)
Place of birth for the foreign-born population - Nepal (%)
Place of birth for the foreign-born population - Pakistan (%)
Place of birth for the foreign-born population - Sri Lanka (%)
Place of birth for the foreign-born population - Uzbekistan (%)
Place of birth for the foreign-born population - Other South Central Asia (%)
Place of birth for the foreign-born population - Burma (%)
Place of birth for the foreign-born population - Cambodia (%)
Place of birth for the foreign-born population - Indonesia (%)
Place of birth for the foreign-born population - Laos (%)
Place of birth for the foreign-born population - Malaysia (%)
Place of birth for the foreign-born population - Philippines (%)
Place of birth for the foreign-born population - Singapore (%)
Place of birth for the foreign-born population - Thailand (%)
Place of birth for the foreign-born population - Vietnam (%)
Place of birth for the foreign-born population - Other South Eastern Asia (%)
Place of birth for the foreign-born population - Armenia (%)
Place of birth for the foreign-born population - Iraq (%)
Place of birth for the foreign-born population - Israel (%)
Place of birth for the foreign-born population - Jordan (%)
Place of birth for the foreign-born population - Kuwait (%)
Place of birth for the foreign-born population - Lebanon (%)
Place of birth for the foreign-born population - Saudi Arabia (%)
Place of birth for the foreign-born population - Syria (%)
Place of birth for the foreign-born population - Turkey (%)
Place of birth for the foreign-born population - Yemen (%)
Place of birth for the foreign-born population - Other Western Asia (%)
Place of birth for the foreign-born population - Eritrea (%)
Place of birth for the foreign-born population - Ethiopia (%)
Place of birth for the foreign-born population - Kenya (%)
Place of birth for the foreign-born population - Somalia (%)
Place of birth for the foreign-born population - Uganda (%)
Place of birth for the foreign-born population - Zimbabwe (%)
Place of birth for the foreign-born population - Other Eastern Africa (%)
Place of birth for the foreign-born population - Cameroon (%)
Place of birth for the foreign-born population - Congo (%)
Place of birth for the foreign-born population - Democratic Republic of Congo (Zaire) (%)
Place of birth for the foreign-born population - Other Middle Africa (%)
Place of birth for the foreign-born population - Egypt (%)
Place of birth for the foreign-born population - Morocco (%)
Place of birth for the foreign-born population - Sudan (%)
Place of birth for the foreign-born population - Other Northern Africa (%)
Place of birth for the foreign-born population - South Africa (%)
Place of birth for the foreign-born population - Other Southern Africa (%)
Place of birth for the foreign-born population - Cabo Verde (%)
Place of birth for the foreign-born population - Ghana (%)
Place of birth for the foreign-born population - Liberia (%)
Place of birth for the foreign-born population - Nigeria (%)
Place of birth for the foreign-born population - Senegal (%)
Place of birth for the foreign-born population - Sierra Leone (%)
Place of birth for the foreign-born population - Other Western Africa (%)
Place of birth for the foreign-born population - Australia (%)
Place of birth for the foreign-born population - New Zealand (%)
Place of birth for the foreign-born population - Fiji (%)
Place of birth for the foreign-born population - Micronesia (%)
Place of birth for the foreign-born population - Bahamas (%)
Place of birth for the foreign-born population - Barbados (%)
Place of birth for the foreign-born population - Cuba (%)
Place of birth for the foreign-born population - Dominica (%)
Place of birth for the foreign-born population - Dominican Republic (%)
Place of birth for the foreign-born population - Grenada (%)
Place of birth for the foreign-born population - Haiti (%)
Place of birth for the foreign-born population - Jamaica (%)
Place of birth for the foreign-born population - St. Vincent and the Grenadines (%)
Place of birth for the foreign-born population - Trinidad and Tobago (%)
Place of birth for the foreign-born population - West Indies (%)
Place of birth for the foreign-born population - Other Caribbean (%)
Place of birth for the foreign-born population - Belize (%)
Place of birth for the foreign-born population - Costa Rica (%)
Place of birth for the foreign-born population - El Salvador (%)
Place of birth for the foreign-born population - Guatemala (%)
Place of birth for the foreign-born population - Honduras (%)
Place of birth for the foreign-born population - Mexico (%)
Place of birth for the foreign-born population - Nicaragua (%)
Place of birth for the foreign-born population - Panama (%)
Place of birth for the foreign-born population - Other Central America (%)
Place of birth for the foreign-born population - Argentina (%)
Place of birth for the foreign-born population - Bolivia (%)
Place of birth for the foreign-born population - Brazil (%)
Place of birth for the foreign-born population - Chile (%)
Place of birth for the foreign-born population - Colombia (%)
Place of birth for the foreign-born population - Ecuador (%)
Place of birth for the foreign-born population - Guyana (%)
Place of birth for the foreign-born population - Peru (%)
Place of birth for the foreign-born population - Uruguay (%)
Place of birth for the foreign-born population - Venezuela (%)
Place of birth for the foreign-born population - Other South America (%)
Place of birth for the foreign-born population - Canada (%)
Place of birth for the foreign-born population - Other Northern America (%)
Place of birth for the foreign-born population - Other (%)
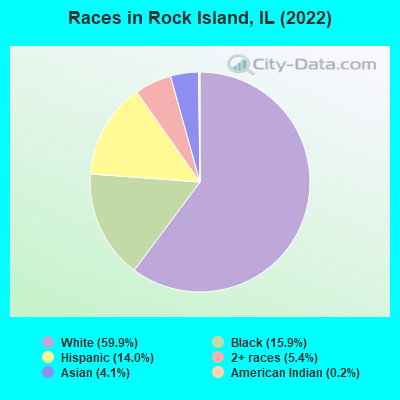
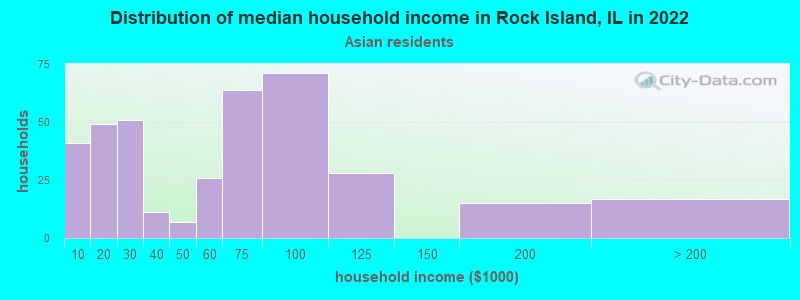
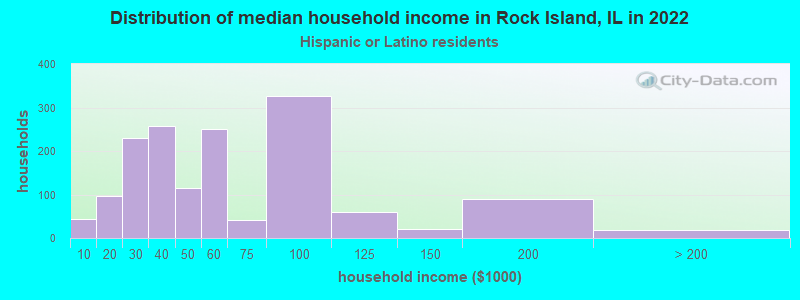
According to 2022 data, the most numerous races in Rock Island, IL are White alone (21,968 residents), Hispanic (5,144 residents), and Black alone (5,816 residents). 87.0% of Rock Island residents speak English at home. 9.5% of Rock Island, IL residents are foreign-born (3.3% born in Latin America, 2.8% born in Africa, 2.8% born in Asia), which is 47.7% less than the foreign-born rate of 14.0% across the entire state of Illinois.
Race distribution in Rock Island
2000 2022
8,424,140 67.8% White alone 1,856,152 14.9% Black alone 1,530,262 12.3% Hispanic 419,916 3.4% Asian alone 153,996 1.2% Two or more races 13,479 0.1% Other race alone 18,232 0.1% American Indian alone 3,116 0.03% Native Hawaiian and Other
7,356,301 58.5% White alone 2,299,726 18.3% Hispanic 1,660,423 13.2% Black alone 747,296 5.9% Asian alone 458,599 3.6% Two or more races 45,386 0.4% Other race alone 10,405 0.08% American Indian alone 3,896 0.03% Native Hawaiian and Other
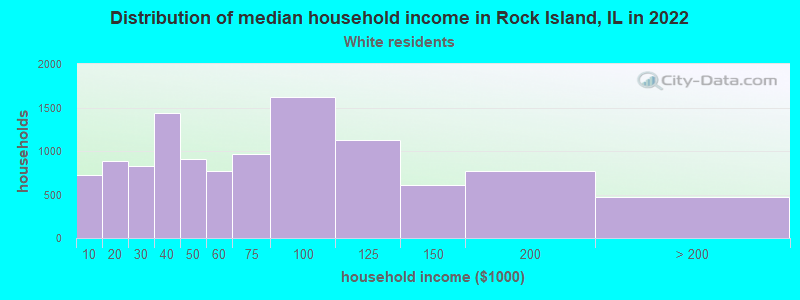
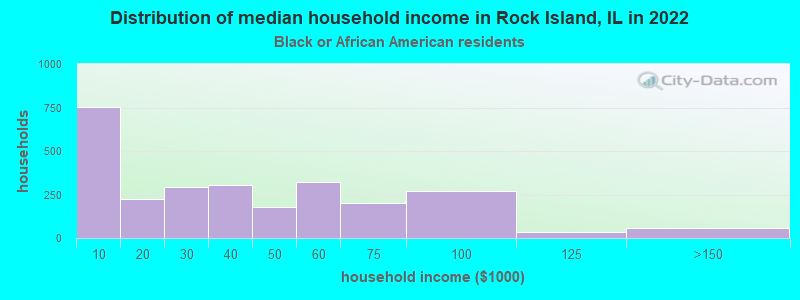
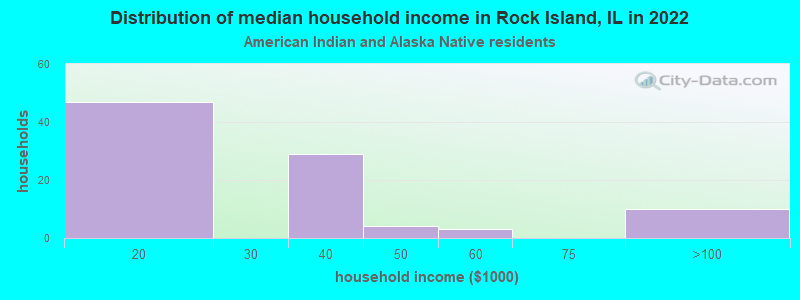
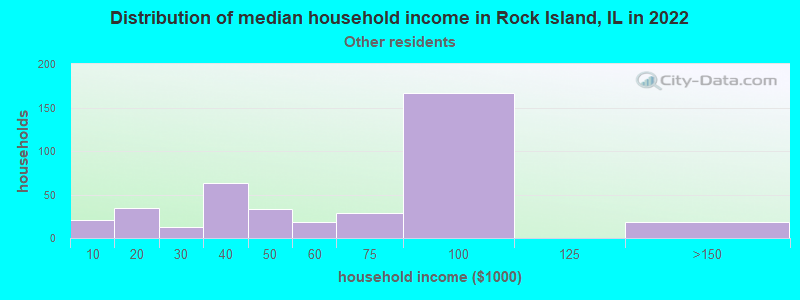
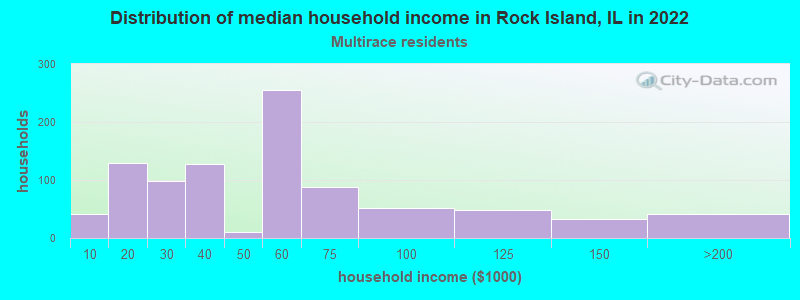
Income and house value in Rock Island Median household income in 2022 $62,436 White non-Hispanic householders$34,633 Black householders$28,268 American Indian and Alaska Native householders$102,341 Asian householders$58,936 Some other race householders$40,351 Two or more races householders$48,567 Hispanic or Latino race householdersMedian 2022 house value $122,312 White Non-Hispanic householders$73,289 Black or African American householders$75,912 American Indian or Alaska Native householders $150,349 Asian householders$122,968 Native Hawaiian and other Pacific Islander householders$77,879 Some other race householders$97,390 Two or more races householders$99,358 Hispanic or Latino householders
Median age by race in Rock Island
41.2 Median age for White residents39.9 43.2 33.9 Median age for Black or African American residents32.8 33.7 63.0 Median age for American Indian / Alaska Native residents55.8 44.1 19.8 Median age for Asian residents15.9 22.7 24.1 Median age for Native Hawaiian / Pacific Islander residents10.7 26.5 24.0 Median age for Other race residents22.0 26.3 23.9 Median age for Two or more races residents24.0 22.9 43.4 Median age for White alone residents41.2 45.8 22.9 Median age for Hispanic or Latino residents23.0 23.2
Owner/renter occupied households by race in Rock Island
House owners and renters - White residents 7,909 71.5% Owner occupied3,156 28.5% Renter occupiedHouse owners and renters - Black or African American residents 948 36.7% Owner occupied1,636 63.3% Renter occupiedHouse owners and renters - American Indian / Alaska Native residents 46 53.2% Owner occupied40 46.8% Renter occupiedHouse owners and renters - Asian residents 274 73.4% Owner occupied100 26.6% Renter occupiedHouse owners and renters - Native Hawaiian / Pacific Islander residents 15 36.9% Owner occupied25 63.1% Renter occupiedHouse owners and renters - Other race residents 283 64.3% Owner occupied157 35.7% Renter occupiedHouse owners and renters - Two or more races residents 475 49.2% Owner occupied490 50.8% Renter occupiedHouse owners and renters - White alone residents 7,452 71.5% Owner occupied2,966 28.5% Renter occupiedHouse owners and renters - Hispanic or Latino residents 903 67.3% Owner occupied438 32.7% Renter occupied
Language usage in Rock Island
English speakers - Total 87.0% of residents of Rock Island speak English at home.
7.5% of residents speak Spanish at home 1,910 73.5% Speak English very well689 26.5% Speak English less than very well5.1% of residents speak other language at home 1,059 60.7% Speak English very well686 39.3% Speak English less than very well
English speakers - Born in the United States 94.4% of residents of Rock Island speak English at home.
4.2% of residents speak Spanish at home 355 86.8% Speak English very well54 13.2% Speak English less than very well1.3% of residents speak other language at home 75 58.6% Speak English very well53 41.4% Speak English less than very well
All residents speak only English at home
English speakers - Foreign-born 14.4% of residents of Rock Island speak English at home.
34.5% of residents speak Spanish at home 437 48.7% Speak English very well461 51.3% Speak English less than very well51.9% of residents speak other language at home 842 62.3% Speak English very well510 37.7% Speak English less than very well
White (Caucasian) - Speak only English Native:
96.3% (21,754)Foreign-born:
13.2% (53)
White (Caucasian) - Speak another language Native:
3.4% (775)Foreign-born:
100.0% (400)
Black or African American - Speak only English Native:
97.6% (4,819)Foreign-born:
65.5% (390)
Black or African American - Speak another language Native:
2.2% (109)Foreign-born:
100.0% (596)
American Indian / Alaska Native - Speak another language Native:
29.8% (40)Foreign-born:
100.0% (31)
Asian - Speak only English Native:
54.0% (184)Foreign-born:
5.4% (54)
Asian - Speak another language Native:
46.0% (156)Foreign-born:
95.6% (963)
Native Hawaiian / Pacific Islander - Speak only English Native:
32.4% (46)Foreign-born:
79.6% (68)
Other race - Speak only English Native:
52.1% (432)Foreign-born:
9.9% (38)
Other race - Speak another language Native:
48.8% (405)Foreign-born:
92.5% (354)
Two or more races - Speak another language Native:
17.9% (550)Foreign-born:
98.4% (164)
White alone - Speak only English Native:
98.6% (20,785)Foreign-born:
30.9% (58)
White alone - Speak another language Native:
1.4% (290)Foreign-born:
67.9% (127)
Hispanic or Latino - Speak only English Native:
59.0% (2,181)Foreign-born:
6.1% (60)
Hispanic or Latino - Speak another language Native:
40.9% (1,513)Foreign-born:
93.5% (916)
Foreign-born residents in Rock Island 3,476 residents are foreign born (3.3% Latin America , 2.8% Africa , 2.8% Asia ).
This city:
9.5%Illinois:
14.1%
Marital status for residents in Rock Island Marital status - White (Caucasian) population 15 years and over
Males 41.5% Never married41.0% Now married1.4% Separated3.7% Widowed12.5% DivorcedFemales 34.0% Never married37.6% Now married2.3% Separated10.6% Widowed15.5% DivorcedWomen who gave birth in the past 12 months Now married:
66.4% (228)Unmarried:
33.6% (116)
Women who did not give birth in the past 12 months Now married:
29.4% (1,464)Unmarried:
70.6% (3,520)
Marital status - Black or African American population 15 years and over
Males 53.8% Never married34.8% Now married2.6% Separated2.7% Widowed6.0% DivorcedFemales 46.8% Never married28.2% Now married2.3% Separated9.6% Widowed13.1% DivorcedWomen who gave birth in the past 12 months Now married:
17.4% (29)Unmarried:
82.6% (140)
Women who did not give birth in the past 12 months Now married:
23.5% (202)Unmarried:
76.5% (657)
Marital status - American Indian / Alaska Native population 15 years and over
Males 70.2% Never married26.3% Now married0.0% Separated3.5% Widowed0.0% DivorcedFemales 15.6% Never married73.3% Now married0.0% Separated6.7% Widowed4.4% DivorcedWomen who did not give birth in the past 12 months Now married:
75.9% (37)Unmarried:
24.1% (12)
Marital status - Asian population 15 years and over
Males 47.0% Never married45.2% Now married4.5% Separated3.3% Widowed0.0% DivorcedFemales 40.9% Never married50.4% Now married0.0% Separated2.7% Widowed6.0% DivorcedWomen who gave birth in the past 12 months Now married:
100.0% (32)Unmarried:
0.0% (0)
Women who did not give birth in the past 12 months Now married:
39.0% (128)Unmarried:
61.0% (201)
Marital status - Native Hawaiian / Pacific Islander population 15 years and over
Males 0.0% Never married100.0% Now married0.0% Separated0.0% Widowed0.0% DivorcedFemales 27.5% Never married33.3% Now married0.0% Separated0.0% Widowed39.2% DivorcedWomen who did not give birth in the past 12 months Now married:
33.3% (26)Unmarried:
66.7% (51)
Marital status - Other race population 15 years and over
Males 64.1% Never married22.9% Now married0.9% Separated2.0% Widowed10.2% DivorcedFemales 56.8% Never married32.1% Now married0.0% Separated1.3% Widowed9.9% DivorcedWomen who gave birth in the past 12 months Now married:
33.3% (22)Unmarried:
66.7% (44)
Women who did not give birth in the past 12 months Now married:
27.8% (103)Unmarried:
72.2% (269)
Marital status - Two or more races population 15 years and over
Males 72.6% Never married20.8% Now married2.4% Separated0.1% Widowed4.0% DivorcedFemales 63.5% Never married21.2% Now married5.3% Separated1.3% Widowed8.8% DivorcedWomen who did not give birth in the past 12 months Now married:
20.5% (211)Unmarried:
79.5% (818)
Marital status - White alone, not Hispanic / Latino population 15 years and over
Males 40.4% Never married41.9% Now married1.2% Separated3.9% Widowed12.6% DivorcedFemales 33.3% Never married38.4% Now married2.4% Separated11.2% Widowed14.7% DivorcedWomen who gave birth in the past 12 months Now married:
68.8% (214)Unmarried:
31.2% (97)
Women who did not give birth in the past 12 months Now married:
30.2% (1,371)Unmarried:
69.8% (3,165)
Marital status - Hispanic or Latino population 15 years and over
Males 57.6% Never married31.3% Now married3.1% Separated0.5% Widowed7.6% DivorcedFemales 48.7% Never married28.6% Now married2.2% Separated2.4% Widowed18.1% DivorcedWomen who gave birth in the past 12 months Now married:
48.2% (56)Unmarried:
51.8% (60)
Women who did not give birth in the past 12 months Now married:
25.6% (295)Unmarried:
74.4% (858)
Ancestries in Rock Island
1,747 11.0% German1,189 7.5% Irish790 5.0% English784 4.9% African714 4.5% American394 2.5% Belgian299 1.9% European281 1.8% Italian233 1.5% Swedish192 1.2% Norwegian157 1.0% Polish110 0.7% Scottish100 0.6% French97 0.6% Dutch91 0.6% Scotch-Irish83 0.5% Ethiopian61 0.4% Czech46 0.3% Russian43 0.3% Scandinavian34 0.2% Welsh33 0.2% Greek30 0.2% Croatian23 0.1% Lithuanian21 0.1% Eastern European21 0.1% Ghanaian19 0.1% Ukrainian19 0.1% Hungarian13 0.08% British12 0.08% Liberian12 0.08% Northern European11 0.07% Moroccan11 0.07% Serbian11 0.07% Haitian9 0.06% Nigerian7 0.04% Danish7 0.04% Slovak7 0.04% Lebanese6 0.04% Slavic5 0.03% Swiss4 0.03% Iraqi3 0.02% Brazilian
Geographical mobility in Rock Island Same house 1 year ago 19,573 82.4% White (Caucasian)5,054 88.3% Black or African American119 71.7% American Indian / Alaska Native1,269 77.8% Asian172 92.9% Native Hawaiian / Pacific Islander1,244 91.5% Other race2,999 87.1% Two or more races18,383 84.6% White alone, not Hispanic / Latino3,928 78.4% Hispanic or LatinoMoved within same county 2,046 8.6% White / Caucasian755 13.2% Black or African American14 8.6% American Indian / Alaska Native109 6.7% Asian14 7.6% Native Hawaiian / Pacific Islander73 5.4% Other race156 4.5% Two or more races1,357 6.2% White alone, not Hispanic / Latino805 16.1% Hispanic or LatinoMoved within same state 1,071 4.5% White / Caucasian251 4.4% Black or African American36 21.6% American Indian / Alaska Native27 1.7% Asian36 2.6% Other race37 1.1% Two or more races983 4.5% White alone, not Hispanic / Latino143 2.8% Hispanic or LatinoMoved from different state 1,032 4.3% White / Caucasian76 1.3% Black or African American73 4.5% Asian7 0.5% Other race42 1.2% Two or more races856 3.9% White alone, not Hispanic / Latino59 1.2% Hispanic or LatinoMoved from abroad 13 0.1% White152 9.3% Asian16 0.5% Two or more races13 0.1% White alone, not Hispanic / Latino
Children Nativity (place of birth) in Rock Island
Children under 6 years - Living with two parents Both parents native 734 100.0% NativeBoth parents foreign-born 262 89.1% Native32 10.9% Foreign-bornOne native, one foreign-born parent 69 100.0% NativeChildren under 6 years - Living with one parent Native parent 1,307 100.0% NativeForeign-born parent 115 49.7% Native116 50.3% Foreign-bornChildren 6 to 17 years - Living with two parents Both parents native 1,734 88.7% Native222 11.3% Foreign-bornBoth parents foreign-born 265 64.3% Native147 35.7% Foreign-bornOne native, one foreign-born parent 188 97.4% Native5 2.6% Foreign-bornChildren 6 to 17 years - Living with one parent Native parent 2,825 100.0% NativeForeign-born parent 379 52.1% Native348 47.9% Foreign-born
Grandparents responsible for own grandchildren in Rock Island
Grandparents (30 to 59 years) White / Caucasian 113 63.9% Responsible for grandchildren64 36.1% Not responsible for grandchildrenBlack or African American 117 94.1% Responsible for grandchildren7 5.9% Not responsible for grandchildrenAsian 12 100.0% Not responsible for grandchildrenOther race 12 100.0% Responsible for grandchildrenTwo or more races 23 100.0% Responsible for grandchildrenWhite alone, not Hispanic / Latino 77 61.1% Responsible for grandchildren49 38.9% Not responsible for grandchildrenHispanic or Latino 67 58.4% Responsible for grandchildren47 41.6% Not responsible for grandchildrenGrandparents (60 years and over) White / Caucasian 34 55.6% Responsible for grandchildren27 44.4% Not responsible for grandchildrenBlack or African American 9 100.0% Responsible for grandchildrenOther race 4 100.0% Not responsible for grandchildrenTwo or more races 23 100.0% Not responsible for grandchildrenWhite alone, not Hispanic / Latino 34 62.2% Responsible for grandchildren20 37.8% Not responsible for grandchildrenHispanic or Latino 13 100.0% Not responsible for grandchildren