Races in Norton, Massachusetts (MA) Detailed Stats
Ancestries, Foreign-born residents, place of birth

Recent posts about races in Norton, Massachusetts on our local forum with over 2,400,000 registered users:
 | towns that offer the most jobs per dollar of house (58 replies) |
| 2021 Real Estate Observations (1729 replies) |
| Posing a question--better house in less desired town or not as nice house in more desired town?? (50 replies) |
| Levels of diversity and integration among the towns and cities of Greater Boston (256 replies) |
| Norton, MA - nice place to live? (15 replies) |
| Norton or Medway? (10 replies) |
Latest news about races in Norton, MA collected exclusively by city-data.com from local newspapers, TV, and radio stations
3.6% of Norton, MA residents are foreign-born (2.3% born in Europe, 0.7% born in Asia), which is 405.7% less than the foreign-born rate of 18.0% across the entire state of Massachusetts.
Race distribution in Norton

- 16,52791.6%White alone
- 7214.0%Other race alone
- 2061.1%Hispanic
- 2051.1%Black alone
- 1801.0%Asian alone
- 1781.0%Two or more races
- 190.1%American Indian alone

2000
2022
-
- 5,198,35981.9%White alone
- 428,7296.8%Hispanic
- 318,3295.0%Black alone
- 236,7863.7%Asian alone
- 110,3381.7%Two or more races
- 43,5860.7%Other race alone
- 11,2640.2%American Indian alone
- 1,7060.03%Native Hawaiian and Other
Pacific Islander alone

-
- 4,676,62767.0%White alone
- 911,03813.0%Hispanic
- 501,4637.2%Asian alone
- 459,7406.6%Black alone
- 341,8894.9%Two or more races
- 84,4031.2%Other race alone
- 5,8380.08%American Indian alone
- 9760.01%Native Hawaiian and Other
Pacific Islander alone

Income and house value in Norton
- Median household income in 2022
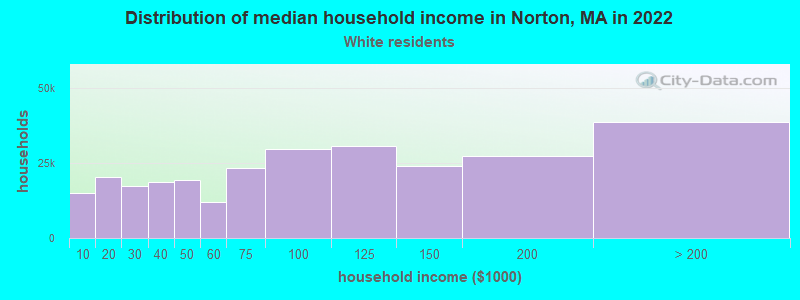
- $124,496White non-Hispanic householders
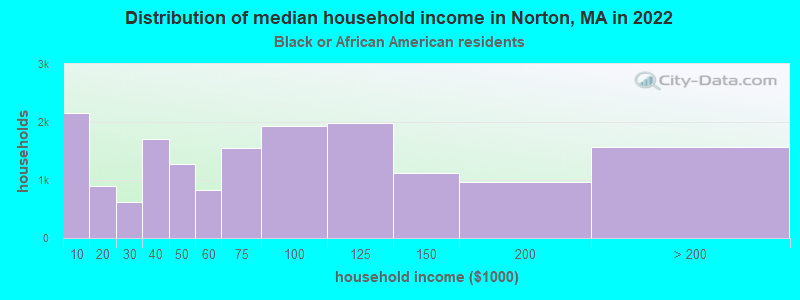
- $109,733Black householders
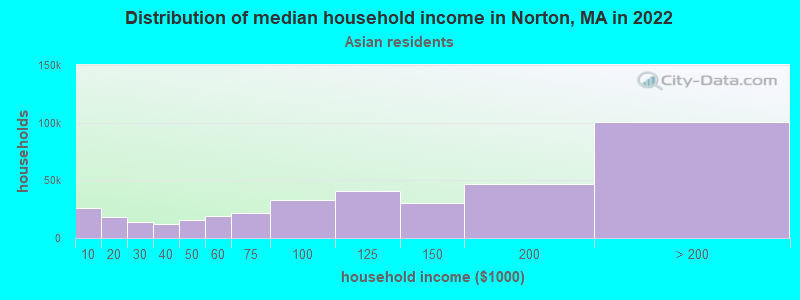
- over $200,000Asian householders
- $51,722Some other race householders
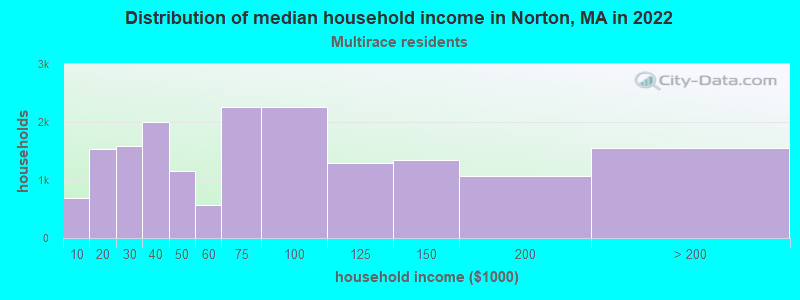
- $67,886Two or more races householders
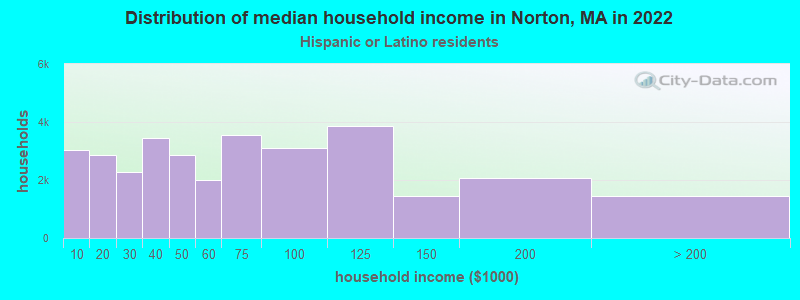
- $107,591Hispanic or Latino race householders
- Median 2022 house value
- $517,166White Non-Hispanic householders
- $477,226Black or African American householders
- $795,279Asian householders
- $433,762Some other race householders
- $477,226Two or more races householders
- $624,065Hispanic or Latino householders
Household income for White non-Hispanic householders
Household income for Black householders
Household income for Asian householders
Household income for Two or more races householders
Household income for Hispanic or Latino race householders
Foreign-born residents in Norton
642 residents are foreign born (2.3% Europe, 0.7% Asia).
| This city: | 3.6% |
| Massachusetts: | 12.2% |
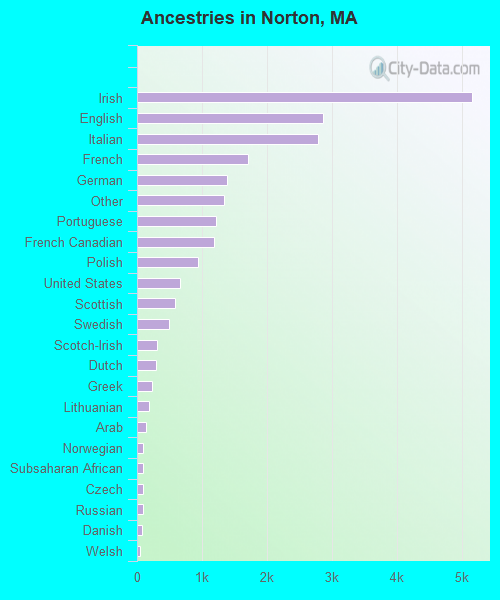
Ancestries in Norton

- 5,16223.3%Irish
- 2,86512.9%English
- 2,78112.6%Italian
- 1,7097.7%French
- 1,3916.3%German
- 1,3406.1%Other
- 1,2195.5%Portuguese
- 1,1915.4%French Canadian
- 9424.3%Polish
- 6593.0%United States
- 5922.7%Scottish
- 4882.2%Swedish
- 3151.4%Scotch-Irish
- 3001.4%Dutch
- 2271.0%Greek
- 1890.9%Lithuanian
- 1420.6%Arab
- 1000.5%Norwegian
- 980.4%Subsaharan African
- 970.4%Czech
- 970.4%Russian
- 700.3%Danish
- 470.2%Welsh
- 310.1%Ukrainian
- 300.1%West Indian
- 270.1%Swiss
- 150.07%Hungarian
Zip codes: 02766.