Races in Northwest Josephine, Oregon (OR) Detailed Stats
Ancestries, Foreign-born residents, place of birth
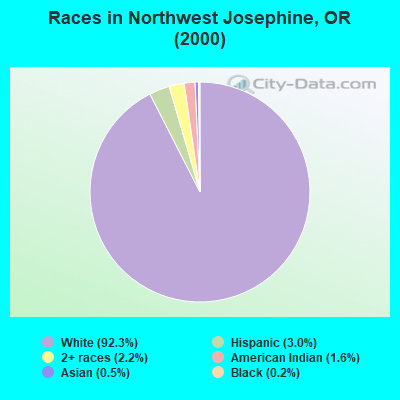
Race distribution in Northwest Josephine

- 5,73292.3%White alone
- 1893.0%Hispanic
- 1372.2%Two or more races
- 981.6%American Indian alone
- 340.5%Asian alone
- 120.2%Black alone
- 60.10%Native Hawaiian and Other
Pacific Islander alone
2000
2022
-
- 2,857,61683.5%White alone
- 275,3148.0%Hispanic
- 100,3332.9%Asian alone
- 82,7332.4%Two or more races
- 53,3251.6%Black alone
- 40,1301.2%American Indian alone
- 7,3980.2%Native Hawaiian and Other
Pacific Islander alone - 4,5500.1%Other race alone

-
- 3,037,57171.6%White alone
- 609,53814.4%Hispanic
- 252,7446.0%Two or more races
- 191,2834.5%Asian alone
- 78,2281.8%Black alone
- 29,3990.7%American Indian alone
- 25,7310.6%Other race alone
- 15,6430.4%Native Hawaiian and Other
Pacific Islander alone

Income and house value in Northwest Josephine
- Median household income in 2022
- $56,330White non-Hispanic householders
- $160,133Black householders
- $57,005American Indian and Alaska Native householders
- $4,839Asian householders
- over $200,000Some other race householders
- $15,124Two or more races householders
- $77,357Hispanic or Latino race householders
- Median 2022 house value
- $470,667White Non-Hispanic householders
- $221,370American Indian or Alaska Native householders
- $936,567Two or more races householders
- $468,283Hispanic or Latino householders
Household income for White non-Hispanic householders

Household income for Black householders

Household income for American Indian and Alaska Native householders

Household income for Asian householders

Household income for Two or more races householders

Household income for Hispanic or Latino race householders

Zip code: 97532