Races in Mount Pleasant, South Carolina (SC) Detailed Stats
Data:
Races - White alone (%)
Races - White alone (% change since 2000)
Races - Black alone (%)
Races - Black alone (% change since 2000)
Races - American Indian alone (%)
Races - American Indian alone (% change since 2000)
Races - Asian alone (%)
Races - Asian alone (% change since 2000)
Races - Hispanic (%)
Races - Hispanic (% change since 2000)
Races - Native Hawaiian and Other Pacific Islander alone (%)
Races - Native Hawaiian and Other Pacific Islander alone (% change since 2000)
Races - Two or more races(%)
Races - Two or more races(% change since 2000)
Races - Other race alone (%)
Races - Other race alone (% change since 2000)
Racial diversity
Place of birth - Born in state of residence (%)
Place of birth - Born in state of residence (%) - White
Place of birth - Born in state of residence (%) - Black or African American
Place of birth - Born in state of residence (%) - Asian
Place of birth - Born in state of residence (%) - Hispanic or Latino
Place of birth - Born in state of residence (%) - American Indian and Alaska Native
Place of birth - Born in state of residence (%) - Multirace
Place of birth - Born in state of residence (%) - Other Race
Place of birth - Born in other state (%)
Place of birth - Born in other state (%) - White
Place of birth - Born in other state (%) - Black or African American
Place of birth - Born in other state (%) - Asian
Place of birth - Born in other state (%) - Hispanic or Latino
Place of birth - Born in other state (%) - American Indian and Alaska Native
Place of birth - Born in other state (%) - Multirace
Place of birth - Born in other state (%) - Other Race
Place of birth - Native, outside of US (%)
Place of birth - Native, outside of US (%) - White
Place of birth - Native, outside of US (%) - Black or African American
Place of birth - Native, outside of US (%) - Asian
Place of birth - Native, outside of US (%) - Hispanic or Latino
Place of birth - Native, outside of US (%) - American Indian and Alaska Native
Place of birth - Native, outside of US (%) - Multirace
Place of birth - Native, outside of US (%) - Other Race
Place of birth - Foreign born (%)
Place of birth - Foreign born (%) - White
Place of birth - Foreign born (%) - Black or African American
Place of birth - Foreign born (%) - Asian
Place of birth - Foreign born (%) - Hispanic or Latino
Place of birth - Foreign born (%) - American Indian and Alaska Native
Place of birth - Foreign born (%) - Multirace
Place of birth - Foreign born (%) - Other Race
Residents speaking English at home (%)
Residents speaking English at home - Born in the United States (%)
Residents speaking English at home - Native, born elsewhere (%)
Residents speaking English at home - Foreign born (%)
Residents speaking Spanish at home (%)
Residents speaking Spanish at home - Born in the United States (%)
Residents speaking Spanish at home - Native, born elsewhere (%)
Residents speaking Spanish at home - Foreign born (%)
Residents speaking other language at home (%)
Residents speaking other language at home - Born in the United States (%)
Residents speaking other language at home - Native, born elsewhere (%)
Residents speaking other language at home - Foreign born (%)
Marital status - Never married (%)
Marital status - Now married (%)
Marital status - Separated (%)
Marital status - Widowed (%)
Marital status - Divorced (%)
Ancestries Reported - Arab (%)
Ancestries Reported - Czech (%)
Ancestries Reported - Danish (%)
Ancestries Reported - Dutch (%)
Ancestries Reported - English (%)
Ancestries Reported - French (%)
Ancestries Reported - French Canadian (%)
Ancestries Reported - German (%)
Ancestries Reported - Greek (%)
Ancestries Reported - Hungarian (%)
Ancestries Reported - Irish (%)
Ancestries Reported - Italian (%)
Ancestries Reported - Lithuanian (%)
Ancestries Reported - Norwegian (%)
Ancestries Reported - Polish (%)
Ancestries Reported - Portuguese (%)
Ancestries Reported - Russian (%)
Ancestries Reported - Scotch-Irish (%)
Ancestries Reported - Scottish (%)
Ancestries Reported - Slovak (%)
Ancestries Reported - Subsaharan African (%)
Ancestries Reported - Swedish (%)
Ancestries Reported - Swiss (%)
Ancestries Reported - Ukrainian (%)
Ancestries Reported - United States (%)
Ancestries Reported - Welsh (%)
Ancestries Reported - West Indian (%)
Ancestries Reported - Other (%)
Geographical mobility - Same house 1 year ago (%)
Geographical mobility - Same house 1 year ago (%) - White
Geographical mobility - Same house 1 year ago (%) - Black or African American
Geographical mobility - Same house 1 year ago (%) - Asian
Geographical mobility - Same house 1 year ago (%) - Hispanic or Latino
Geographical mobility - Same house 1 year ago (%) - American Indian and Alaska Native
Geographical mobility - Same house 1 year ago (%) - Multirace
Geographical mobility - Same house 1 year ago (%) - Other Race
Geographical mobility - Moved within same county (%)
Geographical mobility - Moved within same county (%) - White
Geographical mobility - Moved within same county (%) - Black or African American
Geographical mobility - Moved within same county (%) - Asian
Geographical mobility - Moved within same county (%) - Hispanic or Latino
Geographical mobility - Moved within same county (%) - American Indian and Alaska Native
Geographical mobility - Moved within same county (%) - Multirace
Geographical mobility - Moved within same county (%) - Other Race
Geographical mobility - Moved from different county within same state (%)
Geographical mobility - Moved from different county within same state (%) - White
Geographical mobility - Moved from different county within same state (%) - Black or African American
Geographical mobility - Moved from different county within same state (%) - Asian
Geographical mobility - Moved from different county within same state (%) - Hispanic or Latino
Geographical mobility - Moved from different county within same state (%) - American Indian and Alaska Native
Geographical mobility - Moved from different county within same state (%) - Multirace
Geographical mobility - Moved from different county within same state (%) - Other Race
Geographical mobility - Moved from different state (%)
Geographical mobility - Moved from different state (%) - White
Geographical mobility - Moved from different state (%) - Black or African American
Geographical mobility - Moved from different state (%) - Asian
Geographical mobility - Moved from different state (%) - Hispanic or Latino
Geographical mobility - Moved from different state (%) - American Indian and Alaska Native
Geographical mobility - Moved from different state (%) - Multirace
Geographical mobility - Moved from different state (%) - Other Race
Geographical mobility - Moved from abroad (%)
Geographical mobility - Moved from abroad (%) - White
Geographical mobility - Moved from abroad (%) - Black or African American
Geographical mobility - Moved from abroad (%) - Asian
Geographical mobility - Moved from abroad (%) - Hispanic or Latino
Geographical mobility - Moved from abroad (%) - American Indian and Alaska Native
Geographical mobility - Moved from abroad (%) - Multirace
Geographical mobility - Moved from abroad (%) - Other Race
Place of birth for the foreign-born population - Ireland (%)
Place of birth for the foreign-born population - Denmark (%)
Place of birth for the foreign-born population - Norway (%)
Place of birth for the foreign-born population - Sweden (%)
Place of birth for the foreign-born population - United Kingdom (%)
Place of birth for the foreign-born population - England (%)
Place of birth for the foreign-born population - Scotland (%)
Place of birth for the foreign-born population - Other Northern Europe (%)
Place of birth for the foreign-born population - Austria (%)
Place of birth for the foreign-born population - Belgium (%)
Place of birth for the foreign-born population - France (%)
Place of birth for the foreign-born population - Germany (%)
Place of birth for the foreign-born population - Netherlands (%)
Place of birth for the foreign-born population - Switzerland (%)
Place of birth for the foreign-born population - Other Western Europe (%)
Place of birth for the foreign-born population - Greece (%)
Place of birth for the foreign-born population - Italy (%)
Place of birth for the foreign-born population - Portugal (%)
Place of birth for the foreign-born population - Spain (%)
Place of birth for the foreign-born population - Other Southern Europe (%)
Place of birth for the foreign-born population - Albania (%)
Place of birth for the foreign-born population - Belarus (%)
Place of birth for the foreign-born population - Bosnia and Herzegovina (%)
Place of birth for the foreign-born population - Bulgaria (%)
Place of birth for the foreign-born population - Croatia (%)
Place of birth for the foreign-born population - Czechoslovakia (%)
Place of birth for the foreign-born population - Hungary (%)
Place of birth for the foreign-born population - Latvia (%)
Place of birth for the foreign-born population - Lithuania (%)
Place of birth for the foreign-born population - North Macedonia (Macedonia) (%)
Place of birth for the foreign-born population - Moldova (%)
Place of birth for the foreign-born population - Poland (%)
Place of birth for the foreign-born population - Romania (%)
Place of birth for the foreign-born population - Russia (%)
Place of birth for the foreign-born population - Serbia (%)
Place of birth for the foreign-born population - Ukraine (%)
Place of birth for the foreign-born population - Other Eastern Europe (%)
Place of birth for the foreign-born population - China (%)
Place of birth for the foreign-born population - Hong Kong (%)
Place of birth for the foreign-born population - Taiwan (%)
Place of birth for the foreign-born population - Japan (%)
Place of birth for the foreign-born population - Korea (%)
Place of birth for the foreign-born population - Other Eastern Asia (%)
Place of birth for the foreign-born population - Afghanistan (%)
Place of birth for the foreign-born population - Bangladesh (%)
Place of birth for the foreign-born population - India (%)
Place of birth for the foreign-born population - Iran (%)
Place of birth for the foreign-born population - Kazakhstan (%)
Place of birth for the foreign-born population - Nepal (%)
Place of birth for the foreign-born population - Pakistan (%)
Place of birth for the foreign-born population - Sri Lanka (%)
Place of birth for the foreign-born population - Uzbekistan (%)
Place of birth for the foreign-born population - Other South Central Asia (%)
Place of birth for the foreign-born population - Burma (%)
Place of birth for the foreign-born population - Cambodia (%)
Place of birth for the foreign-born population - Indonesia (%)
Place of birth for the foreign-born population - Laos (%)
Place of birth for the foreign-born population - Malaysia (%)
Place of birth for the foreign-born population - Philippines (%)
Place of birth for the foreign-born population - Singapore (%)
Place of birth for the foreign-born population - Thailand (%)
Place of birth for the foreign-born population - Vietnam (%)
Place of birth for the foreign-born population - Other South Eastern Asia (%)
Place of birth for the foreign-born population - Armenia (%)
Place of birth for the foreign-born population - Iraq (%)
Place of birth for the foreign-born population - Israel (%)
Place of birth for the foreign-born population - Jordan (%)
Place of birth for the foreign-born population - Kuwait (%)
Place of birth for the foreign-born population - Lebanon (%)
Place of birth for the foreign-born population - Saudi Arabia (%)
Place of birth for the foreign-born population - Syria (%)
Place of birth for the foreign-born population - Turkey (%)
Place of birth for the foreign-born population - Yemen (%)
Place of birth for the foreign-born population - Other Western Asia (%)
Place of birth for the foreign-born population - Eritrea (%)
Place of birth for the foreign-born population - Ethiopia (%)
Place of birth for the foreign-born population - Kenya (%)
Place of birth for the foreign-born population - Somalia (%)
Place of birth for the foreign-born population - Uganda (%)
Place of birth for the foreign-born population - Zimbabwe (%)
Place of birth for the foreign-born population - Other Eastern Africa (%)
Place of birth for the foreign-born population - Cameroon (%)
Place of birth for the foreign-born population - Congo (%)
Place of birth for the foreign-born population - Democratic Republic of Congo (Zaire) (%)
Place of birth for the foreign-born population - Other Middle Africa (%)
Place of birth for the foreign-born population - Egypt (%)
Place of birth for the foreign-born population - Morocco (%)
Place of birth for the foreign-born population - Sudan (%)
Place of birth for the foreign-born population - Other Northern Africa (%)
Place of birth for the foreign-born population - South Africa (%)
Place of birth for the foreign-born population - Other Southern Africa (%)
Place of birth for the foreign-born population - Cabo Verde (%)
Place of birth for the foreign-born population - Ghana (%)
Place of birth for the foreign-born population - Liberia (%)
Place of birth for the foreign-born population - Nigeria (%)
Place of birth for the foreign-born population - Senegal (%)
Place of birth for the foreign-born population - Sierra Leone (%)
Place of birth for the foreign-born population - Other Western Africa (%)
Place of birth for the foreign-born population - Australia (%)
Place of birth for the foreign-born population - New Zealand (%)
Place of birth for the foreign-born population - Fiji (%)
Place of birth for the foreign-born population - Micronesia (%)
Place of birth for the foreign-born population - Bahamas (%)
Place of birth for the foreign-born population - Barbados (%)
Place of birth for the foreign-born population - Cuba (%)
Place of birth for the foreign-born population - Dominica (%)
Place of birth for the foreign-born population - Dominican Republic (%)
Place of birth for the foreign-born population - Grenada (%)
Place of birth for the foreign-born population - Haiti (%)
Place of birth for the foreign-born population - Jamaica (%)
Place of birth for the foreign-born population - St. Vincent and the Grenadines (%)
Place of birth for the foreign-born population - Trinidad and Tobago (%)
Place of birth for the foreign-born population - West Indies (%)
Place of birth for the foreign-born population - Other Caribbean (%)
Place of birth for the foreign-born population - Belize (%)
Place of birth for the foreign-born population - Costa Rica (%)
Place of birth for the foreign-born population - El Salvador (%)
Place of birth for the foreign-born population - Guatemala (%)
Place of birth for the foreign-born population - Honduras (%)
Place of birth for the foreign-born population - Mexico (%)
Place of birth for the foreign-born population - Nicaragua (%)
Place of birth for the foreign-born population - Panama (%)
Place of birth for the foreign-born population - Other Central America (%)
Place of birth for the foreign-born population - Argentina (%)
Place of birth for the foreign-born population - Bolivia (%)
Place of birth for the foreign-born population - Brazil (%)
Place of birth for the foreign-born population - Chile (%)
Place of birth for the foreign-born population - Colombia (%)
Place of birth for the foreign-born population - Ecuador (%)
Place of birth for the foreign-born population - Guyana (%)
Place of birth for the foreign-born population - Peru (%)
Place of birth for the foreign-born population - Uruguay (%)
Place of birth for the foreign-born population - Venezuela (%)
Place of birth for the foreign-born population - Other South America (%)
Place of birth for the foreign-born population - Canada (%)
Place of birth for the foreign-born population - Other Northern America (%)
Place of birth for the foreign-born population - Other (%)
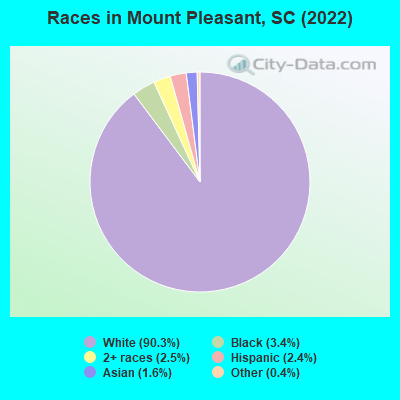
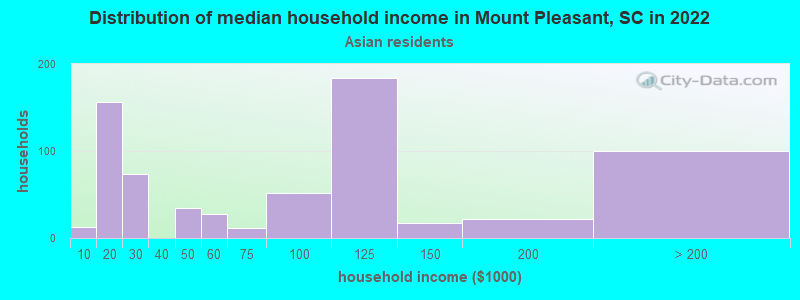
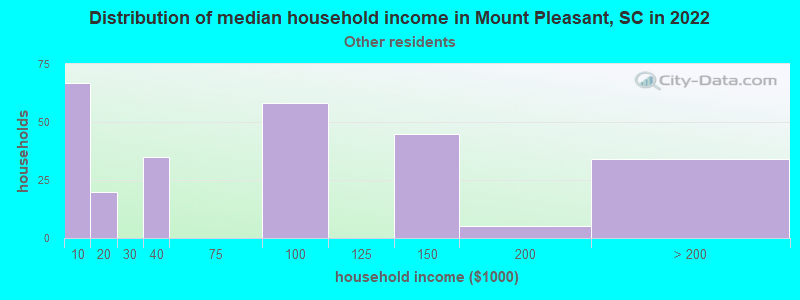
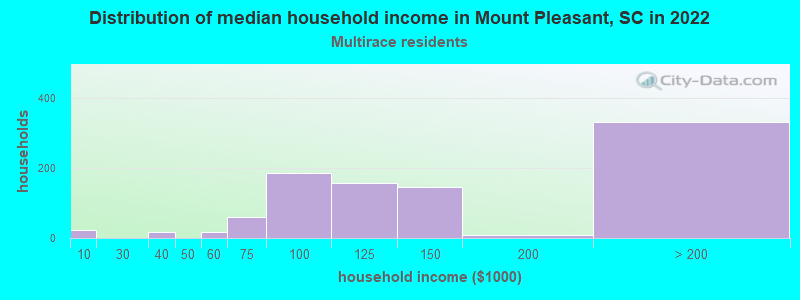
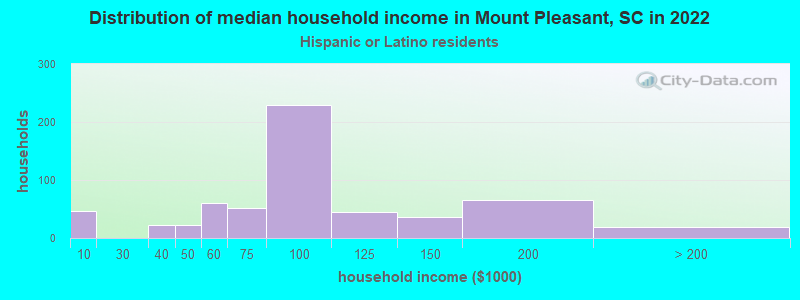
According to 2022 data, the most numerous races in Mount Pleasant, SC are White alone (84,031 residents), Black alone (3,204 residents), and Hispanic (2,247 residents). 93.8% of Mount Pleasant residents speak English at home. 5.0% of Mount Pleasant, SC residents are foreign-born (1.8% born in Europe, 1.4% born in Asia, 1.1% born in Latin America, 0.5% born in North America), which is about the same as the foreign-born rate of 5.0% across the entire state of South Carolina.
Race distribution in Mount Pleasant
2000 2022
2,652,291 66.1% White alone 1,178,486 29.4% Black alone 95,076 2.4% Hispanic 35,568 0.9% Asian alone 33,290 0.8% Two or more races 12,765 0.3% American Indian alone 3,266 0.08% Other race alone 1,270 0.03% Native Hawaiian and Other
3,301,739 62.5% White alone 1,313,290 24.9% Black alone 343,783 6.5% Hispanic 190,508 3.6% Two or more races 89,888 1.7% Asian alone 29,390 0.6% Other race alone 12,112 0.2% American Indian alone 1,924 0.04% Native Hawaiian and Other
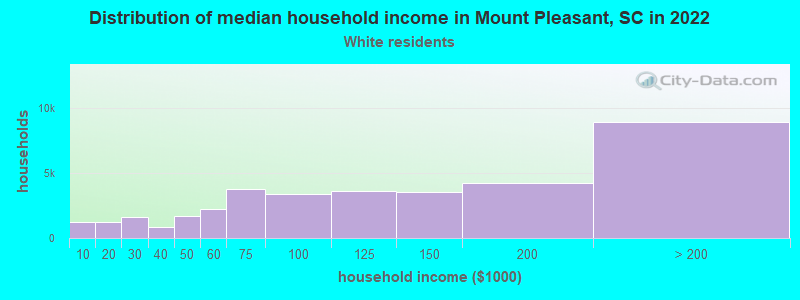
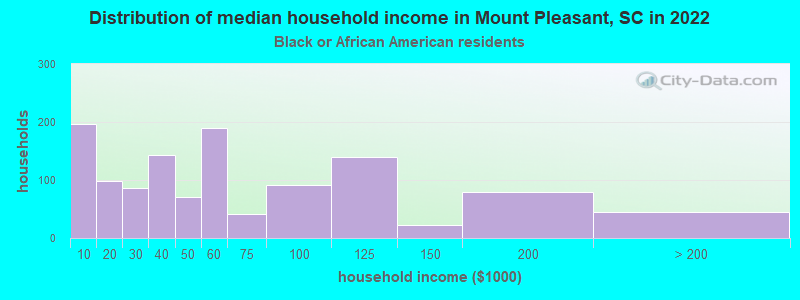
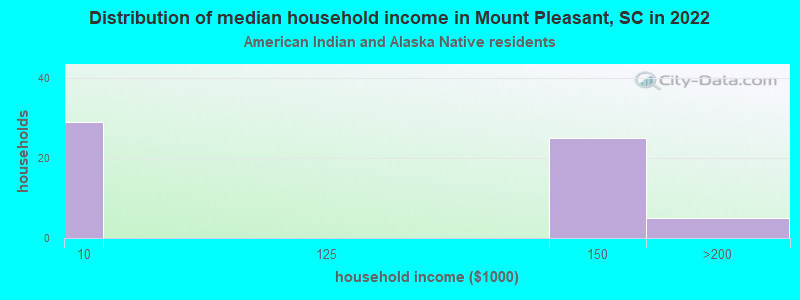
Income and house value in Mount Pleasant Median household income in 2022 $113,743 White non-Hispanic householders$54,260 Black householdersover $200,000 Asian householders$123,554 Two or more races householders$124,420 Hispanic or Latino race householdersMedian 2022 house value $757,765 White Non-Hispanic householders$455,220 Black or African American householders$751,354 American Indian or Alaska Native householders $760,570 Asian householders$751,354 Two or more races householders$824,285 Hispanic or Latino householders
Median age by race in Mount Pleasant
41.6 Median age for White residents42.1 41.1 50.2 Median age for Black or African American residents45.3 51.8 -666,666,666.0 Median age for American Indian / Alaska Native residents-666,666,666.0 -666,666,666.0 42.7 Median age for Asian residents50.0 25.5 -666,666,666.0 Median age for Native Hawaiian / Pacific Islander residents-666,666,666.0 -666,666,666.0 47.0 Median age for Other race residents54.1 46.4 25.9 Median age for Two or more races residents19.1 26.2 41.6 Median age for White alone residents42.2 41.0 33.7 Median age for Hispanic or Latino residents27.8 52.6
Owner/renter occupied households by race in Mount Pleasant
House owners and renters - White residents 27,084 74.4% Owner occupied9,318 25.6% Renter occupiedHouse owners and renters - Black or African American residents 587 37.9% Owner occupied961 62.1% Renter occupiedHouse owners and renters - American Indian / Alaska Native residents 68 77.4% Owner occupied20 22.6% Renter occupiedHouse owners and renters - Asian residents 397 79.6% Owner occupied102 20.4% Renter occupiedHouse owners and renters - Other race residents 82 35.1% Owner occupied152 64.9% Renter occupiedHouse owners and renters - Two or more races residents 597 61.8% Owner occupied369 38.2% Renter occupiedHouse owners and renters - White alone residents 26,974 74.4% Owner occupied9,271 25.6% Renter occupiedHouse owners and renters - Hispanic or Latino residents 369 69.0% Owner occupied166 31.0% Renter occupied
Language usage in Mount Pleasant
English speakers - Total 93.8% of residents of Mount Pleasant speak English at home.
2.0% of residents speak Spanish at home 1,529 86.5% Speak English very well239 13.5% Speak English less than very well4.1% of residents speak other language at home 3,239 88.8% Speak English very well409 11.2% Speak English less than very well
English speakers - Born in the United States 97.3% of residents of Mount Pleasant speak English at home.
1.0% of residents speak Spanish at home 479 82.7% Speak English very well100 17.3% Speak English less than very well1.3% of residents speak other language at home 689 91.4% Speak English very well65 8.6% Speak English less than very well
English speakers - Native, born elsewhere 71.2% of residents of Mount Pleasant speak English at home.
14.6% of residents speak Spanish at home 169 100.0% Speak English very well2.7% of residents speak other language at home 31 100.0% Speak English very well
English speakers - Foreign-born 42.3% of residents of Mount Pleasant speak English at home.
11.6% of residents speak Spanish at home 473 88.4% Speak English very well62 11.6% Speak English less than very well48.2% of residents speak other language at home 1,920 86.5% Speak English very well300 13.5% Speak English less than very well
White (Caucasian) - Speak only English Native:
98.6% (76,092)Foreign-born:
41.0% (1,307)
White (Caucasian) - Speak another language Native:
1.4% (1,060)Foreign-born:
59.0% (1,878)
Black or African American - Speak only English Native:
97.3% (3,052)Foreign-born:
68.5% (24)
Asian - Speak only English Native:
62.0% (355)Foreign-born:
45.0% (431)
Asian - Speak another language Native:
30.1% (172)Foreign-born:
59.8% (573)
Other race - Speak only English Native:
71.3% (139)Foreign-born:
11.9% (38)
Other race - Speak another language Native:
29.0% (56)Foreign-born:
86.6% (274)
Two or more races - Speak only English Native:
86.1% (2,145)Foreign-born:
24.4% (96)
Two or more races - Speak another language Native:
13.6% (339)Foreign-born:
51.0% (201)
White alone - Speak only English Native:
98.8% (75,706)Foreign-born:
41.7% (1,307)
White alone - Speak another language Native:
1.2% (955)Foreign-born:
58.3% (1,831)
Hispanic or Latino - Speak only English Native:
67.3% (842)Foreign-born:
21.7% (119)
Hispanic or Latino - Speak another language Native:
27.3% (342)Foreign-born:
78.3% (427)
Foreign-born residents in Mount Pleasant 4,689 residents are foreign born (1.8% Europe , 1.4% Asia , 1.1% Latin America , 0.5% North America ).
This city:
5.0%South Carolina:
5.3%
Marital status for residents in Mount Pleasant Marital status - White (Caucasian) population 15 years and over
Males 24.2% Never married64.7% Now married1.1% Separated1.1% Widowed8.9% DivorcedFemales 22.3% Never married58.6% Now married2.7% Separated5.6% Widowed10.9% DivorcedWomen who gave birth in the past 12 months Now married:
100.0% (554)Unmarried:
0.0% (0)
Women who did not give birth in the past 12 months Now married:
58.0% (10,949)Unmarried:
42.0% (7,944)
Marital status - Black or African American population 15 years and over
Males 50.0% Never married36.5% Now married0.1% Separated1.4% Widowed12.0% DivorcedFemales 51.2% Never married21.2% Now married1.6% Separated11.9% Widowed14.0% DivorcedWomen who gave birth in the past 12 months Now married:
100.0% (25)Unmarried:
0.0% (0)
Women who did not give birth in the past 12 months Now married:
19.7% (139)Unmarried:
80.3% (570)
Marital status - American Indian / Alaska Native population 15 years and over
Males 0.0% Never married100.0% Now married0.0% Separated0.0% Widowed0.0% DivorcedFemales 0.0% Never married75.3% Now married0.0% Separated24.7% Widowed0.0% DivorcedWomen who gave birth in the past 12 months Now married:
100.0% (67)Unmarried:
0.0% (0)
Women who did not give birth in the past 12 months Now married:
100.0% (8)Unmarried:
0.0% (0)
Marital status - Asian population 15 years and over
Males 31.7% Never married61.2% Now married0.0% Separated0.0% Widowed7.1% DivorcedFemales 14.3% Never married73.0% Now married0.0% Separated2.5% Widowed10.2% DivorcedWomen who did not give birth in the past 12 months Now married:
42.5% (130)Unmarried:
57.5% (175)
Marital status - Other race population 15 years and over
Males 49.8% Never married42.7% Now married0.0% Separated7.5% Widowed0.0% DivorcedFemales 24.3% Never married75.7% Now married0.0% Separated0.0% Widowed0.0% DivorcedWomen who gave birth in the past 12 months Now married:
100.0% (24)Unmarried:
0.0% (0)
Women who did not give birth in the past 12 months Now married:
55.0% (60)Unmarried:
45.0% (49)
Marital status - Two or more races population 15 years and over
Males 44.0% Never married51.3% Now married0.0% Separated2.7% Widowed2.0% DivorcedFemales 33.6% Never married56.3% Now married0.0% Separated4.2% Widowed6.0% DivorcedWomen who gave birth in the past 12 months Now married:
100.0% (26)Unmarried:
0.0% (0)
Women who did not give birth in the past 12 months Now married:
51.0% (461)Unmarried:
49.0% (443)
Marital status - White alone, not Hispanic / Latino population 15 years and over
Males 24.1% Never married64.9% Now married0.9% Separated1.1% Widowed9.0% DivorcedFemales 22.2% Never married58.5% Now married2.8% Separated5.6% Widowed11.0% DivorcedWomen who gave birth in the past 12 months Now married:
100.0% (554)Unmarried:
0.0% (0)
Women who did not give birth in the past 12 months Now married:
58.2% (10,907)Unmarried:
41.8% (7,847)
Marital status - Hispanic or Latino population 15 years and over
Males 57.3% Never married36.1% Now married1.3% Separated5.2% Widowed0.0% DivorcedFemales 18.8% Never married58.1% Now married0.0% Separated7.7% Widowed15.4% DivorcedWomen who gave birth in the past 12 months Now married:
100.0% (121)Unmarried:
0.0% (0)
Women who did not give birth in the past 12 months Now married:
50.2% (285)Unmarried:
49.8% (283)
Ancestries in Mount Pleasant
14,463 29.1% English10,264 20.7% American5,128 10.3% Irish4,854 9.8% German2,854 5.8% Italian1,862 3.8% European1,604 3.2% Scottish737 1.5% Polish713 1.4% French578 1.2% Scotch-Irish469 0.9% Swedish364 0.7% French Canadian252 0.5% British248 0.5% Turkish216 0.4% Eastern European209 0.4% Ukrainian164 0.3% Norwegian158 0.3% Greek135 0.3% Russian132 0.3% Slovak123 0.2% Dutch119 0.2% Czech115 0.2% Welsh78 0.2% Portuguese74 0.1% Slavic73 0.1% African68 0.1% Scandinavian67 0.1% Belgian66 0.1% Austrian60 0.1% South African58 0.1% Hungarian50 0.1% Brazilian49 0.10% Canadian41 0.08% Latvian32 0.06% Lebanese27 0.05% Northern European25 0.05% Swiss24 0.05% Finnish24 0.05% Danish19 0.04% Afghan18 0.04% Armenian17 0.03% Slovene13 0.03% Yugoslavian11 0.02% Lithuanian11 0.02% Iraqi8 0.02% Syrian
Geographical mobility in Mount Pleasant Same house 1 year ago 69,623 82.6% White (Caucasian)2,859 89.1% Black or African American186 94.0% American Indian / Alaska Native1,385 86.6% Asian10 15.7% Native Hawaiian / Pacific Islander505 88.6% Other race2,219 66.0% Two or more races69,085 82.5% White alone, not Hispanic / Latino1,938 90.6% Hispanic or LatinoMoved within same county 5,293 6.3% White / Caucasian239 7.5% Black or African American5 2.7% American Indian / Alaska Native49 3.0% Asian49 79.9% Native Hawaiian / Pacific Islander1 0.2% Other race339 10.1% Two or more races5,293 6.3% White alone, not Hispanic / Latino47 2.2% Hispanic or LatinoMoved within same state 1,319 1.6% White / Caucasian119 3.7% Black or African American17 3.1% Other race51 1.5% Two or more races1,319 1.6% White alone, not Hispanic / LatinoMoved from different state 7,203 8.5% White / Caucasian30 5.2% Other race252 7.5% Two or more races7,203 8.6% White alone, not Hispanic / Latino93 4.3% Hispanic or LatinoMoved from abroad 814 1.0% White140 8.8% Asian13 2.2% Other race814 1.0% White alone, not Hispanic / Latino
Children Nativity (place of birth) in Mount Pleasant
Children under 6 years - Living with two parents Both parents native 4,635 100.0% NativeBoth parents foreign-born 62 36.6% Native108 63.4% Foreign-bornOne native, one foreign-born parent 456 100.0% NativeChildren under 6 years - Living with one parent Native parent 626 100.0% NativeChildren 6 to 17 years - Living with two parents Both parents native 11,676 99.4% Native72 0.6% Foreign-bornBoth parents foreign-born 93 26.7% Native256 73.3% Foreign-bornOne native, one foreign-born parent 925 100.0% NativeChildren 6 to 17 years - Living with one parent Native parent 1,970 100.0% NativeForeign-born parent 98 54.0% Native84 46.0% Foreign-born
Grandparents responsible for own grandchildren in Mount Pleasant
Grandparents (30 to 59 years) White / Caucasian 26 46.8% Responsible for grandchildren29 53.2% Not responsible for grandchildrenBlack or African American 111 100.0% Not responsible for grandchildrenWhite alone, not Hispanic / Latino 26 47.4% Responsible for grandchildren29 52.6% Not responsible for grandchildrenGrandparents (60 years and over) White / Caucasian 98 35.5% Responsible for grandchildren178 64.5% Not responsible for grandchildrenBlack or African American 52 100.0% Responsible for grandchildrenWhite alone, not Hispanic / Latino 99 35.2% Responsible for grandchildren183 64.8% Not responsible for grandchildren