Races in Marlborough, Massachusetts (MA) Detailed Stats
Data:
Races - White alone (%)
Races - White alone (% change since 2000)
Races - Black alone (%)
Races - Black alone (% change since 2000)
Races - American Indian alone (%)
Races - American Indian alone (% change since 2000)
Races - Asian alone (%)
Races - Asian alone (% change since 2000)
Races - Hispanic (%)
Races - Hispanic (% change since 2000)
Races - Native Hawaiian and Other Pacific Islander alone (%)
Races - Native Hawaiian and Other Pacific Islander alone (% change since 2000)
Races - Two or more races(%)
Races - Two or more races(% change since 2000)
Races - Other race alone (%)
Races - Other race alone (% change since 2000)
Racial diversity
Place of birth - Born in state of residence (%)
Place of birth - Born in state of residence (%) - White
Place of birth - Born in state of residence (%) - Black or African American
Place of birth - Born in state of residence (%) - Asian
Place of birth - Born in state of residence (%) - Hispanic or Latino
Place of birth - Born in state of residence (%) - American Indian and Alaska Native
Place of birth - Born in state of residence (%) - Multirace
Place of birth - Born in state of residence (%) - Other Race
Place of birth - Born in other state (%)
Place of birth - Born in other state (%) - White
Place of birth - Born in other state (%) - Black or African American
Place of birth - Born in other state (%) - Asian
Place of birth - Born in other state (%) - Hispanic or Latino
Place of birth - Born in other state (%) - American Indian and Alaska Native
Place of birth - Born in other state (%) - Multirace
Place of birth - Born in other state (%) - Other Race
Place of birth - Native, outside of US (%)
Place of birth - Native, outside of US (%) - White
Place of birth - Native, outside of US (%) - Black or African American
Place of birth - Native, outside of US (%) - Asian
Place of birth - Native, outside of US (%) - Hispanic or Latino
Place of birth - Native, outside of US (%) - American Indian and Alaska Native
Place of birth - Native, outside of US (%) - Multirace
Place of birth - Native, outside of US (%) - Other Race
Place of birth - Foreign born (%)
Place of birth - Foreign born (%) - White
Place of birth - Foreign born (%) - Black or African American
Place of birth - Foreign born (%) - Asian
Place of birth - Foreign born (%) - Hispanic or Latino
Place of birth - Foreign born (%) - American Indian and Alaska Native
Place of birth - Foreign born (%) - Multirace
Place of birth - Foreign born (%) - Other Race
Residents speaking English at home (%)
Residents speaking English at home - Born in the United States (%)
Residents speaking English at home - Native, born elsewhere (%)
Residents speaking English at home - Foreign born (%)
Residents speaking Spanish at home (%)
Residents speaking Spanish at home - Born in the United States (%)
Residents speaking Spanish at home - Native, born elsewhere (%)
Residents speaking Spanish at home - Foreign born (%)
Residents speaking other language at home (%)
Residents speaking other language at home - Born in the United States (%)
Residents speaking other language at home - Native, born elsewhere (%)
Residents speaking other language at home - Foreign born (%)
Marital status - Never married (%)
Marital status - Now married (%)
Marital status - Separated (%)
Marital status - Widowed (%)
Marital status - Divorced (%)
Ancestries Reported - Arab (%)
Ancestries Reported - Czech (%)
Ancestries Reported - Danish (%)
Ancestries Reported - Dutch (%)
Ancestries Reported - English (%)
Ancestries Reported - French (%)
Ancestries Reported - French Canadian (%)
Ancestries Reported - German (%)
Ancestries Reported - Greek (%)
Ancestries Reported - Hungarian (%)
Ancestries Reported - Irish (%)
Ancestries Reported - Italian (%)
Ancestries Reported - Lithuanian (%)
Ancestries Reported - Norwegian (%)
Ancestries Reported - Polish (%)
Ancestries Reported - Portuguese (%)
Ancestries Reported - Russian (%)
Ancestries Reported - Scotch-Irish (%)
Ancestries Reported - Scottish (%)
Ancestries Reported - Slovak (%)
Ancestries Reported - Subsaharan African (%)
Ancestries Reported - Swedish (%)
Ancestries Reported - Swiss (%)
Ancestries Reported - Ukrainian (%)
Ancestries Reported - United States (%)
Ancestries Reported - Welsh (%)
Ancestries Reported - West Indian (%)
Ancestries Reported - Other (%)
Geographical mobility - Same house 1 year ago (%)
Geographical mobility - Same house 1 year ago (%) - White
Geographical mobility - Same house 1 year ago (%) - Black or African American
Geographical mobility - Same house 1 year ago (%) - Asian
Geographical mobility - Same house 1 year ago (%) - Hispanic or Latino
Geographical mobility - Same house 1 year ago (%) - American Indian and Alaska Native
Geographical mobility - Same house 1 year ago (%) - Multirace
Geographical mobility - Same house 1 year ago (%) - Other Race
Geographical mobility - Moved within same county (%)
Geographical mobility - Moved within same county (%) - White
Geographical mobility - Moved within same county (%) - Black or African American
Geographical mobility - Moved within same county (%) - Asian
Geographical mobility - Moved within same county (%) - Hispanic or Latino
Geographical mobility - Moved within same county (%) - American Indian and Alaska Native
Geographical mobility - Moved within same county (%) - Multirace
Geographical mobility - Moved within same county (%) - Other Race
Geographical mobility - Moved from different county within same state (%)
Geographical mobility - Moved from different county within same state (%) - White
Geographical mobility - Moved from different county within same state (%) - Black or African American
Geographical mobility - Moved from different county within same state (%) - Asian
Geographical mobility - Moved from different county within same state (%) - Hispanic or Latino
Geographical mobility - Moved from different county within same state (%) - American Indian and Alaska Native
Geographical mobility - Moved from different county within same state (%) - Multirace
Geographical mobility - Moved from different county within same state (%) - Other Race
Geographical mobility - Moved from different state (%)
Geographical mobility - Moved from different state (%) - White
Geographical mobility - Moved from different state (%) - Black or African American
Geographical mobility - Moved from different state (%) - Asian
Geographical mobility - Moved from different state (%) - Hispanic or Latino
Geographical mobility - Moved from different state (%) - American Indian and Alaska Native
Geographical mobility - Moved from different state (%) - Multirace
Geographical mobility - Moved from different state (%) - Other Race
Geographical mobility - Moved from abroad (%)
Geographical mobility - Moved from abroad (%) - White
Geographical mobility - Moved from abroad (%) - Black or African American
Geographical mobility - Moved from abroad (%) - Asian
Geographical mobility - Moved from abroad (%) - Hispanic or Latino
Geographical mobility - Moved from abroad (%) - American Indian and Alaska Native
Geographical mobility - Moved from abroad (%) - Multirace
Geographical mobility - Moved from abroad (%) - Other Race
Place of birth for the foreign-born population - Ireland (%)
Place of birth for the foreign-born population - Denmark (%)
Place of birth for the foreign-born population - Norway (%)
Place of birth for the foreign-born population - Sweden (%)
Place of birth for the foreign-born population - United Kingdom (%)
Place of birth for the foreign-born population - England (%)
Place of birth for the foreign-born population - Scotland (%)
Place of birth for the foreign-born population - Other Northern Europe (%)
Place of birth for the foreign-born population - Austria (%)
Place of birth for the foreign-born population - Belgium (%)
Place of birth for the foreign-born population - France (%)
Place of birth for the foreign-born population - Germany (%)
Place of birth for the foreign-born population - Netherlands (%)
Place of birth for the foreign-born population - Switzerland (%)
Place of birth for the foreign-born population - Other Western Europe (%)
Place of birth for the foreign-born population - Greece (%)
Place of birth for the foreign-born population - Italy (%)
Place of birth for the foreign-born population - Portugal (%)
Place of birth for the foreign-born population - Spain (%)
Place of birth for the foreign-born population - Other Southern Europe (%)
Place of birth for the foreign-born population - Albania (%)
Place of birth for the foreign-born population - Belarus (%)
Place of birth for the foreign-born population - Bosnia and Herzegovina (%)
Place of birth for the foreign-born population - Bulgaria (%)
Place of birth for the foreign-born population - Croatia (%)
Place of birth for the foreign-born population - Czechoslovakia (%)
Place of birth for the foreign-born population - Hungary (%)
Place of birth for the foreign-born population - Latvia (%)
Place of birth for the foreign-born population - Lithuania (%)
Place of birth for the foreign-born population - North Macedonia (Macedonia) (%)
Place of birth for the foreign-born population - Moldova (%)
Place of birth for the foreign-born population - Poland (%)
Place of birth for the foreign-born population - Romania (%)
Place of birth for the foreign-born population - Russia (%)
Place of birth for the foreign-born population - Serbia (%)
Place of birth for the foreign-born population - Ukraine (%)
Place of birth for the foreign-born population - Other Eastern Europe (%)
Place of birth for the foreign-born population - China (%)
Place of birth for the foreign-born population - Hong Kong (%)
Place of birth for the foreign-born population - Taiwan (%)
Place of birth for the foreign-born population - Japan (%)
Place of birth for the foreign-born population - Korea (%)
Place of birth for the foreign-born population - Other Eastern Asia (%)
Place of birth for the foreign-born population - Afghanistan (%)
Place of birth for the foreign-born population - Bangladesh (%)
Place of birth for the foreign-born population - India (%)
Place of birth for the foreign-born population - Iran (%)
Place of birth for the foreign-born population - Kazakhstan (%)
Place of birth for the foreign-born population - Nepal (%)
Place of birth for the foreign-born population - Pakistan (%)
Place of birth for the foreign-born population - Sri Lanka (%)
Place of birth for the foreign-born population - Uzbekistan (%)
Place of birth for the foreign-born population - Other South Central Asia (%)
Place of birth for the foreign-born population - Burma (%)
Place of birth for the foreign-born population - Cambodia (%)
Place of birth for the foreign-born population - Indonesia (%)
Place of birth for the foreign-born population - Laos (%)
Place of birth for the foreign-born population - Malaysia (%)
Place of birth for the foreign-born population - Philippines (%)
Place of birth for the foreign-born population - Singapore (%)
Place of birth for the foreign-born population - Thailand (%)
Place of birth for the foreign-born population - Vietnam (%)
Place of birth for the foreign-born population - Other South Eastern Asia (%)
Place of birth for the foreign-born population - Armenia (%)
Place of birth for the foreign-born population - Iraq (%)
Place of birth for the foreign-born population - Israel (%)
Place of birth for the foreign-born population - Jordan (%)
Place of birth for the foreign-born population - Kuwait (%)
Place of birth for the foreign-born population - Lebanon (%)
Place of birth for the foreign-born population - Saudi Arabia (%)
Place of birth for the foreign-born population - Syria (%)
Place of birth for the foreign-born population - Turkey (%)
Place of birth for the foreign-born population - Yemen (%)
Place of birth for the foreign-born population - Other Western Asia (%)
Place of birth for the foreign-born population - Eritrea (%)
Place of birth for the foreign-born population - Ethiopia (%)
Place of birth for the foreign-born population - Kenya (%)
Place of birth for the foreign-born population - Somalia (%)
Place of birth for the foreign-born population - Uganda (%)
Place of birth for the foreign-born population - Zimbabwe (%)
Place of birth for the foreign-born population - Other Eastern Africa (%)
Place of birth for the foreign-born population - Cameroon (%)
Place of birth for the foreign-born population - Congo (%)
Place of birth for the foreign-born population - Democratic Republic of Congo (Zaire) (%)
Place of birth for the foreign-born population - Other Middle Africa (%)
Place of birth for the foreign-born population - Egypt (%)
Place of birth for the foreign-born population - Morocco (%)
Place of birth for the foreign-born population - Sudan (%)
Place of birth for the foreign-born population - Other Northern Africa (%)
Place of birth for the foreign-born population - South Africa (%)
Place of birth for the foreign-born population - Other Southern Africa (%)
Place of birth for the foreign-born population - Cabo Verde (%)
Place of birth for the foreign-born population - Ghana (%)
Place of birth for the foreign-born population - Liberia (%)
Place of birth for the foreign-born population - Nigeria (%)
Place of birth for the foreign-born population - Senegal (%)
Place of birth for the foreign-born population - Sierra Leone (%)
Place of birth for the foreign-born population - Other Western Africa (%)
Place of birth for the foreign-born population - Australia (%)
Place of birth for the foreign-born population - New Zealand (%)
Place of birth for the foreign-born population - Fiji (%)
Place of birth for the foreign-born population - Micronesia (%)
Place of birth for the foreign-born population - Bahamas (%)
Place of birth for the foreign-born population - Barbados (%)
Place of birth for the foreign-born population - Cuba (%)
Place of birth for the foreign-born population - Dominica (%)
Place of birth for the foreign-born population - Dominican Republic (%)
Place of birth for the foreign-born population - Grenada (%)
Place of birth for the foreign-born population - Haiti (%)
Place of birth for the foreign-born population - Jamaica (%)
Place of birth for the foreign-born population - St. Vincent and the Grenadines (%)
Place of birth for the foreign-born population - Trinidad and Tobago (%)
Place of birth for the foreign-born population - West Indies (%)
Place of birth for the foreign-born population - Other Caribbean (%)
Place of birth for the foreign-born population - Belize (%)
Place of birth for the foreign-born population - Costa Rica (%)
Place of birth for the foreign-born population - El Salvador (%)
Place of birth for the foreign-born population - Guatemala (%)
Place of birth for the foreign-born population - Honduras (%)
Place of birth for the foreign-born population - Mexico (%)
Place of birth for the foreign-born population - Nicaragua (%)
Place of birth for the foreign-born population - Panama (%)
Place of birth for the foreign-born population - Other Central America (%)
Place of birth for the foreign-born population - Argentina (%)
Place of birth for the foreign-born population - Bolivia (%)
Place of birth for the foreign-born population - Brazil (%)
Place of birth for the foreign-born population - Chile (%)
Place of birth for the foreign-born population - Colombia (%)
Place of birth for the foreign-born population - Ecuador (%)
Place of birth for the foreign-born population - Guyana (%)
Place of birth for the foreign-born population - Peru (%)
Place of birth for the foreign-born population - Uruguay (%)
Place of birth for the foreign-born population - Venezuela (%)
Place of birth for the foreign-born population - Other South America (%)
Place of birth for the foreign-born population - Canada (%)
Place of birth for the foreign-born population - Other Northern America (%)
Place of birth for the foreign-born population - Other (%)
Latest news about races in Marlborough, MA collected exclusively by city-data.com from local newspapers, TV, and radio stations
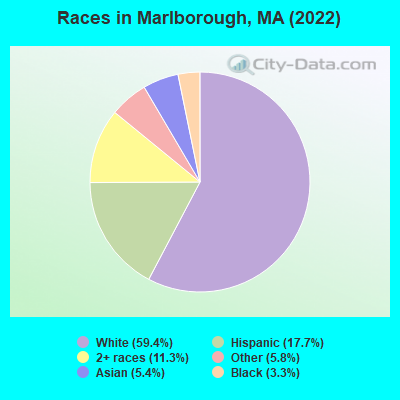
According to 2022 data, the most numerous races in Marlborough, MA are White alone (24,482 residents), Hispanic (7,305 residents), and Asian alone (2,223 residents). 60.0% of Marlborough residents speak English at home. 30.2% of Marlborough, MA residents are foreign-born (20.2% born in Latin America, 4.9% born in Asia), which is 40.5% greater than the foreign-born rate of 18.0% across the entire state of Massachusetts.
Race distribution in Marlborough
2000 2022
5,198,359 81.9% White alone 428,729 6.8% Hispanic 318,329 5.0% Black alone 236,786 3.7% Asian alone 110,338 1.7% Two or more races 43,586 0.7% Other race alone 11,264 0.2% American Indian alone 1,706 0.03% Native Hawaiian and Other
4,676,627 67.0% White alone 911,038 13.0% Hispanic 501,463 7.2% Asian alone 459,740 6.6% Black alone 341,889 4.9% Two or more races 84,403 1.2% Other race alone 5,838 0.08% American Indian alone 976 0.01% Native Hawaiian and Other
Income and house value in Marlborough Median household income in 2022 $93,735 White non-Hispanic householders$121,521 Black householders$96,178 American Indian and Alaska Native householders$116,895 Asian householders$56,014 Some other race householders$104,470 Two or more races householders$70,000 Hispanic or Latino race householdersMedian 2022 house value $484,324 White Non-Hispanic householders$475,630 Black or African American householders $618,063 Asian householders$538,791 Some other race householders$479,465 Two or more races householders$538,791 Hispanic or Latino householders
Median age by race in Marlborough
45.8 Median age for White residents46.7 45.2 37.3 Median age for Black or African American residents39.3 33.9 26.7 Median age for American Indian / Alaska Native residents26.5 35.4 35.6 Median age for Asian residents36.4 35.0 4.2 Median age for Native Hawaiian / Pacific Islander residents-513,131,312.6 -508,717,948.2 28.2 Median age for Other race residents28.8 27.0 36.1 Median age for Two or more races residents36.3 36.6 47.3 Median age for White alone residents48.2 46.7 28.8 Median age for Hispanic or Latino residents29.7 26.9
Owner/renter occupied households by race in Marlborough
House owners and renters - White residents 7,415 64.4% Owner occupied4,099 35.6% Renter occupiedHouse owners and renters - Black or African American residents 170 38.6% Owner occupied270 61.4% Renter occupiedHouse owners and renters - American Indian / Alaska Native residents 44 100.0% Renter occupiedHouse owners and renters - Asian residents 538 57.2% Owner occupied404 42.8% Renter occupiedHouse owners and renters - Native Hawaiian / Pacific Islander residents 17 100.0% Renter occupiedHouse owners and renters - Other race residents 702 34.2% Owner occupied1,351 65.8% Renter occupiedHouse owners and renters - Two or more races residents 1,029 42.5% Owner occupied1,393 57.5% Renter occupiedHouse owners and renters - White alone residents 7,328 65.4% Owner occupied3,884 34.6% Renter occupiedHouse owners and renters - Hispanic or Latino residents 665 31.2% Owner occupied1,467 68.8% Renter occupied
Language usage in Marlborough
English speakers - Total 60.0% of residents of Marlborough speak English at home.
15.1% of residents speak Spanish at home 3,027 52.6% Speak English very well2,726 47.4% Speak English less than very well25.4% of residents speak other language at home 5,385 55.4% Speak English very well4,328 44.6% Speak English less than very well
English speakers - Born in the United States 87.7% of residents of Marlborough speak English at home.
7.7% of residents speak Spanish at home 481 96.6% Speak English very well17 3.4% Speak English less than very well4.2% of residents speak other language at home 231 84.9% Speak English very well41 15.1% Speak English less than very well
English speakers - Native, born elsewhere 37.6% of residents of Marlborough speak English at home.
48.8% of residents speak Spanish at home 243 45.8% Speak English very well287 54.2% Speak English less than very well12.4% of residents speak other language at home 135 100.0% Speak English very well
English speakers - Foreign-born 10.7% of residents of Marlborough speak English at home.
28.7% of residents speak Spanish at home 1,163 33.2% Speak English very well2,341 66.8% Speak English less than very well61.4% of residents speak other language at home 3,470 46.3% Speak English very well4,020 53.7% Speak English less than very well
White (Caucasian) - Speak only English Native:
92.0% (19,313)Foreign-born:
24.0% (731)
White (Caucasian) - Speak another language Native:
7.6% (1,596)Foreign-born:
76.0% (2,313)
Black or African American - Speak only English Native:
79.5% (561)Foreign-born:
46.4% (198)
Black or African American - Speak another language Native:
20.2% (143)Foreign-born:
54.4% (233)
American Indian / Alaska Native - Speak another language Native:
87.7% (48)Foreign-born:
100.0% (47)
Asian - Speak only English Native:
50.8% (183)Foreign-born:
9.7% (154)
Asian - Speak another language Native:
49.2% (177)Foreign-born:
90.5% (1,434)
Other race - Speak only English Native:
14.4% (291)Foreign-born:
2.3% (98)
Other race - Speak another language Native:
77.5% (1,560)Foreign-born:
97.3% (4,234)
Two or more races - Speak only English Native:
54.3% (1,131)Foreign-born:
3.9% (159)
Two or more races - Speak another language Native:
47.8% (996)Foreign-born:
96.4% (3,969)
White alone - Speak only English Native:
92.6% (19,283)Foreign-born:
22.9% (590)
White alone - Speak another language Native:
7.3% (1,527)Foreign-born:
77.4% (1,993)
Hispanic or Latino - Speak only English Native:
20.1% (508)Foreign-born:
5.7% (226)
Hispanic or Latino - Speak another language Native:
76.9% (1,947)Foreign-born:
94.3% (3,750)
Foreign-born residents in Marlborough 12,471 residents are foreign born (20.2% Latin America , 4.9% Asia ).
This city:
30.2%Massachusetts:
17.6%
Marital status for residents in Marlborough Marital status - White (Caucasian) population 15 years and over
Males 31.5% Never married52.2% Now married1.5% Separated3.8% Widowed11.0% DivorcedFemales 32.6% Never married45.2% Now married1.2% Separated7.1% Widowed13.9% DivorcedWomen who gave birth in the past 12 months Now married:
72.4% (273)Unmarried:
27.6% (104)
Women who did not give birth in the past 12 months Now married:
41.4% (2,179)Unmarried:
58.6% (3,084)
Marital status - Black or African American population 15 years and over
Males 30.6% Never married54.9% Now married0.0% Separated3.9% Widowed10.7% DivorcedFemales 50.7% Never married32.1% Now married4.1% Separated6.7% Widowed6.5% DivorcedWomen who gave birth in the past 12 months Now married:
0.0% (0)Unmarried:
100.0% (30)
Women who did not give birth in the past 12 months Now married:
34.6% (142)Unmarried:
65.4% (269)
Marital status - American Indian / Alaska Native population 15 years and over
Males 37.8% Never married28.9% Now married0.0% Separated0.0% Widowed33.3% DivorcedFemales 38.5% Never married30.8% Now married0.0% Separated0.0% Widowed30.8% DivorcedWomen who did not give birth in the past 12 months Now married:
0.0% (0)Unmarried:
100.0% (12)
Marital status - Asian population 15 years and over
Males 40.8% Never married56.9% Now married2.2% Separated0.0% Widowed0.2% DivorcedFemales 18.2% Never married61.3% Now married3.8% Separated9.1% Widowed7.7% DivorcedWomen who gave birth in the past 12 months Now married:
100.0% (13)Unmarried:
0.0% (0)
Women who did not give birth in the past 12 months Now married:
68.1% (319)Unmarried:
31.9% (150)
Marital status - Other race population 15 years and over
Males 32.1% Never married64.4% Now married1.1% Separated0.7% Widowed1.7% DivorcedFemales 36.0% Never married53.6% Now married4.2% Separated0.7% Widowed5.4% DivorcedWomen who gave birth in the past 12 months Now married:
88.0% (316)Unmarried:
12.0% (43)
Women who did not give birth in the past 12 months Now married:
49.1% (970)Unmarried:
50.9% (1,008)
Marital status - Two or more races population 15 years and over
Males 28.7% Never married62.8% Now married2.0% Separated1.4% Widowed5.1% DivorcedFemales 25.8% Never married56.6% Now married2.4% Separated2.3% Widowed13.0% DivorcedWomen who did not give birth in the past 12 months Now married:
61.9% (1,046)Unmarried:
38.1% (645)
Marital status - White alone, not Hispanic / Latino population 15 years and over
Males 29.9% Never married53.1% Now married1.5% Separated4.0% Widowed11.4% DivorcedFemales 31.8% Never married45.4% Now married1.2% Separated7.4% Widowed14.3% DivorcedWomen who gave birth in the past 12 months Now married:
85.1% (262)Unmarried:
14.9% (46)
Women who did not give birth in the past 12 months Now married:
40.8% (2,094)Unmarried:
59.2% (3,034)
Marital status - Hispanic or Latino population 15 years and over
Males 44.9% Never married51.8% Now married1.2% Separated0.8% Widowed1.4% DivorcedFemales 38.7% Never married45.8% Now married5.2% Separated0.9% Widowed9.3% DivorcedWomen who gave birth in the past 12 months Now married:
61.5% (165)Unmarried:
38.5% (104)
Women who did not give birth in the past 12 months Now married:
50.8% (825)Unmarried:
49.2% (799)
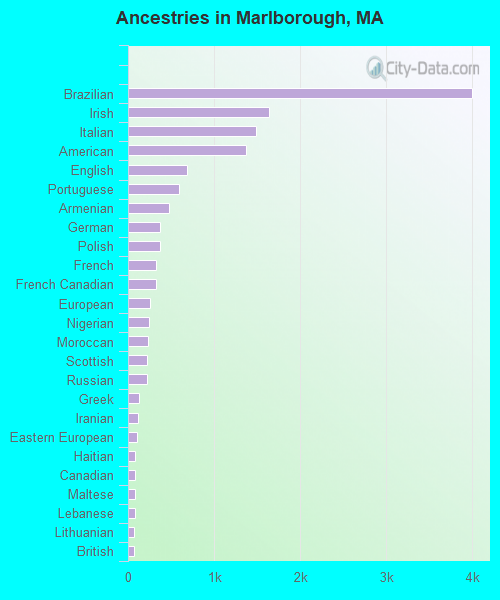
Ancestries in Marlborough
3,997 19.1% Brazilian1,635 7.8% Irish1,487 7.1% Italian1,372 6.6% American687 3.3% English594 2.8% Portuguese481 2.3% Armenian377 1.8% German371 1.8% Polish330 1.6% French330 1.6% French Canadian255 1.2% European243 1.2% Nigerian236 1.1% Moroccan220 1.1% Scottish217 1.0% Russian123 0.6% Greek120 0.6% Iranian107 0.5% Eastern European87 0.4% Haitian85 0.4% Canadian82 0.4% Maltese78 0.4% Lebanese69 0.3% Lithuanian65 0.3% British47 0.2% Cape Verdean47 0.2% Swedish43 0.2% Ukrainian41 0.2% Australian41 0.2% Norwegian40 0.2% Scotch-Irish39 0.2% Liberian38 0.2% South African33 0.2% Ghanaian32 0.2% Northern European32 0.2% Welsh29 0.1% Israeli21 0.1% Danish21 0.1% Swiss21 0.1% Slovene21 0.1% Slovak18 0.09% Finnish16 0.08% Austrian14 0.07% Hungarian13 0.06% Dutch13 0.06% Syrian9 0.04% Belgian9 0.04% Slavic9 0.04% African7 0.03% British West Indian
Geographical mobility in Marlborough Same house 1 year ago 22,073 88.3% White (Caucasian)1,242 94.0% Black or African American118 87.5% American Indian / Alaska Native1,901 85.6% Asian5,116 77.0% Other race5,301 79.2% Two or more races21,350 88.1% White alone, not Hispanic / Latino5,405 76.8% Hispanic or LatinoMoved within same county 1,992 8.0% White / Caucasian47 3.6% Black or African American13 9.9% American Indian / Alaska Native60 2.7% Asian53 94.6% Native Hawaiian / Pacific Islander1,301 19.6% Other race604 9.0% Two or more races1,983 8.2% White alone, not Hispanic / Latino1,288 18.3% Hispanic or LatinoMoved within same state 554 2.2% White / Caucasian44 3.3% Black or African American55 2.5% Asian61 0.9% Other race155 2.3% Two or more races536 2.2% White alone, not Hispanic / Latino78 1.1% Hispanic or LatinoMoved from different state 285 1.1% White / Caucasian22 1.6% Black or African American128 5.8% Asian141 2.1% Two or more races281 1.2% White alone, not Hispanic / Latino79 1.1% Hispanic or LatinoMoved from abroad 22 0.1% White91 4.1% Asian29 0.4% Other race648 9.7% Two or more races21 0.1% White alone, not Hispanic / Latino52 0.7% Hispanic or Latino
Children Nativity (place of birth) in Marlborough
Children under 6 years - Living with two parents Both parents native 994 100.0% NativeBoth parents foreign-born 918 73.6% Native330 26.4% Foreign-bornOne native, one foreign-born parent 377 100.0% NativeChildren under 6 years - Living with one parent Native parent 466 100.0% NativeForeign-born parent 392 90.8% Native40 9.2% Foreign-bornChildren 6 to 17 years - Living with two parents Both parents native 1,409 100.0% NativeBoth parents foreign-born 1,032 77.3% Native303 22.7% Foreign-bornOne native, one foreign-born parent 371 98.8% Native5 1.2% Foreign-bornChildren 6 to 17 years - Living with one parent Native parent 348 100.0% NativeForeign-born parent 567 63.0% Native332 37.0% Foreign-born
Place of birth for residents in Marlborough 8,797 Americas8,642 Latin America5,466 South America2,833 Central America2,100 Asia1,250 South Central Asia1,035 Europe493 Eastern Europe488 Africa430 Eastern Asia342 Caribbean334 Western Asia306 China297 Northern Europe281 Western Africa155 Northern America131 Southern Europe112 Western Europe85 South Eastern Asia77 Eastern Africa71 Northern Africa57 Southern Africa49 Oceania49 Australia and New Zealand Subregion4,715 Brazil2,431 Guatemala1,070 India342 Colombia257 Armenia255 China239 Mexico187 Nigeria173 Russia169 Dominican Republic155 Canada148 Iran144 Peru136 Bolivia123 Haiti113 England112 United Kingdom100 Poland92 Japan80 Portugal75 Lithuania71 Morocco63 Honduras59 Uganda58 Ireland56 Philippines56 Ukraine54 Chile54 El Salvador49 Australia48 Germany48 Belarus44 Costa Rica44 Ghana41 South Africa41 Argentina41 Lebanon37 Jamaica37 Hong Kong32 Italy32 Korea31 Liberia31 Pakistan28 Vietnam25 France23 Azores Islands23 Hungary18 Greece18 Cabo Verde18 United Arab Emirates17 Tanzania17 Uruguay16 Israel14 Austria13 Taiwan13 Czechoslovakia13 Ecuador12 Switzerland12 Denmark12 St. Lucia11 Belgium1 Romania
Grandparents responsible for own grandchildren in Marlborough
Grandparents (30 to 59 years) White / Caucasian 64 19.5% Responsible for grandchildren264 80.5% Not responsible for grandchildrenOther race 101 100.0% Not responsible for grandchildrenTwo or more races 32 100.0% Responsible for grandchildrenWhite alone, not Hispanic / Latino 72 29.6% Responsible for grandchildren172 70.4% Not responsible for grandchildrenHispanic or Latino 53 37.0% Responsible for grandchildren90 63.0% Not responsible for grandchildrenGrandparents (60 years and over) White / Caucasian 186 100.0% Not responsible for grandchildrenOther race 99 74.8% Responsible for grandchildren34 25.2% Not responsible for grandchildrenTwo or more races 88 57.8% Responsible for grandchildren64 42.2% Not responsible for grandchildrenWhite alone, not Hispanic / Latino 184 100.0% Not responsible for grandchildrenHispanic or Latino 93 68.8% Responsible for grandchildren42 31.2% Not responsible for grandchildren