Races in Los Lunas, New Mexico (NM) Detailed Stats
Data:
Races - White alone (%)
Races - White alone (% change since 2000)
Races - Black alone (%)
Races - Black alone (% change since 2000)
Races - American Indian alone (%)
Races - American Indian alone (% change since 2000)
Races - Asian alone (%)
Races - Asian alone (% change since 2000)
Races - Hispanic (%)
Races - Hispanic (% change since 2000)
Races - Native Hawaiian and Other Pacific Islander alone (%)
Races - Native Hawaiian and Other Pacific Islander alone (% change since 2000)
Races - Two or more races(%)
Races - Two or more races(% change since 2000)
Races - Other race alone (%)
Races - Other race alone (% change since 2000)
Racial diversity
Place of birth - Born in state of residence (%)
Place of birth - Born in state of residence (%) - White
Place of birth - Born in state of residence (%) - Black or African American
Place of birth - Born in state of residence (%) - Asian
Place of birth - Born in state of residence (%) - Hispanic or Latino
Place of birth - Born in state of residence (%) - American Indian and Alaska Native
Place of birth - Born in state of residence (%) - Multirace
Place of birth - Born in state of residence (%) - Other Race
Place of birth - Born in other state (%)
Place of birth - Born in other state (%) - White
Place of birth - Born in other state (%) - Black or African American
Place of birth - Born in other state (%) - Asian
Place of birth - Born in other state (%) - Hispanic or Latino
Place of birth - Born in other state (%) - American Indian and Alaska Native
Place of birth - Born in other state (%) - Multirace
Place of birth - Born in other state (%) - Other Race
Place of birth - Native, outside of US (%)
Place of birth - Native, outside of US (%) - White
Place of birth - Native, outside of US (%) - Black or African American
Place of birth - Native, outside of US (%) - Asian
Place of birth - Native, outside of US (%) - Hispanic or Latino
Place of birth - Native, outside of US (%) - American Indian and Alaska Native
Place of birth - Native, outside of US (%) - Multirace
Place of birth - Native, outside of US (%) - Other Race
Place of birth - Foreign born (%)
Place of birth - Foreign born (%) - White
Place of birth - Foreign born (%) - Black or African American
Place of birth - Foreign born (%) - Asian
Place of birth - Foreign born (%) - Hispanic or Latino
Place of birth - Foreign born (%) - American Indian and Alaska Native
Place of birth - Foreign born (%) - Multirace
Place of birth - Foreign born (%) - Other Race
Residents speaking English at home (%)
Residents speaking English at home - Born in the United States (%)
Residents speaking English at home - Native, born elsewhere (%)
Residents speaking English at home - Foreign born (%)
Residents speaking Spanish at home (%)
Residents speaking Spanish at home - Born in the United States (%)
Residents speaking Spanish at home - Native, born elsewhere (%)
Residents speaking Spanish at home - Foreign born (%)
Residents speaking other language at home (%)
Residents speaking other language at home - Born in the United States (%)
Residents speaking other language at home - Native, born elsewhere (%)
Residents speaking other language at home - Foreign born (%)
Marital status - Never married (%)
Marital status - Now married (%)
Marital status - Separated (%)
Marital status - Widowed (%)
Marital status - Divorced (%)
Ancestries Reported - Arab (%)
Ancestries Reported - Czech (%)
Ancestries Reported - Danish (%)
Ancestries Reported - Dutch (%)
Ancestries Reported - English (%)
Ancestries Reported - French (%)
Ancestries Reported - French Canadian (%)
Ancestries Reported - German (%)
Ancestries Reported - Greek (%)
Ancestries Reported - Hungarian (%)
Ancestries Reported - Irish (%)
Ancestries Reported - Italian (%)
Ancestries Reported - Lithuanian (%)
Ancestries Reported - Norwegian (%)
Ancestries Reported - Polish (%)
Ancestries Reported - Portuguese (%)
Ancestries Reported - Russian (%)
Ancestries Reported - Scotch-Irish (%)
Ancestries Reported - Scottish (%)
Ancestries Reported - Slovak (%)
Ancestries Reported - Subsaharan African (%)
Ancestries Reported - Swedish (%)
Ancestries Reported - Swiss (%)
Ancestries Reported - Ukrainian (%)
Ancestries Reported - United States (%)
Ancestries Reported - Welsh (%)
Ancestries Reported - West Indian (%)
Ancestries Reported - Other (%)
Geographical mobility - Same house 1 year ago (%)
Geographical mobility - Same house 1 year ago (%) - White
Geographical mobility - Same house 1 year ago (%) - Black or African American
Geographical mobility - Same house 1 year ago (%) - Asian
Geographical mobility - Same house 1 year ago (%) - Hispanic or Latino
Geographical mobility - Same house 1 year ago (%) - American Indian and Alaska Native
Geographical mobility - Same house 1 year ago (%) - Multirace
Geographical mobility - Same house 1 year ago (%) - Other Race
Geographical mobility - Moved within same county (%)
Geographical mobility - Moved within same county (%) - White
Geographical mobility - Moved within same county (%) - Black or African American
Geographical mobility - Moved within same county (%) - Asian
Geographical mobility - Moved within same county (%) - Hispanic or Latino
Geographical mobility - Moved within same county (%) - American Indian and Alaska Native
Geographical mobility - Moved within same county (%) - Multirace
Geographical mobility - Moved within same county (%) - Other Race
Geographical mobility - Moved from different county within same state (%)
Geographical mobility - Moved from different county within same state (%) - White
Geographical mobility - Moved from different county within same state (%) - Black or African American
Geographical mobility - Moved from different county within same state (%) - Asian
Geographical mobility - Moved from different county within same state (%) - Hispanic or Latino
Geographical mobility - Moved from different county within same state (%) - American Indian and Alaska Native
Geographical mobility - Moved from different county within same state (%) - Multirace
Geographical mobility - Moved from different county within same state (%) - Other Race
Geographical mobility - Moved from different state (%)
Geographical mobility - Moved from different state (%) - White
Geographical mobility - Moved from different state (%) - Black or African American
Geographical mobility - Moved from different state (%) - Asian
Geographical mobility - Moved from different state (%) - Hispanic or Latino
Geographical mobility - Moved from different state (%) - American Indian and Alaska Native
Geographical mobility - Moved from different state (%) - Multirace
Geographical mobility - Moved from different state (%) - Other Race
Geographical mobility - Moved from abroad (%)
Geographical mobility - Moved from abroad (%) - White
Geographical mobility - Moved from abroad (%) - Black or African American
Geographical mobility - Moved from abroad (%) - Asian
Geographical mobility - Moved from abroad (%) - Hispanic or Latino
Geographical mobility - Moved from abroad (%) - American Indian and Alaska Native
Geographical mobility - Moved from abroad (%) - Multirace
Geographical mobility - Moved from abroad (%) - Other Race
Place of birth for the foreign-born population - Ireland (%)
Place of birth for the foreign-born population - Denmark (%)
Place of birth for the foreign-born population - Norway (%)
Place of birth for the foreign-born population - Sweden (%)
Place of birth for the foreign-born population - United Kingdom (%)
Place of birth for the foreign-born population - England (%)
Place of birth for the foreign-born population - Scotland (%)
Place of birth for the foreign-born population - Other Northern Europe (%)
Place of birth for the foreign-born population - Austria (%)
Place of birth for the foreign-born population - Belgium (%)
Place of birth for the foreign-born population - France (%)
Place of birth for the foreign-born population - Germany (%)
Place of birth for the foreign-born population - Netherlands (%)
Place of birth for the foreign-born population - Switzerland (%)
Place of birth for the foreign-born population - Other Western Europe (%)
Place of birth for the foreign-born population - Greece (%)
Place of birth for the foreign-born population - Italy (%)
Place of birth for the foreign-born population - Portugal (%)
Place of birth for the foreign-born population - Spain (%)
Place of birth for the foreign-born population - Other Southern Europe (%)
Place of birth for the foreign-born population - Albania (%)
Place of birth for the foreign-born population - Belarus (%)
Place of birth for the foreign-born population - Bosnia and Herzegovina (%)
Place of birth for the foreign-born population - Bulgaria (%)
Place of birth for the foreign-born population - Croatia (%)
Place of birth for the foreign-born population - Czechoslovakia (%)
Place of birth for the foreign-born population - Hungary (%)
Place of birth for the foreign-born population - Latvia (%)
Place of birth for the foreign-born population - Lithuania (%)
Place of birth for the foreign-born population - North Macedonia (Macedonia) (%)
Place of birth for the foreign-born population - Moldova (%)
Place of birth for the foreign-born population - Poland (%)
Place of birth for the foreign-born population - Romania (%)
Place of birth for the foreign-born population - Russia (%)
Place of birth for the foreign-born population - Serbia (%)
Place of birth for the foreign-born population - Ukraine (%)
Place of birth for the foreign-born population - Other Eastern Europe (%)
Place of birth for the foreign-born population - China (%)
Place of birth for the foreign-born population - Hong Kong (%)
Place of birth for the foreign-born population - Taiwan (%)
Place of birth for the foreign-born population - Japan (%)
Place of birth for the foreign-born population - Korea (%)
Place of birth for the foreign-born population - Other Eastern Asia (%)
Place of birth for the foreign-born population - Afghanistan (%)
Place of birth for the foreign-born population - Bangladesh (%)
Place of birth for the foreign-born population - India (%)
Place of birth for the foreign-born population - Iran (%)
Place of birth for the foreign-born population - Kazakhstan (%)
Place of birth for the foreign-born population - Nepal (%)
Place of birth for the foreign-born population - Pakistan (%)
Place of birth for the foreign-born population - Sri Lanka (%)
Place of birth for the foreign-born population - Uzbekistan (%)
Place of birth for the foreign-born population - Other South Central Asia (%)
Place of birth for the foreign-born population - Burma (%)
Place of birth for the foreign-born population - Cambodia (%)
Place of birth for the foreign-born population - Indonesia (%)
Place of birth for the foreign-born population - Laos (%)
Place of birth for the foreign-born population - Malaysia (%)
Place of birth for the foreign-born population - Philippines (%)
Place of birth for the foreign-born population - Singapore (%)
Place of birth for the foreign-born population - Thailand (%)
Place of birth for the foreign-born population - Vietnam (%)
Place of birth for the foreign-born population - Other South Eastern Asia (%)
Place of birth for the foreign-born population - Armenia (%)
Place of birth for the foreign-born population - Iraq (%)
Place of birth for the foreign-born population - Israel (%)
Place of birth for the foreign-born population - Jordan (%)
Place of birth for the foreign-born population - Kuwait (%)
Place of birth for the foreign-born population - Lebanon (%)
Place of birth for the foreign-born population - Saudi Arabia (%)
Place of birth for the foreign-born population - Syria (%)
Place of birth for the foreign-born population - Turkey (%)
Place of birth for the foreign-born population - Yemen (%)
Place of birth for the foreign-born population - Other Western Asia (%)
Place of birth for the foreign-born population - Eritrea (%)
Place of birth for the foreign-born population - Ethiopia (%)
Place of birth for the foreign-born population - Kenya (%)
Place of birth for the foreign-born population - Somalia (%)
Place of birth for the foreign-born population - Uganda (%)
Place of birth for the foreign-born population - Zimbabwe (%)
Place of birth for the foreign-born population - Other Eastern Africa (%)
Place of birth for the foreign-born population - Cameroon (%)
Place of birth for the foreign-born population - Congo (%)
Place of birth for the foreign-born population - Democratic Republic of Congo (Zaire) (%)
Place of birth for the foreign-born population - Other Middle Africa (%)
Place of birth for the foreign-born population - Egypt (%)
Place of birth for the foreign-born population - Morocco (%)
Place of birth for the foreign-born population - Sudan (%)
Place of birth for the foreign-born population - Other Northern Africa (%)
Place of birth for the foreign-born population - South Africa (%)
Place of birth for the foreign-born population - Other Southern Africa (%)
Place of birth for the foreign-born population - Cabo Verde (%)
Place of birth for the foreign-born population - Ghana (%)
Place of birth for the foreign-born population - Liberia (%)
Place of birth for the foreign-born population - Nigeria (%)
Place of birth for the foreign-born population - Senegal (%)
Place of birth for the foreign-born population - Sierra Leone (%)
Place of birth for the foreign-born population - Other Western Africa (%)
Place of birth for the foreign-born population - Australia (%)
Place of birth for the foreign-born population - New Zealand (%)
Place of birth for the foreign-born population - Fiji (%)
Place of birth for the foreign-born population - Micronesia (%)
Place of birth for the foreign-born population - Bahamas (%)
Place of birth for the foreign-born population - Barbados (%)
Place of birth for the foreign-born population - Cuba (%)
Place of birth for the foreign-born population - Dominica (%)
Place of birth for the foreign-born population - Dominican Republic (%)
Place of birth for the foreign-born population - Grenada (%)
Place of birth for the foreign-born population - Haiti (%)
Place of birth for the foreign-born population - Jamaica (%)
Place of birth for the foreign-born population - St. Vincent and the Grenadines (%)
Place of birth for the foreign-born population - Trinidad and Tobago (%)
Place of birth for the foreign-born population - West Indies (%)
Place of birth for the foreign-born population - Other Caribbean (%)
Place of birth for the foreign-born population - Belize (%)
Place of birth for the foreign-born population - Costa Rica (%)
Place of birth for the foreign-born population - El Salvador (%)
Place of birth for the foreign-born population - Guatemala (%)
Place of birth for the foreign-born population - Honduras (%)
Place of birth for the foreign-born population - Mexico (%)
Place of birth for the foreign-born population - Nicaragua (%)
Place of birth for the foreign-born population - Panama (%)
Place of birth for the foreign-born population - Other Central America (%)
Place of birth for the foreign-born population - Argentina (%)
Place of birth for the foreign-born population - Bolivia (%)
Place of birth for the foreign-born population - Brazil (%)
Place of birth for the foreign-born population - Chile (%)
Place of birth for the foreign-born population - Colombia (%)
Place of birth for the foreign-born population - Ecuador (%)
Place of birth for the foreign-born population - Guyana (%)
Place of birth for the foreign-born population - Peru (%)
Place of birth for the foreign-born population - Uruguay (%)
Place of birth for the foreign-born population - Venezuela (%)
Place of birth for the foreign-born population - Other South America (%)
Place of birth for the foreign-born population - Canada (%)
Place of birth for the foreign-born population - Other Northern America (%)
Place of birth for the foreign-born population - Other (%)
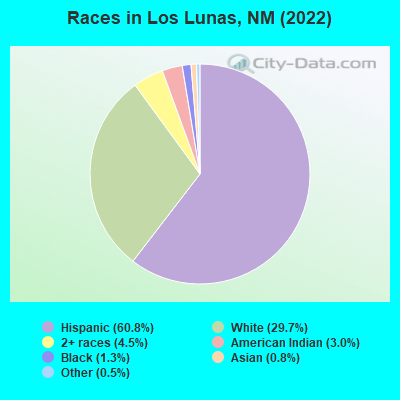
According to 2022 data, the most numerous races in Los Lunas, NM are Hispanic (10,618 residents), White alone (5,187 residents), and American Indian alone (518 residents). 77.9% of Los Lunas residents speak English at home. 4.6% of Los Lunas, NM residents are foreign-born (2.6% born in Latin America, 0.9% born in Africa, 0.8% born in Asia), which is 94.7% less than the foreign-born rate of 9.0% across the entire state of New Mexico.
Race distribution in Los Lunas
2000 2022
813,495 44.7% White alone 765,386 42.1% Hispanic 161,460 8.9% American Indian alone 30,654 1.7% Black alone 25,793 1.4% Two or more races 18,257 1.0% Asian alone 3,009 0.2% Other race alone 992 0.05% Native Hawaiian and Other
1,059,867 50.2% Hispanic 735,478 34.8% White alone 171,808 8.1% American Indian alone 65,084 3.1% Two or more races 36,870 1.7% Black alone 35,870 1.7% Asian alone 7,582 0.4% Other race alone 785 0.04% Native Hawaiian and Other
Income and house value in Los Lunas Median household income in 2022 $72,893 White non-Hispanic householders$95,289 American Indian and Alaska Native householders$41,115 Some other race householders$59,796 Two or more races householders$48,010 Hispanic or Latino race householdersMedian 2022 house value $256,268 White Non-Hispanic householders$683,547 Black or African American householders$202,330 American Indian or Alaska Native householders$234,394 Some other race householders$259,996 Two or more races householders$245,828 Hispanic or Latino householders
Median age by race in Los Lunas
37.5 Median age for White residents32.5 42.8 19.2 Median age for Black or African American residents68.0 9.6 30.3 Median age for American Indian / Alaska Native residents31.2 25.2 31.7 Median age for Asian residents28.8 38.3 -666,666,666.0 Median age for Native Hawaiian / Pacific Islander residents-666,666,666.0 -666,666,666.0 43.5 Median age for Other race residents45.0 40.8 44.4 Median age for Two or more races residents41.5 42.5 49.2 Median age for White alone residents44.8 51.6 36.6 Median age for Hispanic or Latino residents33.4 39.0
Owner/renter occupied households by race in Los Lunas
House owners and renters - White residents 3,006 82.8% Owner occupied623 17.2% Renter occupiedHouse owners and renters - Black or African American residents 43 100.0% Owner occupiedHouse owners and renters - American Indian / Alaska Native residents 105 67.8% Owner occupied50 32.2% Renter occupiedHouse owners and renters - Asian residents 86 85.2% Owner occupied15 14.8% Renter occupiedHouse owners and renters - Other race residents 589 88.1% Owner occupied79 11.9% Renter occupiedHouse owners and renters - Two or more races residents 1,995 84.4% Owner occupied368 15.6% Renter occupiedHouse owners and renters - White alone residents 2,345 86.8% Owner occupied358 13.2% Renter occupiedHouse owners and renters - Hispanic or Latino residents 2,955 81.5% Owner occupied673 18.5% Renter occupied
Language usage in Los Lunas
English speakers - Total 77.9% of residents of Los Lunas speak English at home.
19.0% of residents speak Spanish at home 2,214 70.3% Speak English very well937 29.7% Speak English less than very well3.2% of residents speak other language at home 224 41.9% Speak English very well310 58.1% Speak English less than very well
English speakers - Born in the United States 87.4% of residents of Los Lunas speak English at home.
11.4% of residents speak Spanish at home 409 79.6% Speak English very well105 20.4% Speak English less than very well3.4% of residents speak other language at home 147 97.4% Speak English very well4 2.6% Speak English less than very well
English speakers - Native, born elsewhere 73.9% of residents of Los Lunas speak English at home.
22.2% of residents speak Spanish at home 58 100.0% Speak English very well
English speakers - Foreign-born 6.2% of residents of Los Lunas speak English at home.
58.0% of residents speak Spanish at home 181 30.7% Speak English very well408 69.3% Speak English less than very well31.1% of residents speak other language at home 59 18.7% Speak English very well257 81.3% Speak English less than very well
White (Caucasian) - Speak only English Native:
94.0% (7,985)Foreign-born:
12.2% (13)
White (Caucasian) - Speak another language Native:
8.0% (681)Foreign-born:
100.0% (104)
Black or African American - Speak another language Native:
7.8% (8)Foreign-born:
76.6% (98)
Asian - Speak only English Native:
100.0% (61)Foreign-born:
37.6% (52)
Other race - Speak another language Native:
27.4% (482)Foreign-born:
100.0% (105)
Two or more races - Speak only English Native:
69.3% (2,815)Foreign-born:
5.1% (20)
Two or more races - Speak another language Native:
30.6% (1,243)Foreign-born:
92.4% (361)
White alone - Speak only English Native:
98.0% (4,784)Foreign-born:
42.8% (16)
White alone - Speak another language Native:
2.2% (106)Foreign-born:
56.2% (21)
Hispanic or Latino - Speak another language Native:
25.8% (2,394)Foreign-born:
100.0% (583)
Foreign-born residents in Los Lunas 822 residents are foreign born (2.6% Latin America , 0.9% Africa , 0.8% Asia ).
This city:
4.6%New Mexico:
9.2%
Marital status for residents in Los Lunas Marital status - White (Caucasian) population 15 years and over
Males 34.2% Never married47.9% Now married0.8% Separated1.9% Widowed15.3% DivorcedFemales 33.0% Never married40.5% Now married1.6% Separated8.9% Widowed15.9% DivorcedWomen who gave birth in the past 12 months Now married:
29.3% (59)Unmarried:
70.7% (143)
Women who did not give birth in the past 12 months Now married:
34.8% (614)Unmarried:
65.2% (1,149)
Marital status - Black or African American population 15 years and over
Males 9.7% Never married68.8% Now married0.0% Separated0.0% Widowed21.5% DivorcedFemales 0.0% Never married100.0% Now married0.0% Separated0.0% Widowed0.0% DivorcedWomen who did not give birth in the past 12 months Now married:
100.0% (33)Unmarried:
0.0% (0)
Marital status - American Indian / Alaska Native population 15 years and over
Males 27.0% Never married61.5% Now married0.0% Separated0.0% Widowed11.5% DivorcedFemales 45.7% Never married43.9% Now married0.0% Separated0.0% Widowed10.4% DivorcedWomen who did not give birth in the past 12 months Now married:
46.5% (121)Unmarried:
53.5% (140)
Marital status - Asian population 15 years and over
Males 100.0% Never married0.0% Now married0.0% Separated0.0% Widowed0.0% DivorcedFemales 60.0% Never married40.0% Now married0.0% Separated0.0% Widowed0.0% DivorcedWomen who did not give birth in the past 12 months Now married:
18.2% (7)Unmarried:
81.8% (32)
Marital status - Other race population 15 years and over
Males 27.6% Never married49.5% Now married0.0% Separated11.0% Widowed11.9% DivorcedFemales 20.7% Never married56.1% Now married2.3% Separated4.8% Widowed16.1% DivorcedWomen who did not give birth in the past 12 months Now married:
59.2% (262)Unmarried:
40.8% (181)
Marital status - Two or more races population 15 years and over
Males 29.7% Never married51.7% Now married0.0% Separated7.7% Widowed10.9% DivorcedFemales 51.6% Never married24.8% Now married8.0% Separated11.1% Widowed4.5% DivorcedWomen who gave birth in the past 12 months Now married:
30.2% (44)Unmarried:
69.8% (102)
Women who did not give birth in the past 12 months Now married:
33.1% (362)Unmarried:
66.9% (730)
Marital status - White alone, not Hispanic / Latino population 15 years and over
Males 24.1% Never married50.4% Now married0.6% Separated3.1% Widowed21.9% DivorcedFemales 19.7% Never married45.4% Now married1.7% Separated11.5% Widowed21.7% DivorcedWomen who gave birth in the past 12 months Now married:
38.6% (64)Unmarried:
61.4% (103)
Women who did not give birth in the past 12 months Now married:
40.2% (352)Unmarried:
59.8% (523)
Marital status - Hispanic or Latino population 15 years and over
Males 38.5% Never married46.3% Now married0.6% Separated3.6% Widowed11.0% DivorcedFemales 46.1% Never married35.6% Now married4.0% Separated5.8% Widowed8.5% DivorcedWomen who gave birth in the past 12 months Now married:
33.1% (46)Unmarried:
66.9% (94)
Women who did not give birth in the past 12 months Now married:
35.6% (929)Unmarried:
64.4% (1,682)
Ancestries in Los Lunas
349 3.7% English307 3.3% American254 2.7% Irish251 2.7% German148 1.6% African123 1.3% Scotch-Irish114 1.2% Italian100 1.1% Polish84 0.9% European71 0.8% Scottish55 0.6% French Canadian48 0.5% Afghan42 0.5% Norwegian32 0.3% Iranian21 0.2% Greek20 0.2% Celtic19 0.2% Eastern European18 0.2% Swedish16 0.2% Welsh11 0.1% Dutch8 0.09% French6 0.06% Canadian5 0.05% Austrian
Children Nativity (place of birth) in Los Lunas
Children under 6 years - Living with two parents Both parents native 703 100.0% NativeBoth parents foreign-born 75 100.0% NativeChildren under 6 years - Living with one parent Native parent 659 100.0% NativeChildren 6 to 17 years - Living with two parents Both parents native 1,323 100.0% Native1 0.0% Foreign-bornBoth parents foreign-born 78 71.4% Native31 28.6% Foreign-bornOne native, one foreign-born parent 22 100.0% NativeChildren 6 to 17 years - Living with one parent Native parent 1,141 100.0% Native
Grandparents responsible for own grandchildren in Los Lunas
Grandparents (30 to 59 years) White / Caucasian 71 55.7% Responsible for grandchildren57 44.3% Not responsible for grandchildrenOther race 15 100.0% Responsible for grandchildrenTwo or more races 74 100.0% Not responsible for grandchildrenWhite alone, not Hispanic / Latino 37 54.1% Responsible for grandchildren32 45.9% Not responsible for grandchildrenHispanic or Latino 24 24.8% Responsible for grandchildren73 75.2% Not responsible for grandchildrenGrandparents (60 years and over) White / Caucasian 8 49.8% Responsible for grandchildren8 50.2% Not responsible for grandchildrenTwo or more races 56 100.0% Not responsible for grandchildrenWhite alone, not Hispanic / Latino 13 100.0% Not responsible for grandchildrenHispanic or Latino 9 13.7% Responsible for grandchildren57 86.3% Not responsible for grandchildren