Races in Hopkinsville, Kentucky (KY) Detailed Stats
Data:
Races - White alone (%)
Races - White alone (% change since 2000)
Races - Black alone (%)
Races - Black alone (% change since 2000)
Races - American Indian alone (%)
Races - American Indian alone (% change since 2000)
Races - Asian alone (%)
Races - Asian alone (% change since 2000)
Races - Hispanic (%)
Races - Hispanic (% change since 2000)
Races - Native Hawaiian and Other Pacific Islander alone (%)
Races - Native Hawaiian and Other Pacific Islander alone (% change since 2000)
Races - Two or more races(%)
Races - Two or more races(% change since 2000)
Races - Other race alone (%)
Races - Other race alone (% change since 2000)
Racial diversity
Place of birth - Born in state of residence (%)
Place of birth - Born in state of residence (%) - White
Place of birth - Born in state of residence (%) - Black or African American
Place of birth - Born in state of residence (%) - Asian
Place of birth - Born in state of residence (%) - Hispanic or Latino
Place of birth - Born in state of residence (%) - American Indian and Alaska Native
Place of birth - Born in state of residence (%) - Multirace
Place of birth - Born in state of residence (%) - Other Race
Place of birth - Born in other state (%)
Place of birth - Born in other state (%) - White
Place of birth - Born in other state (%) - Black or African American
Place of birth - Born in other state (%) - Asian
Place of birth - Born in other state (%) - Hispanic or Latino
Place of birth - Born in other state (%) - American Indian and Alaska Native
Place of birth - Born in other state (%) - Multirace
Place of birth - Born in other state (%) - Other Race
Place of birth - Native, outside of US (%)
Place of birth - Native, outside of US (%) - White
Place of birth - Native, outside of US (%) - Black or African American
Place of birth - Native, outside of US (%) - Asian
Place of birth - Native, outside of US (%) - Hispanic or Latino
Place of birth - Native, outside of US (%) - American Indian and Alaska Native
Place of birth - Native, outside of US (%) - Multirace
Place of birth - Native, outside of US (%) - Other Race
Place of birth - Foreign born (%)
Place of birth - Foreign born (%) - White
Place of birth - Foreign born (%) - Black or African American
Place of birth - Foreign born (%) - Asian
Place of birth - Foreign born (%) - Hispanic or Latino
Place of birth - Foreign born (%) - American Indian and Alaska Native
Place of birth - Foreign born (%) - Multirace
Place of birth - Foreign born (%) - Other Race
Residents speaking English at home (%)
Residents speaking English at home - Born in the United States (%)
Residents speaking English at home - Native, born elsewhere (%)
Residents speaking English at home - Foreign born (%)
Residents speaking Spanish at home (%)
Residents speaking Spanish at home - Born in the United States (%)
Residents speaking Spanish at home - Native, born elsewhere (%)
Residents speaking Spanish at home - Foreign born (%)
Residents speaking other language at home (%)
Residents speaking other language at home - Born in the United States (%)
Residents speaking other language at home - Native, born elsewhere (%)
Residents speaking other language at home - Foreign born (%)
Marital status - Never married (%)
Marital status - Now married (%)
Marital status - Separated (%)
Marital status - Widowed (%)
Marital status - Divorced (%)
Ancestries Reported - Arab (%)
Ancestries Reported - Czech (%)
Ancestries Reported - Danish (%)
Ancestries Reported - Dutch (%)
Ancestries Reported - English (%)
Ancestries Reported - French (%)
Ancestries Reported - French Canadian (%)
Ancestries Reported - German (%)
Ancestries Reported - Greek (%)
Ancestries Reported - Hungarian (%)
Ancestries Reported - Irish (%)
Ancestries Reported - Italian (%)
Ancestries Reported - Lithuanian (%)
Ancestries Reported - Norwegian (%)
Ancestries Reported - Polish (%)
Ancestries Reported - Portuguese (%)
Ancestries Reported - Russian (%)
Ancestries Reported - Scotch-Irish (%)
Ancestries Reported - Scottish (%)
Ancestries Reported - Slovak (%)
Ancestries Reported - Subsaharan African (%)
Ancestries Reported - Swedish (%)
Ancestries Reported - Swiss (%)
Ancestries Reported - Ukrainian (%)
Ancestries Reported - United States (%)
Ancestries Reported - Welsh (%)
Ancestries Reported - West Indian (%)
Ancestries Reported - Other (%)
Geographical mobility - Same house 1 year ago (%)
Geographical mobility - Same house 1 year ago (%) - White
Geographical mobility - Same house 1 year ago (%) - Black or African American
Geographical mobility - Same house 1 year ago (%) - Asian
Geographical mobility - Same house 1 year ago (%) - Hispanic or Latino
Geographical mobility - Same house 1 year ago (%) - American Indian and Alaska Native
Geographical mobility - Same house 1 year ago (%) - Multirace
Geographical mobility - Same house 1 year ago (%) - Other Race
Geographical mobility - Moved within same county (%)
Geographical mobility - Moved within same county (%) - White
Geographical mobility - Moved within same county (%) - Black or African American
Geographical mobility - Moved within same county (%) - Asian
Geographical mobility - Moved within same county (%) - Hispanic or Latino
Geographical mobility - Moved within same county (%) - American Indian and Alaska Native
Geographical mobility - Moved within same county (%) - Multirace
Geographical mobility - Moved within same county (%) - Other Race
Geographical mobility - Moved from different county within same state (%)
Geographical mobility - Moved from different county within same state (%) - White
Geographical mobility - Moved from different county within same state (%) - Black or African American
Geographical mobility - Moved from different county within same state (%) - Asian
Geographical mobility - Moved from different county within same state (%) - Hispanic or Latino
Geographical mobility - Moved from different county within same state (%) - American Indian and Alaska Native
Geographical mobility - Moved from different county within same state (%) - Multirace
Geographical mobility - Moved from different county within same state (%) - Other Race
Geographical mobility - Moved from different state (%)
Geographical mobility - Moved from different state (%) - White
Geographical mobility - Moved from different state (%) - Black or African American
Geographical mobility - Moved from different state (%) - Asian
Geographical mobility - Moved from different state (%) - Hispanic or Latino
Geographical mobility - Moved from different state (%) - American Indian and Alaska Native
Geographical mobility - Moved from different state (%) - Multirace
Geographical mobility - Moved from different state (%) - Other Race
Geographical mobility - Moved from abroad (%)
Geographical mobility - Moved from abroad (%) - White
Geographical mobility - Moved from abroad (%) - Black or African American
Geographical mobility - Moved from abroad (%) - Asian
Geographical mobility - Moved from abroad (%) - Hispanic or Latino
Geographical mobility - Moved from abroad (%) - American Indian and Alaska Native
Geographical mobility - Moved from abroad (%) - Multirace
Geographical mobility - Moved from abroad (%) - Other Race
Place of birth for the foreign-born population - Ireland (%)
Place of birth for the foreign-born population - Denmark (%)
Place of birth for the foreign-born population - Norway (%)
Place of birth for the foreign-born population - Sweden (%)
Place of birth for the foreign-born population - United Kingdom (%)
Place of birth for the foreign-born population - England (%)
Place of birth for the foreign-born population - Scotland (%)
Place of birth for the foreign-born population - Other Northern Europe (%)
Place of birth for the foreign-born population - Austria (%)
Place of birth for the foreign-born population - Belgium (%)
Place of birth for the foreign-born population - France (%)
Place of birth for the foreign-born population - Germany (%)
Place of birth for the foreign-born population - Netherlands (%)
Place of birth for the foreign-born population - Switzerland (%)
Place of birth for the foreign-born population - Other Western Europe (%)
Place of birth for the foreign-born population - Greece (%)
Place of birth for the foreign-born population - Italy (%)
Place of birth for the foreign-born population - Portugal (%)
Place of birth for the foreign-born population - Spain (%)
Place of birth for the foreign-born population - Other Southern Europe (%)
Place of birth for the foreign-born population - Albania (%)
Place of birth for the foreign-born population - Belarus (%)
Place of birth for the foreign-born population - Bosnia and Herzegovina (%)
Place of birth for the foreign-born population - Bulgaria (%)
Place of birth for the foreign-born population - Croatia (%)
Place of birth for the foreign-born population - Czechoslovakia (%)
Place of birth for the foreign-born population - Hungary (%)
Place of birth for the foreign-born population - Latvia (%)
Place of birth for the foreign-born population - Lithuania (%)
Place of birth for the foreign-born population - North Macedonia (Macedonia) (%)
Place of birth for the foreign-born population - Moldova (%)
Place of birth for the foreign-born population - Poland (%)
Place of birth for the foreign-born population - Romania (%)
Place of birth for the foreign-born population - Russia (%)
Place of birth for the foreign-born population - Serbia (%)
Place of birth for the foreign-born population - Ukraine (%)
Place of birth for the foreign-born population - Other Eastern Europe (%)
Place of birth for the foreign-born population - China (%)
Place of birth for the foreign-born population - Hong Kong (%)
Place of birth for the foreign-born population - Taiwan (%)
Place of birth for the foreign-born population - Japan (%)
Place of birth for the foreign-born population - Korea (%)
Place of birth for the foreign-born population - Other Eastern Asia (%)
Place of birth for the foreign-born population - Afghanistan (%)
Place of birth for the foreign-born population - Bangladesh (%)
Place of birth for the foreign-born population - India (%)
Place of birth for the foreign-born population - Iran (%)
Place of birth for the foreign-born population - Kazakhstan (%)
Place of birth for the foreign-born population - Nepal (%)
Place of birth for the foreign-born population - Pakistan (%)
Place of birth for the foreign-born population - Sri Lanka (%)
Place of birth for the foreign-born population - Uzbekistan (%)
Place of birth for the foreign-born population - Other South Central Asia (%)
Place of birth for the foreign-born population - Burma (%)
Place of birth for the foreign-born population - Cambodia (%)
Place of birth for the foreign-born population - Indonesia (%)
Place of birth for the foreign-born population - Laos (%)
Place of birth for the foreign-born population - Malaysia (%)
Place of birth for the foreign-born population - Philippines (%)
Place of birth for the foreign-born population - Singapore (%)
Place of birth for the foreign-born population - Thailand (%)
Place of birth for the foreign-born population - Vietnam (%)
Place of birth for the foreign-born population - Other South Eastern Asia (%)
Place of birth for the foreign-born population - Armenia (%)
Place of birth for the foreign-born population - Iraq (%)
Place of birth for the foreign-born population - Israel (%)
Place of birth for the foreign-born population - Jordan (%)
Place of birth for the foreign-born population - Kuwait (%)
Place of birth for the foreign-born population - Lebanon (%)
Place of birth for the foreign-born population - Saudi Arabia (%)
Place of birth for the foreign-born population - Syria (%)
Place of birth for the foreign-born population - Turkey (%)
Place of birth for the foreign-born population - Yemen (%)
Place of birth for the foreign-born population - Other Western Asia (%)
Place of birth for the foreign-born population - Eritrea (%)
Place of birth for the foreign-born population - Ethiopia (%)
Place of birth for the foreign-born population - Kenya (%)
Place of birth for the foreign-born population - Somalia (%)
Place of birth for the foreign-born population - Uganda (%)
Place of birth for the foreign-born population - Zimbabwe (%)
Place of birth for the foreign-born population - Other Eastern Africa (%)
Place of birth for the foreign-born population - Cameroon (%)
Place of birth for the foreign-born population - Congo (%)
Place of birth for the foreign-born population - Democratic Republic of Congo (Zaire) (%)
Place of birth for the foreign-born population - Other Middle Africa (%)
Place of birth for the foreign-born population - Egypt (%)
Place of birth for the foreign-born population - Morocco (%)
Place of birth for the foreign-born population - Sudan (%)
Place of birth for the foreign-born population - Other Northern Africa (%)
Place of birth for the foreign-born population - South Africa (%)
Place of birth for the foreign-born population - Other Southern Africa (%)
Place of birth for the foreign-born population - Cabo Verde (%)
Place of birth for the foreign-born population - Ghana (%)
Place of birth for the foreign-born population - Liberia (%)
Place of birth for the foreign-born population - Nigeria (%)
Place of birth for the foreign-born population - Senegal (%)
Place of birth for the foreign-born population - Sierra Leone (%)
Place of birth for the foreign-born population - Other Western Africa (%)
Place of birth for the foreign-born population - Australia (%)
Place of birth for the foreign-born population - New Zealand (%)
Place of birth for the foreign-born population - Fiji (%)
Place of birth for the foreign-born population - Micronesia (%)
Place of birth for the foreign-born population - Bahamas (%)
Place of birth for the foreign-born population - Barbados (%)
Place of birth for the foreign-born population - Cuba (%)
Place of birth for the foreign-born population - Dominica (%)
Place of birth for the foreign-born population - Dominican Republic (%)
Place of birth for the foreign-born population - Grenada (%)
Place of birth for the foreign-born population - Haiti (%)
Place of birth for the foreign-born population - Jamaica (%)
Place of birth for the foreign-born population - St. Vincent and the Grenadines (%)
Place of birth for the foreign-born population - Trinidad and Tobago (%)
Place of birth for the foreign-born population - West Indies (%)
Place of birth for the foreign-born population - Other Caribbean (%)
Place of birth for the foreign-born population - Belize (%)
Place of birth for the foreign-born population - Costa Rica (%)
Place of birth for the foreign-born population - El Salvador (%)
Place of birth for the foreign-born population - Guatemala (%)
Place of birth for the foreign-born population - Honduras (%)
Place of birth for the foreign-born population - Mexico (%)
Place of birth for the foreign-born population - Nicaragua (%)
Place of birth for the foreign-born population - Panama (%)
Place of birth for the foreign-born population - Other Central America (%)
Place of birth for the foreign-born population - Argentina (%)
Place of birth for the foreign-born population - Bolivia (%)
Place of birth for the foreign-born population - Brazil (%)
Place of birth for the foreign-born population - Chile (%)
Place of birth for the foreign-born population - Colombia (%)
Place of birth for the foreign-born population - Ecuador (%)
Place of birth for the foreign-born population - Guyana (%)
Place of birth for the foreign-born population - Peru (%)
Place of birth for the foreign-born population - Uruguay (%)
Place of birth for the foreign-born population - Venezuela (%)
Place of birth for the foreign-born population - Other South America (%)
Place of birth for the foreign-born population - Canada (%)
Place of birth for the foreign-born population - Other Northern America (%)
Place of birth for the foreign-born population - Other (%)
Latest news about races in Hopkinsville, KY collected exclusively by city-data.com from local newspapers, TV, and radio stations
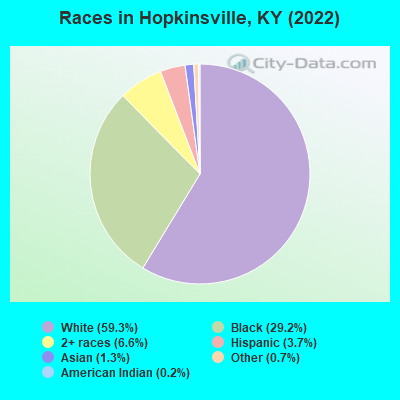
According to 2022 data, the most numerous races in Hopkinsville, KY are White alone (18,471 residents), Black alone (9,107 residents), and Hispanic (1,139 residents). 92.7% of Hopkinsville residents speak English at home. 3.1% of Hopkinsville, KY residents are foreign-born (1.5% born in Latin America, 1.1% born in Asia), which is 30.1% less than the foreign-born rate of 4.0% across the entire state of Kentucky.
Race distribution in Hopkinsville
2000 2022
3,608,013 89.3% White alone 293,639 7.3% Black alone 59,939 1.5% Hispanic 37,750 0.9% Two or more races 29,368 0.7% Asian alone 7,939 0.2% American Indian alone 3,846 0.10% Other race alone 1,275 0.03% Native Hawaiian and Other
3,710,998 82.2% White alone 343,194 7.6% Black alone 187,483 4.2% Hispanic 187,394 4.2% Two or more races 62,240 1.4% Asian alone 13,529 0.3% Other race alone 4,302 0.10% American Indian alone 3,170 0.07% Native Hawaiian and Other
Income and house value in Hopkinsville Median household income in 2022 $57,982 White non-Hispanic householders$38,828 Black householders$2,499 Native Hawaiian and other Pacific Islander householders$44,566 Two or more races householders$90,208 Hispanic or Latino race householdersMedian 2022 house value $157,057 White Non-Hispanic householders$89,804 Black or African American householders$150,870 American Indian or Alaska Native householders over $1,000,000 Asian householders$548,802 Some other race householders$108,164 Two or more races householders$134,706 Hispanic or Latino householders
Median age by race in Hopkinsville
39.2 Median age for White residents37.0 43.1 32.2 Median age for Black or African American residents26.7 40.5 37.0 Median age for American Indian / Alaska Native residents75.8 52.1 62.7 Median age for Asian residents48.8 67.7 12.4 Median age for Native Hawaiian / Pacific Islander residents-724,043,715.1 14.6 26.2 Median age for Other race residents35.8 27.3 24.2 Median age for Two or more races residents19.9 12.7 39.2 Median age for White alone residents36.9 42.9 26.0 Median age for Hispanic or Latino residents30.8 22.5
Owner/renter occupied households by race in Hopkinsville
House owners and renters - White residents 4,488 58.0% Owner occupied3,252 42.0% Renter occupiedHouse owners and renters - Black or African American residents 1,686 51.3% Owner occupied1,603 48.7% Renter occupiedHouse owners and renters - American Indian / Alaska Native residents 18 100.0% Renter occupiedHouse owners and renters - Asian residents 118 56.0% Owner occupied93 44.0% Renter occupiedHouse owners and renters - Native Hawaiian / Pacific Islander residents 8 79.2% Owner occupied2 20.8% Renter occupiedHouse owners and renters - Other race residents 113 64.8% Owner occupied61 35.2% Renter occupiedHouse owners and renters - Two or more races residents 176 21.3% Owner occupied650 78.7% Renter occupiedHouse owners and renters - White alone residents 4,540 58.2% Owner occupied3,265 41.8% Renter occupiedHouse owners and renters - Hispanic or Latino residents 153 48.6% Owner occupied162 51.4% Renter occupied
Language usage in Hopkinsville
English speakers - Total 92.7% of residents of Hopkinsville speak English at home.
2.5% of residents speak Spanish at home 447 60.3% Speak English very well294 39.7% Speak English less than very well2.5% of residents speak other language at home 459 63.1% Speak English very well268 36.9% Speak English less than very well
English speakers - Born in the United States 96.0% of residents of Hopkinsville speak English at home.
1.1% of residents speak Spanish at home 94 83.9% Speak English very well18 16.1% Speak English less than very well0.5% of residents speak other language at home 25 54.3% Speak English very well21 45.7% Speak English less than very well
English speakers - Native, born elsewhere 92.8% of residents of Hopkinsville speak English at home.
10.7% of residents speak Spanish at home 15 32.6% Speak English very well31 67.4% Speak English less than very well0.5% of residents speak other language at home 2 100.0% Speak English very well
English speakers - Foreign-born 26.7% of residents of Hopkinsville speak English at home.
41.8% of residents speak Spanish at home 143 35.2% Speak English very well263 64.8% Speak English less than very well33.1% of residents speak other language at home 125 38.8% Speak English very well197 61.2% Speak English less than very well
White (Caucasian) - Speak only English Native:
94.9% (16,459)Foreign-born:
18.9% (43)
White (Caucasian) - Speak another language Native:
1.8% (317)Foreign-born:
75.1% (171)
Black or African American - Speak only English Native:
100.0% (7,680)Foreign-born:
99.3% (196)
Black or African American - Speak another language Native:
0.1% (10)Foreign-born:
10.0% (20)
Asian - Speak another language Native:
34.3% (36)Foreign-born:
100.0% (317)
Native Hawaiian / Pacific Islander - Speak only English Native:
85.9% (20)Foreign-born:
96.3% (7)
Other race - Speak another language Native:
39.8% (149)Foreign-born:
98.6% (237)
Two or more races - Speak only English Native:
98.1% (2,602)Foreign-born:
10.7% (13)
Two or more races - Speak another language Native:
1.0% (25)Foreign-born:
89.3% (107)
White alone - Speak only English Native:
94.7% (16,453)Foreign-born:
44.1% (43)
White alone - Speak another language Native:
1.6% (275)Foreign-born:
55.6% (54)
Hispanic or Latino - Speak another language Native:
34.2% (224)Foreign-born:
100.0% (346)
Foreign-born residents in Hopkinsville 958 residents are foreign born (1.5% Latin America , 1.1% Asia ).
This city:
3.1%Kentucky:
4.1%
Marital status for residents in Hopkinsville Marital status - White (Caucasian) population 15 years and over
Males 34.6% Never married41.0% Now married2.8% Separated4.0% Widowed17.6% DivorcedFemales 26.3% Never married38.7% Now married2.7% Separated11.1% Widowed21.2% DivorcedWomen who gave birth in the past 12 months Now married:
34.3% (99)Unmarried:
65.7% (190)
Women who did not give birth in the past 12 months Now married:
38.0% (1,373)Unmarried:
62.0% (2,243)
Marital status - Black or African American population 15 years and over
Males 44.2% Never married33.2% Now married3.3% Separated1.7% Widowed17.5% DivorcedFemales 41.8% Never married23.6% Now married9.9% Separated7.7% Widowed16.9% DivorcedWomen who gave birth in the past 12 months Now married:
0.0% (0)Unmarried:
100.0% (51)
Women who did not give birth in the past 12 months Now married:
30.9% (575)Unmarried:
69.1% (1,289)
Marital status - American Indian / Alaska Native population 15 years and over
Males 82.6% Never married0.0% Now married17.4% Separated0.0% Widowed0.0% DivorcedFemales 29.4% Never married17.6% Now married0.0% Separated0.0% Widowed52.9% DivorcedWomen who did not give birth in the past 12 months Now married:
37.5% (4)Unmarried:
62.5% (6)
Marital status - Asian population 15 years and over
Males 0.5% Never married99.5% Now married0.0% Separated0.0% Widowed0.0% DivorcedFemales 18.4% Never married81.6% Now married0.0% Separated0.0% Widowed0.0% DivorcedWomen who did not give birth in the past 12 months Now married:
69.7% (76)Unmarried:
30.3% (33)
Marital status - Native Hawaiian / Pacific Islander population 15 years and over
Males 0.0% Never married100.0% Now married0.0% Separated0.0% Widowed0.0% DivorcedFemales 0.0% Never married42.9% Now married0.0% Separated0.0% Widowed57.1% DivorcedWomen who did not give birth in the past 12 months Now married:
100.0% (3)Unmarried:
0.0% (0)
Marital status - Other race population 15 years and over
Males 21.8% Never married69.2% Now married0.0% Separated0.0% Widowed9.0% DivorcedFemales 35.9% Never married64.1% Now married0.0% Separated0.0% Widowed0.0% DivorcedWomen who gave birth in the past 12 months Now married:
100.0% (83)Unmarried:
0.0% (0)
Women who did not give birth in the past 12 months Now married:
38.9% (46)Unmarried:
61.1% (72)
Marital status - Two or more races population 15 years and over
Males 80.4% Never married19.6% Now married0.0% Separated0.0% Widowed0.0% DivorcedFemales 60.3% Never married31.6% Now married3.5% Separated4.6% Widowed0.0% DivorcedWomen who gave birth in the past 12 months Now married:
100.0% (13)Unmarried:
0.0% (0)
Women who did not give birth in the past 12 months Now married:
34.3% (121)Unmarried:
65.7% (231)
Marital status - White alone, not Hispanic / Latino population 15 years and over
Males 35.0% Never married40.2% Now married2.8% Separated4.1% Widowed17.8% DivorcedFemales 26.0% Never married39.1% Now married2.6% Separated11.2% Widowed21.0% DivorcedWomen who gave birth in the past 12 months Now married:
34.3% (103)Unmarried:
65.7% (197)
Women who did not give birth in the past 12 months Now married:
38.2% (1,404)Unmarried:
61.8% (2,272)
Marital status - Hispanic or Latino population 15 years and over
Males 18.1% Never married77.2% Now married0.0% Separated0.0% Widowed4.7% DivorcedFemales 20.0% Never married54.8% Now married4.1% Separated8.9% Widowed12.2% DivorcedWomen who gave birth in the past 12 months Now married:
100.0% (77)Unmarried:
0.0% (0)
Women who did not give birth in the past 12 months Now married:
59.1% (96)Unmarried:
40.9% (66)
Ancestries in Hopkinsville
1,858 15.4% English1,620 13.4% American819 6.8% German592 4.9% Irish241 2.0% Scottish169 1.4% French Canadian141 1.2% European135 1.1% Italian104 0.9% Scotch-Irish96 0.8% Polish93 0.8% African77 0.6% Egyptian66 0.5% Bahamian60 0.5% Jamaican49 0.4% Nigerian45 0.4% Czech42 0.3% British34 0.3% Cajun33 0.3% Danish32 0.3% Lithuanian26 0.2% Senegalese26 0.2% Welsh13 0.1% French12 0.10% British West Indian10 0.08% Swedish7 0.06% Barbadian6 0.05% Finnish6 0.05% Norwegian6 0.05% Russian5 0.04% Canadian1 0.01% Eastern European
Geographical mobility in Hopkinsville Same house 1 year ago 14,070 76.3% White (Caucasian)7,027 79.5% Black or African American31 43.6% American Indian / Alaska Native414 97.9% Asian28 90.6% Native Hawaiian / Pacific Islander542 79.8% Other race1,926 66.1% Two or more races14,002 76.0% White alone, not Hispanic / Latino901 85.2% Hispanic or LatinoMoved within same county 1,932 10.5% White / Caucasian1,879 21.3% Black or African American12 16.3% American Indian / Alaska Native3 9.8% Native Hawaiian / Pacific Islander74 10.9% Other race793 27.2% Two or more races1,933 10.5% White alone, not Hispanic / Latino49 4.7% Hispanic or LatinoMoved within same state 692 3.8% White / Caucasian415 4.7% Black or African American16 22.7% American Indian / Alaska Native1 0.2% Other race39 1.3% Two or more races666 3.6% White alone, not Hispanic / Latino25 2.3% Hispanic or LatinoMoved from different state 1,680 9.1% White / Caucasian67 0.8% Black or African American10 14.3% American Indian / Alaska Native54 7.9% Other race142 4.9% Two or more races1,749 9.5% White alone, not Hispanic / Latino89 8.4% Hispanic or LatinoMoved from abroad 9 0.0% White6 0.0% White alone, not Hispanic / Latino
Children Nativity (place of birth) in Hopkinsville
Children under 6 years - Living with two parents Both parents native 889 100.0% NativeBoth parents foreign-born 49 100.0% NativeOne native, one foreign-born parent 39 100.0% NativeChildren under 6 years - Living with one parent Native parent 913 100.0% NativeForeign-born parent 9 100.0% NativeChildren 6 to 17 years - Living with two parents Both parents native 1,719 100.0% NativeBoth parents foreign-born 144 88.5% Native19 11.5% Foreign-bornOne native, one foreign-born parent 40 100.0% NativeChildren 6 to 17 years - Living with one parent Native parent 2,988 100.0% NativeForeign-born parent 22 49.5% Native22 50.5% Foreign-born
Grandparents responsible for own grandchildren in Hopkinsville
Grandparents (30 to 59 years) White / Caucasian 31 26.5% Responsible for grandchildren85 73.5% Not responsible for grandchildrenBlack or African American 50 52.8% Responsible for grandchildren45 47.2% Not responsible for grandchildrenTwo or more races 7 100.0% Not responsible for grandchildrenWhite alone, not Hispanic / Latino 31 26.2% Responsible for grandchildren86 73.8% Not responsible for grandchildrenGrandparents (60 years and over) White / Caucasian 88 57.8% Responsible for grandchildren64 42.2% Not responsible for grandchildrenBlack or African American 68 95.0% Responsible for grandchildren4 5.0% Not responsible for grandchildrenWhite alone, not Hispanic / Latino 89 57.6% Responsible for grandchildren65 42.4% Not responsible for grandchildren