Races in Hillsboro, Oregon (OR) Detailed Stats
Data:
Races - White alone (%)
Races - White alone (% change since 2000)
Races - Black alone (%)
Races - Black alone (% change since 2000)
Races - American Indian alone (%)
Races - American Indian alone (% change since 2000)
Races - Asian alone (%)
Races - Asian alone (% change since 2000)
Races - Hispanic (%)
Races - Hispanic (% change since 2000)
Races - Native Hawaiian and Other Pacific Islander alone (%)
Races - Native Hawaiian and Other Pacific Islander alone (% change since 2000)
Races - Two or more races(%)
Races - Two or more races(% change since 2000)
Races - Other race alone (%)
Races - Other race alone (% change since 2000)
Racial diversity
Place of birth - Born in state of residence (%)
Place of birth - Born in state of residence (%) - White
Place of birth - Born in state of residence (%) - Black or African American
Place of birth - Born in state of residence (%) - Asian
Place of birth - Born in state of residence (%) - Hispanic or Latino
Place of birth - Born in state of residence (%) - American Indian and Alaska Native
Place of birth - Born in state of residence (%) - Multirace
Place of birth - Born in state of residence (%) - Other Race
Place of birth - Born in other state (%)
Place of birth - Born in other state (%) - White
Place of birth - Born in other state (%) - Black or African American
Place of birth - Born in other state (%) - Asian
Place of birth - Born in other state (%) - Hispanic or Latino
Place of birth - Born in other state (%) - American Indian and Alaska Native
Place of birth - Born in other state (%) - Multirace
Place of birth - Born in other state (%) - Other Race
Place of birth - Native, outside of US (%)
Place of birth - Native, outside of US (%) - White
Place of birth - Native, outside of US (%) - Black or African American
Place of birth - Native, outside of US (%) - Asian
Place of birth - Native, outside of US (%) - Hispanic or Latino
Place of birth - Native, outside of US (%) - American Indian and Alaska Native
Place of birth - Native, outside of US (%) - Multirace
Place of birth - Native, outside of US (%) - Other Race
Place of birth - Foreign born (%)
Place of birth - Foreign born (%) - White
Place of birth - Foreign born (%) - Black or African American
Place of birth - Foreign born (%) - Asian
Place of birth - Foreign born (%) - Hispanic or Latino
Place of birth - Foreign born (%) - American Indian and Alaska Native
Place of birth - Foreign born (%) - Multirace
Place of birth - Foreign born (%) - Other Race
Residents speaking English at home (%)
Residents speaking English at home - Born in the United States (%)
Residents speaking English at home - Native, born elsewhere (%)
Residents speaking English at home - Foreign born (%)
Residents speaking Spanish at home (%)
Residents speaking Spanish at home - Born in the United States (%)
Residents speaking Spanish at home - Native, born elsewhere (%)
Residents speaking Spanish at home - Foreign born (%)
Residents speaking other language at home (%)
Residents speaking other language at home - Born in the United States (%)
Residents speaking other language at home - Native, born elsewhere (%)
Residents speaking other language at home - Foreign born (%)
Marital status - Never married (%)
Marital status - Now married (%)
Marital status - Separated (%)
Marital status - Widowed (%)
Marital status - Divorced (%)
Ancestries Reported - Arab (%)
Ancestries Reported - Czech (%)
Ancestries Reported - Danish (%)
Ancestries Reported - Dutch (%)
Ancestries Reported - English (%)
Ancestries Reported - French (%)
Ancestries Reported - French Canadian (%)
Ancestries Reported - German (%)
Ancestries Reported - Greek (%)
Ancestries Reported - Hungarian (%)
Ancestries Reported - Irish (%)
Ancestries Reported - Italian (%)
Ancestries Reported - Lithuanian (%)
Ancestries Reported - Norwegian (%)
Ancestries Reported - Polish (%)
Ancestries Reported - Portuguese (%)
Ancestries Reported - Russian (%)
Ancestries Reported - Scotch-Irish (%)
Ancestries Reported - Scottish (%)
Ancestries Reported - Slovak (%)
Ancestries Reported - Subsaharan African (%)
Ancestries Reported - Swedish (%)
Ancestries Reported - Swiss (%)
Ancestries Reported - Ukrainian (%)
Ancestries Reported - United States (%)
Ancestries Reported - Welsh (%)
Ancestries Reported - West Indian (%)
Ancestries Reported - Other (%)
Geographical mobility - Same house 1 year ago (%)
Geographical mobility - Same house 1 year ago (%) - White
Geographical mobility - Same house 1 year ago (%) - Black or African American
Geographical mobility - Same house 1 year ago (%) - Asian
Geographical mobility - Same house 1 year ago (%) - Hispanic or Latino
Geographical mobility - Same house 1 year ago (%) - American Indian and Alaska Native
Geographical mobility - Same house 1 year ago (%) - Multirace
Geographical mobility - Same house 1 year ago (%) - Other Race
Geographical mobility - Moved within same county (%)
Geographical mobility - Moved within same county (%) - White
Geographical mobility - Moved within same county (%) - Black or African American
Geographical mobility - Moved within same county (%) - Asian
Geographical mobility - Moved within same county (%) - Hispanic or Latino
Geographical mobility - Moved within same county (%) - American Indian and Alaska Native
Geographical mobility - Moved within same county (%) - Multirace
Geographical mobility - Moved within same county (%) - Other Race
Geographical mobility - Moved from different county within same state (%)
Geographical mobility - Moved from different county within same state (%) - White
Geographical mobility - Moved from different county within same state (%) - Black or African American
Geographical mobility - Moved from different county within same state (%) - Asian
Geographical mobility - Moved from different county within same state (%) - Hispanic or Latino
Geographical mobility - Moved from different county within same state (%) - American Indian and Alaska Native
Geographical mobility - Moved from different county within same state (%) - Multirace
Geographical mobility - Moved from different county within same state (%) - Other Race
Geographical mobility - Moved from different state (%)
Geographical mobility - Moved from different state (%) - White
Geographical mobility - Moved from different state (%) - Black or African American
Geographical mobility - Moved from different state (%) - Asian
Geographical mobility - Moved from different state (%) - Hispanic or Latino
Geographical mobility - Moved from different state (%) - American Indian and Alaska Native
Geographical mobility - Moved from different state (%) - Multirace
Geographical mobility - Moved from different state (%) - Other Race
Geographical mobility - Moved from abroad (%)
Geographical mobility - Moved from abroad (%) - White
Geographical mobility - Moved from abroad (%) - Black or African American
Geographical mobility - Moved from abroad (%) - Asian
Geographical mobility - Moved from abroad (%) - Hispanic or Latino
Geographical mobility - Moved from abroad (%) - American Indian and Alaska Native
Geographical mobility - Moved from abroad (%) - Multirace
Geographical mobility - Moved from abroad (%) - Other Race
Place of birth for the foreign-born population - Ireland (%)
Place of birth for the foreign-born population - Denmark (%)
Place of birth for the foreign-born population - Norway (%)
Place of birth for the foreign-born population - Sweden (%)
Place of birth for the foreign-born population - United Kingdom (%)
Place of birth for the foreign-born population - England (%)
Place of birth for the foreign-born population - Scotland (%)
Place of birth for the foreign-born population - Other Northern Europe (%)
Place of birth for the foreign-born population - Austria (%)
Place of birth for the foreign-born population - Belgium (%)
Place of birth for the foreign-born population - France (%)
Place of birth for the foreign-born population - Germany (%)
Place of birth for the foreign-born population - Netherlands (%)
Place of birth for the foreign-born population - Switzerland (%)
Place of birth for the foreign-born population - Other Western Europe (%)
Place of birth for the foreign-born population - Greece (%)
Place of birth for the foreign-born population - Italy (%)
Place of birth for the foreign-born population - Portugal (%)
Place of birth for the foreign-born population - Spain (%)
Place of birth for the foreign-born population - Other Southern Europe (%)
Place of birth for the foreign-born population - Albania (%)
Place of birth for the foreign-born population - Belarus (%)
Place of birth for the foreign-born population - Bosnia and Herzegovina (%)
Place of birth for the foreign-born population - Bulgaria (%)
Place of birth for the foreign-born population - Croatia (%)
Place of birth for the foreign-born population - Czechoslovakia (%)
Place of birth for the foreign-born population - Hungary (%)
Place of birth for the foreign-born population - Latvia (%)
Place of birth for the foreign-born population - Lithuania (%)
Place of birth for the foreign-born population - North Macedonia (Macedonia) (%)
Place of birth for the foreign-born population - Moldova (%)
Place of birth for the foreign-born population - Poland (%)
Place of birth for the foreign-born population - Romania (%)
Place of birth for the foreign-born population - Russia (%)
Place of birth for the foreign-born population - Serbia (%)
Place of birth for the foreign-born population - Ukraine (%)
Place of birth for the foreign-born population - Other Eastern Europe (%)
Place of birth for the foreign-born population - China (%)
Place of birth for the foreign-born population - Hong Kong (%)
Place of birth for the foreign-born population - Taiwan (%)
Place of birth for the foreign-born population - Japan (%)
Place of birth for the foreign-born population - Korea (%)
Place of birth for the foreign-born population - Other Eastern Asia (%)
Place of birth for the foreign-born population - Afghanistan (%)
Place of birth for the foreign-born population - Bangladesh (%)
Place of birth for the foreign-born population - India (%)
Place of birth for the foreign-born population - Iran (%)
Place of birth for the foreign-born population - Kazakhstan (%)
Place of birth for the foreign-born population - Nepal (%)
Place of birth for the foreign-born population - Pakistan (%)
Place of birth for the foreign-born population - Sri Lanka (%)
Place of birth for the foreign-born population - Uzbekistan (%)
Place of birth for the foreign-born population - Other South Central Asia (%)
Place of birth for the foreign-born population - Burma (%)
Place of birth for the foreign-born population - Cambodia (%)
Place of birth for the foreign-born population - Indonesia (%)
Place of birth for the foreign-born population - Laos (%)
Place of birth for the foreign-born population - Malaysia (%)
Place of birth for the foreign-born population - Philippines (%)
Place of birth for the foreign-born population - Singapore (%)
Place of birth for the foreign-born population - Thailand (%)
Place of birth for the foreign-born population - Vietnam (%)
Place of birth for the foreign-born population - Other South Eastern Asia (%)
Place of birth for the foreign-born population - Armenia (%)
Place of birth for the foreign-born population - Iraq (%)
Place of birth for the foreign-born population - Israel (%)
Place of birth for the foreign-born population - Jordan (%)
Place of birth for the foreign-born population - Kuwait (%)
Place of birth for the foreign-born population - Lebanon (%)
Place of birth for the foreign-born population - Saudi Arabia (%)
Place of birth for the foreign-born population - Syria (%)
Place of birth for the foreign-born population - Turkey (%)
Place of birth for the foreign-born population - Yemen (%)
Place of birth for the foreign-born population - Other Western Asia (%)
Place of birth for the foreign-born population - Eritrea (%)
Place of birth for the foreign-born population - Ethiopia (%)
Place of birth for the foreign-born population - Kenya (%)
Place of birth for the foreign-born population - Somalia (%)
Place of birth for the foreign-born population - Uganda (%)
Place of birth for the foreign-born population - Zimbabwe (%)
Place of birth for the foreign-born population - Other Eastern Africa (%)
Place of birth for the foreign-born population - Cameroon (%)
Place of birth for the foreign-born population - Congo (%)
Place of birth for the foreign-born population - Democratic Republic of Congo (Zaire) (%)
Place of birth for the foreign-born population - Other Middle Africa (%)
Place of birth for the foreign-born population - Egypt (%)
Place of birth for the foreign-born population - Morocco (%)
Place of birth for the foreign-born population - Sudan (%)
Place of birth for the foreign-born population - Other Northern Africa (%)
Place of birth for the foreign-born population - South Africa (%)
Place of birth for the foreign-born population - Other Southern Africa (%)
Place of birth for the foreign-born population - Cabo Verde (%)
Place of birth for the foreign-born population - Ghana (%)
Place of birth for the foreign-born population - Liberia (%)
Place of birth for the foreign-born population - Nigeria (%)
Place of birth for the foreign-born population - Senegal (%)
Place of birth for the foreign-born population - Sierra Leone (%)
Place of birth for the foreign-born population - Other Western Africa (%)
Place of birth for the foreign-born population - Australia (%)
Place of birth for the foreign-born population - New Zealand (%)
Place of birth for the foreign-born population - Fiji (%)
Place of birth for the foreign-born population - Micronesia (%)
Place of birth for the foreign-born population - Bahamas (%)
Place of birth for the foreign-born population - Barbados (%)
Place of birth for the foreign-born population - Cuba (%)
Place of birth for the foreign-born population - Dominica (%)
Place of birth for the foreign-born population - Dominican Republic (%)
Place of birth for the foreign-born population - Grenada (%)
Place of birth for the foreign-born population - Haiti (%)
Place of birth for the foreign-born population - Jamaica (%)
Place of birth for the foreign-born population - St. Vincent and the Grenadines (%)
Place of birth for the foreign-born population - Trinidad and Tobago (%)
Place of birth for the foreign-born population - West Indies (%)
Place of birth for the foreign-born population - Other Caribbean (%)
Place of birth for the foreign-born population - Belize (%)
Place of birth for the foreign-born population - Costa Rica (%)
Place of birth for the foreign-born population - El Salvador (%)
Place of birth for the foreign-born population - Guatemala (%)
Place of birth for the foreign-born population - Honduras (%)
Place of birth for the foreign-born population - Mexico (%)
Place of birth for the foreign-born population - Nicaragua (%)
Place of birth for the foreign-born population - Panama (%)
Place of birth for the foreign-born population - Other Central America (%)
Place of birth for the foreign-born population - Argentina (%)
Place of birth for the foreign-born population - Bolivia (%)
Place of birth for the foreign-born population - Brazil (%)
Place of birth for the foreign-born population - Chile (%)
Place of birth for the foreign-born population - Colombia (%)
Place of birth for the foreign-born population - Ecuador (%)
Place of birth for the foreign-born population - Guyana (%)
Place of birth for the foreign-born population - Peru (%)
Place of birth for the foreign-born population - Uruguay (%)
Place of birth for the foreign-born population - Venezuela (%)
Place of birth for the foreign-born population - Other South America (%)
Place of birth for the foreign-born population - Canada (%)
Place of birth for the foreign-born population - Other Northern America (%)
Place of birth for the foreign-born population - Other (%)
Latest news about races in Hillsboro, OR collected exclusively by city-data.com from local newspapers, TV, and radio stations
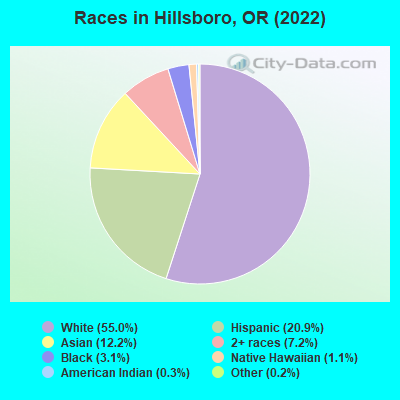
According to 2022 data, the most numerous races in Hillsboro, OR are White alone (59,018 residents), Hispanic (22,381 residents), and Two or more races (7,704 residents). 72.1% of Hillsboro residents speak English at home. 20.8% of Hillsboro, OR residents are foreign-born (8.8% born in Latin America, 8.7% born in Asia), which is 56.7% greater than the foreign-born rate of 9.0% across the entire state of Oregon.
Race distribution in Hillsboro
2000 2022
49,339 70.3% White alone 13,262 18.9% Hispanic 4,565 6.5% Asian alone 1,573 2.2% Two or more races 745 1.1% Black alone 446 0.6% American Indian alone 165 0.2% Native Hawaiian and Other 91 0.1% Other race alone
59,018 55.0% White alone 22,381 20.9% Hispanic 13,083 12.2% Asian alone 7,704 7.2% Two or more races 3,345 3.1% Black alone 1,211 1.1% Native Hawaiian and Other 366 0.3% American Indian alone 211 0.2% Other race alone
2000 2022
2,857,616 83.5% White alone 275,314 8.0% Hispanic 100,333 2.9% Asian alone 82,733 2.4% Two or more races 53,325 1.6% Black alone 40,130 1.2% American Indian alone 7,398 0.2% Native Hawaiian and Other 4,550 0.1% Other race alone
3,037,571 71.6% White alone 609,538 14.4% Hispanic 252,744 6.0% Two or more races 191,283 4.5% Asian alone 78,228 1.8% Black alone 29,399 0.7% American Indian alone 25,731 0.6% Other race alone 15,643 0.4% Native Hawaiian and Other
Income and house value in Hillsboro Median household income in 2022 $106,586 White non-Hispanic householders$62,529 Black householders$140,820 Asian householders$55,335 Some other race householders$81,962 Two or more races householders$80,064 Hispanic or Latino race householdersMedian 2022 house value $537,608 White Non-Hispanic householders$512,225 Black or African American householders$520,686 American Indian or Alaska Native householders $592,606 Asian householders$532,727 Native Hawaiian and other Pacific Islander householders$465,363 Some other race householders$553,880 Two or more races householders$495,302 Hispanic or Latino householders
Median age by race in Hillsboro
38.4 Median age for White residents36.4 40.2 42.2 Median age for Black or African American residents42.0 42.5 28.0 Median age for American Indian / Alaska Native residents33.2 18.6 38.1 Median age for Asian residents38.8 37.3 51.1 Median age for Native Hawaiian / Pacific Islander residents36.1 57.2 32.3 Median age for Other race residents31.9 32.7 26.2 Median age for Two or more races residents23.9 31.3 38.8 Median age for White alone residents37.3 40.4 31.6 Median age for Hispanic or Latino residents29.8 34.5
Owner/renter occupied households by race in Hillsboro
House owners and renters - White residents 15,785 55.8% Owner occupied12,480 44.2% Renter occupiedHouse owners and renters - Black or African American residents 310 16.4% Owner occupied1,586 83.6% Renter occupiedHouse owners and renters - American Indian / Alaska Native residents 342 62.1% Owner occupied209 37.9% Renter occupiedHouse owners and renters - Asian residents 3,374 56.9% Owner occupied2,559 43.1% Renter occupiedHouse owners and renters - Native Hawaiian / Pacific Islander residents 46 10.4% Owner occupied393 89.6% Renter occupiedHouse owners and renters - Other race residents 987 41.8% Owner occupied1,374 58.2% Renter occupiedHouse owners and renters - Two or more races residents 2,561 41.4% Owner occupied3,624 58.6% Renter occupiedHouse owners and renters - White alone residents 15,206 56.0% Owner occupied11,935 44.0% Renter occupiedHouse owners and renters - Hispanic or Latino residents 2,993 42.1% Owner occupied4,122 57.9% Renter occupied
Language usage in Hillsboro
English speakers - Total 72.1% of residents of Hillsboro speak English at home.
15.1% of residents speak Spanish at home 11,004 71.1% Speak English very well4,469 28.9% Speak English less than very well12.8% of residents speak other language at home 8,086 61.4% Speak English very well5,087 38.6% Speak English less than very well
English speakers - Born in the United States 91.9% of residents of Hillsboro speak English at home.
5.8% of residents speak Spanish at home 1,636 64.0% Speak English very well922 36.0% Speak English less than very well2.3% of residents speak other language at home 856 83.7% Speak English very well167 16.3% Speak English less than very well
English speakers - Native, born elsewhere 82.6% of residents of Hillsboro speak English at home.
6.7% of residents speak Spanish at home 104 100.0% Speak English less than very well10.7% of residents speak other language at home 167 100.0% Speak English very well
English speakers - Foreign-born 13.1% of residents of Hillsboro speak English at home.
38.1% of residents speak Spanish at home 5,396 62.2% Speak English very well3,284 37.8% Speak English less than very well48.9% of residents speak other language at home 6,461 58.0% Speak English very well4,681 42.0% Speak English less than very well
White (Caucasian) - Speak only English Native:
97.0% (54,957)Foreign-born:
26.6% (799)
White (Caucasian) - Speak another language Native:
3.0% (1,684)Foreign-born:
73.4% (2,200)
Black or African American - Speak only English Native:
77.7% (1,363)Foreign-born:
35.4% (540)
Black or African American - Speak another language Native:
24.9% (437)Foreign-born:
63.3% (966)
American Indian / Alaska Native - Speak another language Native:
38.7% (317)Foreign-born:
100.0% (236)
Asian - Speak only English Native:
61.6% (1,668)Foreign-born:
9.4% (912)
Asian - Speak another language Native:
38.4% (1,041)Foreign-born:
90.6% (8,826)
Native Hawaiian / Pacific Islander - Speak only English Native:
88.2% (597)Foreign-born:
5.7% (12)
Native Hawaiian / Pacific Islander - Speak another language Native:
8.5% (58)Foreign-born:
92.9% (193)
Other race - Speak only English Native:
24.2% (782)Foreign-born:
9.3% (356)
Other race - Speak another language Native:
75.8% (2,455)Foreign-born:
90.7% (3,457)
Two or more races - Speak only English Native:
76.8% (10,294)Foreign-born:
7.6% (368)
Two or more races - Speak another language Native:
23.2% (3,114)Foreign-born:
92.4% (4,472)
White alone - Speak only English Native:
98.1% (53,600)Foreign-born:
35.5% (799)
White alone - Speak another language Native:
1.9% (1,021)Foreign-born:
64.5% (1,449)
Hispanic or Latino - Speak only English Native:
49.9% (6,051)Foreign-born:
3.5% (314)
Hispanic or Latino - Speak another language Native:
50.1% (6,086)Foreign-born:
96.5% (8,680)
Foreign-born residents in Hillsboro 22,197 residents are foreign born (8.8% Latin America , 8.7% Asia ).
This city:
20.8%Oregon:
9.8%
Marital status for residents in Hillsboro Marital status - White (Caucasian) population 15 years and over
Males 29.6% Never married53.4% Now married1.9% Separated0.8% Widowed14.3% DivorcedFemales 27.4% Never married50.9% Now married2.6% Separated6.0% Widowed13.0% DivorcedWomen who gave birth in the past 12 months Now married:
84.7% (758)Unmarried:
15.3% (137)
Women who did not give birth in the past 12 months Now married:
50.2% (7,189)Unmarried:
49.8% (7,136)
Marital status - Black or African American population 15 years and over
Males 38.3% Never married60.1% Now married0.9% Separated0.6% Widowed0.1% DivorcedFemales 40.0% Never married51.7% Now married0.7% Separated2.9% Widowed4.7% DivorcedWomen who gave birth in the past 12 months Now married:
100.0% (77)Unmarried:
0.0% (0)
Women who did not give birth in the past 12 months Now married:
48.9% (469)Unmarried:
51.1% (490)
Marital status - American Indian / Alaska Native population 15 years and over
Males 49.3% Never married38.1% Now married12.5% Separated0.0% Widowed0.0% DivorcedFemales 44.7% Never married32.8% Now married0.0% Separated3.1% Widowed19.4% DivorcedWomen who gave birth in the past 12 months Now married:
100.0% (48)Unmarried:
0.0% (0)
Women who did not give birth in the past 12 months Now married:
30.0% (116)Unmarried:
70.0% (270)
Marital status - Asian population 15 years and over
Males 36.4% Never married58.9% Now married0.0% Separated0.3% Widowed4.4% DivorcedFemales 25.8% Never married63.5% Now married0.3% Separated5.3% Widowed5.2% DivorcedWomen who gave birth in the past 12 months Now married:
100.0% (237)Unmarried:
0.0% (0)
Women who did not give birth in the past 12 months Now married:
64.4% (2,467)Unmarried:
35.6% (1,362)
Marital status - Native Hawaiian / Pacific Islander population 15 years and over
Males 29.1% Never married14.7% Now married0.0% Separated0.0% Widowed56.2% DivorcedFemales 36.2% Never married52.6% Now married0.0% Separated7.9% Widowed3.3% DivorcedWomen who did not give birth in the past 12 months Now married:
63.5% (99)Unmarried:
36.5% (57)
Marital status - Other race population 15 years and over
Males 43.3% Never married51.4% Now married2.2% Separated0.0% Widowed3.2% DivorcedFemales 37.6% Never married40.5% Now married3.0% Separated3.2% Widowed15.7% DivorcedWomen who gave birth in the past 12 months Now married:
0.0% (0)Unmarried:
100.0% (106)
Women who did not give birth in the past 12 months Now married:
43.6% (1,303)Unmarried:
56.4% (1,684)
Marital status - Two or more races population 15 years and over
Males 56.6% Never married39.7% Now married0.0% Separated0.9% Widowed2.8% DivorcedFemales 40.1% Never married35.8% Now married6.3% Separated8.7% Widowed9.0% DivorcedWomen who gave birth in the past 12 months Now married:
89.4% (135)Unmarried:
10.6% (16)
Women who did not give birth in the past 12 months Now married:
40.7% (2,190)Unmarried:
59.3% (3,196)
Marital status - White alone, not Hispanic / Latino population 15 years and over
Males 29.4% Never married53.8% Now married1.0% Separated0.9% Widowed14.9% DivorcedFemales 28.0% Never married50.7% Now married1.7% Separated6.3% Widowed13.2% DivorcedWomen who gave birth in the past 12 months Now married:
84.7% (758)Unmarried:
15.3% (137)
Women who did not give birth in the past 12 months Now married:
47.8% (6,471)Unmarried:
52.2% (7,054)
Marital status - Hispanic or Latino population 15 years and over
Males 47.2% Never married49.0% Now married3.2% Separated0.0% Widowed0.7% DivorcedFemales 30.3% Never married47.2% Now married5.1% Separated8.0% Widowed9.4% DivorcedWomen who gave birth in the past 12 months Now married:
68.0% (143)Unmarried:
32.0% (67)
Women who did not give birth in the past 12 months Now married:
34.5% (2,353)Unmarried:
65.5% (4,461)
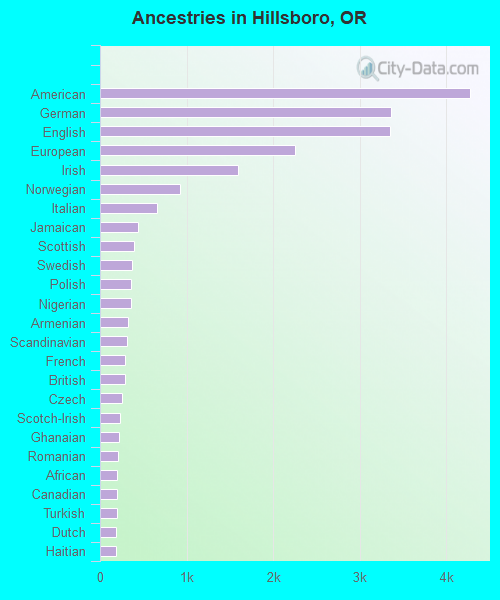
Ancestries in Hillsboro
4,278 7.5% American3,355 5.9% German3,353 5.9% English2,246 3.9% European1,599 2.8% Irish927 1.6% Norwegian658 1.1% Italian435 0.8% Jamaican394 0.7% Scottish366 0.6% Swedish362 0.6% Polish353 0.6% Nigerian324 0.6% Armenian309 0.5% Scandinavian292 0.5% French288 0.5% British256 0.4% Czech233 0.4% Scotch-Irish224 0.4% Ghanaian205 0.4% Romanian201 0.4% African195 0.3% Canadian192 0.3% Turkish183 0.3% Dutch183 0.3% Haitian169 0.3% French Canadian165 0.3% Northern European153 0.3% West Indian135 0.2% Danish133 0.2% Russian121 0.2% Eastern European117 0.2% Portuguese114 0.2% Swiss113 0.2% Ukrainian85 0.1% Welsh85 0.1% Hungarian84 0.1% Finnish81 0.1% Iranian78 0.1% Moroccan75 0.1% Iraqi65 0.1% Austrian61 0.1% Serbian61 0.1% Greek42 0.07% Australian42 0.07% Croatian36 0.06% Belgian33 0.06% Palestinian31 0.05% Assyrian29 0.05% Ethiopian25 0.04% Bulgarian19 0.03% Celtic17 0.03% Egyptian15 0.03% South African14 0.02% Alsatian13 0.02% Kenyan13 0.02% Cypriot9 0.02% Arab9 0.02% Guyanese9 0.02% Cajun8 0.01% Lebanese8 0.01% Basque5 0.01% Estonian4 0.01% Yugoslavian3 0.01% Pennsylvania German
Geographical mobility in Hillsboro Same house 1 year ago 52,470 85.2% White (Caucasian)2,657 81.2% Black or African American1,300 94.2% American Indian / Alaska Native10,310 79.9% Asian434 49.5% Native Hawaiian / Pacific Islander9,629 89.4% Other race17,016 88.0% Two or more races49,712 85.1% White alone, not Hispanic / Latino20,240 90.4% Hispanic or LatinoMoved within same county 3,882 6.3% White / Caucasian405 12.4% Black or African American33 2.4% American Indian / Alaska Native1,449 11.2% Asian315 36.0% Native Hawaiian / Pacific Islander862 8.0% Other race1,235 6.4% Two or more races3,607 6.2% White alone, not Hispanic / Latino1,408 6.3% Hispanic or LatinoMoved within same state 1,448 2.4% White / Caucasian46 1.4% Black or African American17 1.3% American Indian / Alaska Native55 6.3% Native Hawaiian / Pacific Islander29 0.3% Other race508 2.6% Two or more races1,409 2.4% White alone, not Hispanic / Latino131 0.6% Hispanic or LatinoMoved from different state 3,511 5.7% White / Caucasian72 2.2% Black or African American26 1.9% American Indian / Alaska Native761 5.9% Asian14 1.6% Native Hawaiian / Pacific Islander196 1.8% Other race580 3.0% Two or more races3,425 5.9% White alone, not Hispanic / Latino543 2.4% Hispanic or LatinoMoved from abroad 277 0.4% White24 1.8% American Indian / Alaska Native389 3.0% Asian77 0.7% Other race277 0.5% White alone, not Hispanic / Latino59 0.3% Hispanic or Latino
Children Nativity (place of birth) in Hillsboro
Children under 6 years - Living with two parents Both parents native 2,654 100.0% NativeBoth parents foreign-born 1,117 100.0% NativeOne native, one foreign-born parent 405 100.0% NativeChildren under 6 years - Living with one parent Native parent 1,357 100.0% NativeForeign-born parent 47 100.0% NativeChildren 6 to 17 years - Living with two parents Both parents native 5,320 99.2% Native44 0.8% Foreign-bornBoth parents foreign-born 1,365 76.3% Native425 23.7% Foreign-bornOne native, one foreign-born parent 977 90.6% Native101 9.4% Foreign-bornChildren 6 to 17 years - Living with one parent Native parent 4,871 100.0% NativeForeign-born parent 651 50.0% Native651 50.0% Foreign-born
Place of birth for residents in Hillsboro 9,954 Americas9,555 Latin America9,403 Asia8,679 Central America4,496 South Central Asia2,449 South Eastern Asia1,971 Eastern Asia1,390 Europe1,182 Africa816 China737 Eastern Europe651 Western Africa486 Western Asia479 Caribbean399 Northern America396 South America328 Northern Europe267 Oceania250 Western Europe179 Eastern Africa149 Northern Africa117 Middle Africa84 Southern Africa73 Southern Europe56 Australia and New Zealand Subregion7,484 Mexico3,669 India1,031 Philippines871 Vietnam700 Guatemala595 Korea559 Japan552 China407 Jamaica399 Canada358 Ghana274 Nigeria221 Laos213 Bangladesh203 Cambodia194 Fiji189 Costa Rica171 Turkey171 Russia155 Iraq153 Peru152 Afghanistan150 Germany135 Taiwan134 Honduras131 Nepal128 Hong Kong126 Morocco122 Romania107 Czechoslovakia103 Iran101 Kazakhstan96 Ireland93 England84 South Africa81 El Salvador76 Poland73 United Kingdom72 Pakistan72 Somalia72 Brazil72 Malaysia71 Colombia71 Cameroon69 Ukraine65 Serbia61 Cuba60 Israel53 Kenya51 France50 Sri Lanka50 Ecuador47 Nicaragua47 Argentina46 Australia45 Democratic Republic of Congo (Zaire)44 Ethiopia40 Panama39 Belarus38 Armenia31 Sweden31 Netherlands30 Italy28 Greece26 Bulgaria25 Hungary25 Thailand23 Egypt21 Lebanon18 Norway16 Jordan14 Denmark14 Portugal12 Singapore12 Moldova11 Indonesia10 Lithuania10 Trinidad and Tobago9 Switzerland9 Eritrea9 Azerbaijan9 New Zealand7 Austria5 United Arab Emirates4 Kuwait4 Saudi Arabia
Grandparents responsible for own grandchildren in Hillsboro
Grandparents (30 to 59 years) White / Caucasian 99 28.1% Responsible for grandchildren254 71.9% Not responsible for grandchildrenAmerican Indian / Alaska Native 6 100.0% Responsible for grandchildrenAsian 34 100.0% Not responsible for grandchildrenNative Hawaiian / Pacific Islander 11 100.0% Not responsible for grandchildrenOther race 68 50.4% Responsible for grandchildren67 49.6% Not responsible for grandchildrenWhite alone, not Hispanic / Latino 64 19.9% Responsible for grandchildren259 80.1% Not responsible for grandchildrenHispanic or Latino 94 61.9% Responsible for grandchildren58 38.1% Not responsible for grandchildrenGrandparents (60 years and over) White / Caucasian 64 15.1% Responsible for grandchildren356 84.9% Not responsible for grandchildrenAsian 49 22.2% Responsible for grandchildren173 77.8% Not responsible for grandchildrenOther race 341 100.0% Not responsible for grandchildrenWhite alone, not Hispanic / Latino 66 14.8% Responsible for grandchildren383 85.2% Not responsible for grandchildrenHispanic or Latino 420 100.0% Not responsible for grandchildren