Races in Hazel Park, Michigan (MI) Detailed Stats
Data:
Races - White alone (%)
Races - White alone (% change since 2000)
Races - Black alone (%)
Races - Black alone (% change since 2000)
Races - American Indian alone (%)
Races - American Indian alone (% change since 2000)
Races - Asian alone (%)
Races - Asian alone (% change since 2000)
Races - Hispanic (%)
Races - Hispanic (% change since 2000)
Races - Native Hawaiian and Other Pacific Islander alone (%)
Races - Native Hawaiian and Other Pacific Islander alone (% change since 2000)
Races - Two or more races(%)
Races - Two or more races(% change since 2000)
Races - Other race alone (%)
Races - Other race alone (% change since 2000)
Racial diversity
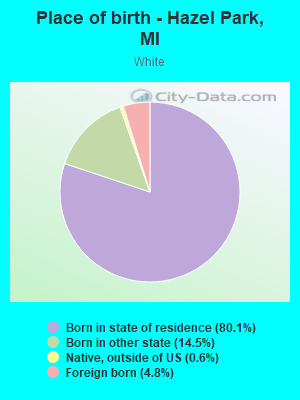
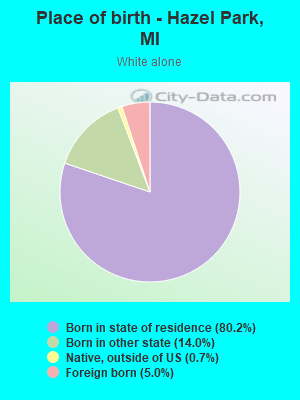
Place of birth - Born in state of residence (%)
Place of birth - Born in state of residence (%) - White
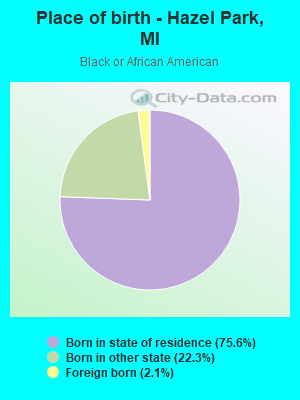
Place of birth - Born in state of residence (%) - Black or African American
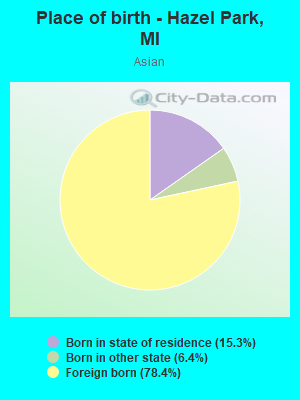
Place of birth - Born in state of residence (%) - Asian
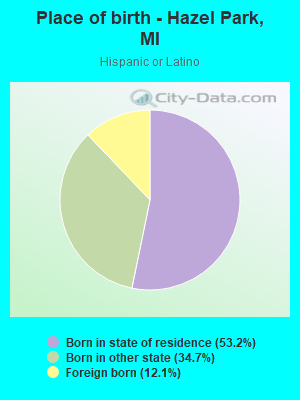
Place of birth - Born in state of residence (%) - Hispanic or Latino
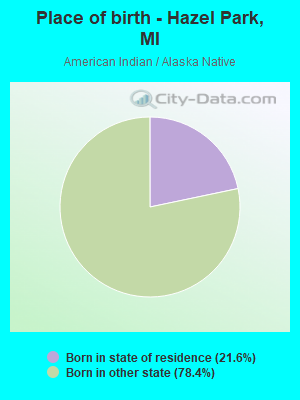
Place of birth - Born in state of residence (%) - American Indian and Alaska Native
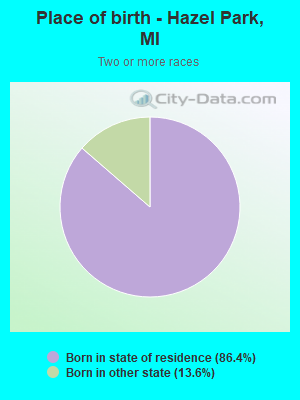
Place of birth - Born in state of residence (%) - Multirace
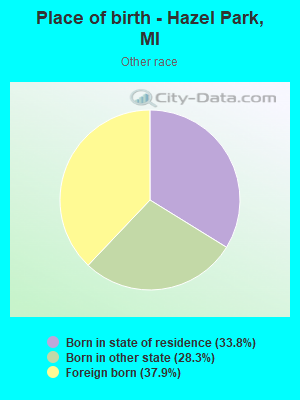
Place of birth - Born in state of residence (%) - Other Race
Place of birth - Born in other state (%)
Place of birth - Born in other state (%) - White
Place of birth - Born in other state (%) - Black or African American
Place of birth - Born in other state (%) - Asian
Place of birth - Born in other state (%) - Hispanic or Latino
Place of birth - Born in other state (%) - American Indian and Alaska Native
Place of birth - Born in other state (%) - Multirace
Place of birth - Born in other state (%) - Other Race
Place of birth - Native, outside of US (%)
Place of birth - Native, outside of US (%) - White
Place of birth - Native, outside of US (%) - Black or African American
Place of birth - Native, outside of US (%) - Asian
Place of birth - Native, outside of US (%) - Hispanic or Latino
Place of birth - Native, outside of US (%) - American Indian and Alaska Native
Place of birth - Native, outside of US (%) - Multirace
Place of birth - Native, outside of US (%) - Other Race
Place of birth - Foreign born (%)
Place of birth - Foreign born (%) - White
Place of birth - Foreign born (%) - Black or African American
Place of birth - Foreign born (%) - Asian
Place of birth - Foreign born (%) - Hispanic or Latino
Place of birth - Foreign born (%) - American Indian and Alaska Native
Place of birth - Foreign born (%) - Multirace
Place of birth - Foreign born (%) - Other Race
Residents speaking English at home (%)
Residents speaking English at home - Born in the United States (%)
Residents speaking English at home - Native, born elsewhere (%)
Residents speaking English at home - Foreign born (%)
Residents speaking Spanish at home (%)
Residents speaking Spanish at home - Born in the United States (%)
Residents speaking Spanish at home - Native, born elsewhere (%)
Residents speaking Spanish at home - Foreign born (%)
Residents speaking other language at home (%)
Residents speaking other language at home - Born in the United States (%)
Residents speaking other language at home - Native, born elsewhere (%)
Residents speaking other language at home - Foreign born (%)
Marital status - Never married (%)
Marital status - Now married (%)
Marital status - Separated (%)
Marital status - Widowed (%)
Marital status - Divorced (%)
Ancestries Reported - Arab (%)
Ancestries Reported - Czech (%)
Ancestries Reported - Danish (%)
Ancestries Reported - Dutch (%)
Ancestries Reported - English (%)
Ancestries Reported - French (%)
Ancestries Reported - French Canadian (%)
Ancestries Reported - German (%)
Ancestries Reported - Greek (%)
Ancestries Reported - Hungarian (%)
Ancestries Reported - Irish (%)
Ancestries Reported - Italian (%)
Ancestries Reported - Lithuanian (%)
Ancestries Reported - Norwegian (%)
Ancestries Reported - Polish (%)
Ancestries Reported - Portuguese (%)
Ancestries Reported - Russian (%)
Ancestries Reported - Scotch-Irish (%)
Ancestries Reported - Scottish (%)
Ancestries Reported - Slovak (%)
Ancestries Reported - Subsaharan African (%)
Ancestries Reported - Swedish (%)
Ancestries Reported - Swiss (%)
Ancestries Reported - Ukrainian (%)
Ancestries Reported - United States (%)
Ancestries Reported - Welsh (%)
Ancestries Reported - West Indian (%)
Ancestries Reported - Other (%)
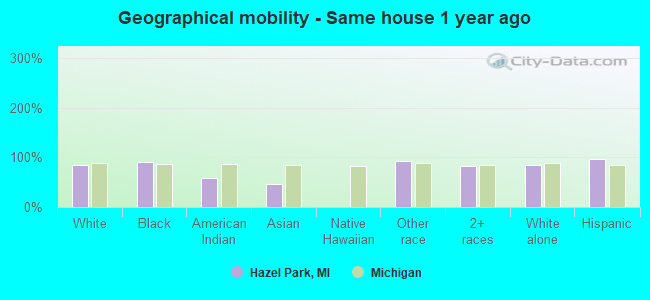
Geographical mobility - Same house 1 year ago (%)
Geographical mobility - Same house 1 year ago (%) - White
Geographical mobility - Same house 1 year ago (%) - Black or African American
Geographical mobility - Same house 1 year ago (%) - Asian
Geographical mobility - Same house 1 year ago (%) - Hispanic or Latino
Geographical mobility - Same house 1 year ago (%) - American Indian and Alaska Native
Geographical mobility - Same house 1 year ago (%) - Multirace
Geographical mobility - Same house 1 year ago (%) - Other Race
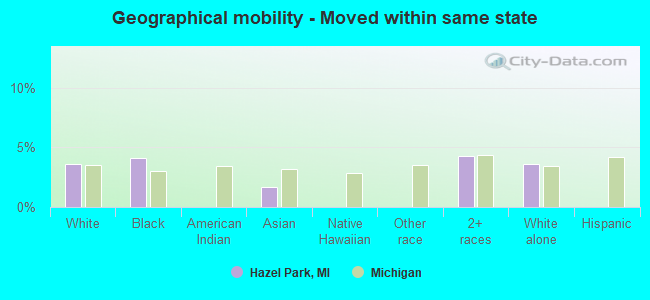
Geographical mobility - Moved within same county (%)
Geographical mobility - Moved within same county (%) - White
Geographical mobility - Moved within same county (%) - Black or African American
Geographical mobility - Moved within same county (%) - Asian
Geographical mobility - Moved within same county (%) - Hispanic or Latino
Geographical mobility - Moved within same county (%) - American Indian and Alaska Native
Geographical mobility - Moved within same county (%) - Multirace
Geographical mobility - Moved within same county (%) - Other Race
Geographical mobility - Moved from different county within same state (%)
Geographical mobility - Moved from different county within same state (%) - White
Geographical mobility - Moved from different county within same state (%) - Black or African American
Geographical mobility - Moved from different county within same state (%) - Asian
Geographical mobility - Moved from different county within same state (%) - Hispanic or Latino
Geographical mobility - Moved from different county within same state (%) - American Indian and Alaska Native
Geographical mobility - Moved from different county within same state (%) - Multirace
Geographical mobility - Moved from different county within same state (%) - Other Race
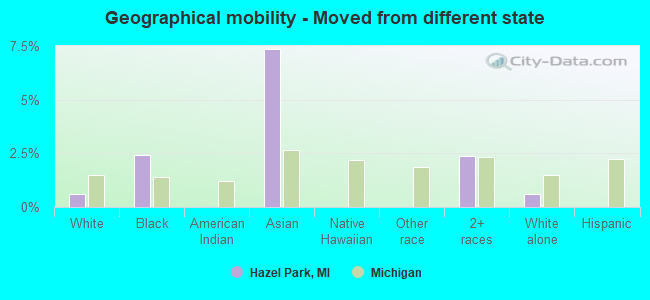
Geographical mobility - Moved from different state (%)
Geographical mobility - Moved from different state (%) - White
Geographical mobility - Moved from different state (%) - Black or African American
Geographical mobility - Moved from different state (%) - Asian
Geographical mobility - Moved from different state (%) - Hispanic or Latino
Geographical mobility - Moved from different state (%) - American Indian and Alaska Native
Geographical mobility - Moved from different state (%) - Multirace
Geographical mobility - Moved from different state (%) - Other Race
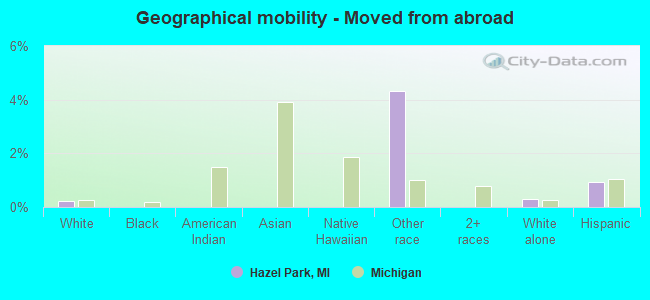
Geographical mobility - Moved from abroad (%)
Geographical mobility - Moved from abroad (%) - White
Geographical mobility - Moved from abroad (%) - Black or African American
Geographical mobility - Moved from abroad (%) - Asian
Geographical mobility - Moved from abroad (%) - Hispanic or Latino
Geographical mobility - Moved from abroad (%) - American Indian and Alaska Native
Geographical mobility - Moved from abroad (%) - Multirace
Geographical mobility - Moved from abroad (%) - Other Race
Place of birth for the foreign-born population - Ireland (%)
Place of birth for the foreign-born population - Denmark (%)
Place of birth for the foreign-born population - Norway (%)
Place of birth for the foreign-born population - Sweden (%)
Place of birth for the foreign-born population - United Kingdom (%)
Place of birth for the foreign-born population - England (%)
Place of birth for the foreign-born population - Scotland (%)
Place of birth for the foreign-born population - Other Northern Europe (%)
Place of birth for the foreign-born population - Austria (%)
Place of birth for the foreign-born population - Belgium (%)
Place of birth for the foreign-born population - France (%)
Place of birth for the foreign-born population - Germany (%)
Place of birth for the foreign-born population - Netherlands (%)
Place of birth for the foreign-born population - Switzerland (%)
Place of birth for the foreign-born population - Other Western Europe (%)
Place of birth for the foreign-born population - Greece (%)
Place of birth for the foreign-born population - Italy (%)
Place of birth for the foreign-born population - Portugal (%)
Place of birth for the foreign-born population - Spain (%)
Place of birth for the foreign-born population - Other Southern Europe (%)
Place of birth for the foreign-born population - Albania (%)
Place of birth for the foreign-born population - Belarus (%)
Place of birth for the foreign-born population - Bosnia and Herzegovina (%)
Place of birth for the foreign-born population - Bulgaria (%)
Place of birth for the foreign-born population - Croatia (%)
Place of birth for the foreign-born population - Czechoslovakia (%)
Place of birth for the foreign-born population - Hungary (%)
Place of birth for the foreign-born population - Latvia (%)
Place of birth for the foreign-born population - Lithuania (%)
Place of birth for the foreign-born population - North Macedonia (Macedonia) (%)
Place of birth for the foreign-born population - Moldova (%)
Place of birth for the foreign-born population - Poland (%)
Place of birth for the foreign-born population - Romania (%)
Place of birth for the foreign-born population - Russia (%)
Place of birth for the foreign-born population - Serbia (%)
Place of birth for the foreign-born population - Ukraine (%)
Place of birth for the foreign-born population - Other Eastern Europe (%)
Place of birth for the foreign-born population - China (%)
Place of birth for the foreign-born population - Hong Kong (%)
Place of birth for the foreign-born population - Taiwan (%)
Place of birth for the foreign-born population - Japan (%)
Place of birth for the foreign-born population - Korea (%)
Place of birth for the foreign-born population - Other Eastern Asia (%)
Place of birth for the foreign-born population - Afghanistan (%)
Place of birth for the foreign-born population - Bangladesh (%)
Place of birth for the foreign-born population - India (%)
Place of birth for the foreign-born population - Iran (%)
Place of birth for the foreign-born population - Kazakhstan (%)
Place of birth for the foreign-born population - Nepal (%)
Place of birth for the foreign-born population - Pakistan (%)
Place of birth for the foreign-born population - Sri Lanka (%)
Place of birth for the foreign-born population - Uzbekistan (%)
Place of birth for the foreign-born population - Other South Central Asia (%)
Place of birth for the foreign-born population - Burma (%)
Place of birth for the foreign-born population - Cambodia (%)
Place of birth for the foreign-born population - Indonesia (%)
Place of birth for the foreign-born population - Laos (%)
Place of birth for the foreign-born population - Malaysia (%)
Place of birth for the foreign-born population - Philippines (%)
Place of birth for the foreign-born population - Singapore (%)
Place of birth for the foreign-born population - Thailand (%)
Place of birth for the foreign-born population - Vietnam (%)
Place of birth for the foreign-born population - Other South Eastern Asia (%)
Place of birth for the foreign-born population - Armenia (%)
Place of birth for the foreign-born population - Iraq (%)
Place of birth for the foreign-born population - Israel (%)
Place of birth for the foreign-born population - Jordan (%)
Place of birth for the foreign-born population - Kuwait (%)
Place of birth for the foreign-born population - Lebanon (%)
Place of birth for the foreign-born population - Saudi Arabia (%)
Place of birth for the foreign-born population - Syria (%)
Place of birth for the foreign-born population - Turkey (%)
Place of birth for the foreign-born population - Yemen (%)
Place of birth for the foreign-born population - Other Western Asia (%)
Place of birth for the foreign-born population - Eritrea (%)
Place of birth for the foreign-born population - Ethiopia (%)
Place of birth for the foreign-born population - Kenya (%)
Place of birth for the foreign-born population - Somalia (%)
Place of birth for the foreign-born population - Uganda (%)
Place of birth for the foreign-born population - Zimbabwe (%)
Place of birth for the foreign-born population - Other Eastern Africa (%)
Place of birth for the foreign-born population - Cameroon (%)
Place of birth for the foreign-born population - Congo (%)
Place of birth for the foreign-born population - Democratic Republic of Congo (Zaire) (%)
Place of birth for the foreign-born population - Other Middle Africa (%)
Place of birth for the foreign-born population - Egypt (%)
Place of birth for the foreign-born population - Morocco (%)
Place of birth for the foreign-born population - Sudan (%)
Place of birth for the foreign-born population - Other Northern Africa (%)
Place of birth for the foreign-born population - South Africa (%)
Place of birth for the foreign-born population - Other Southern Africa (%)
Place of birth for the foreign-born population - Cabo Verde (%)
Place of birth for the foreign-born population - Ghana (%)
Place of birth for the foreign-born population - Liberia (%)
Place of birth for the foreign-born population - Nigeria (%)
Place of birth for the foreign-born population - Senegal (%)
Place of birth for the foreign-born population - Sierra Leone (%)
Place of birth for the foreign-born population - Other Western Africa (%)
Place of birth for the foreign-born population - Australia (%)
Place of birth for the foreign-born population - New Zealand (%)
Place of birth for the foreign-born population - Fiji (%)
Place of birth for the foreign-born population - Micronesia (%)
Place of birth for the foreign-born population - Bahamas (%)
Place of birth for the foreign-born population - Barbados (%)
Place of birth for the foreign-born population - Cuba (%)
Place of birth for the foreign-born population - Dominica (%)
Place of birth for the foreign-born population - Dominican Republic (%)
Place of birth for the foreign-born population - Grenada (%)
Place of birth for the foreign-born population - Haiti (%)
Place of birth for the foreign-born population - Jamaica (%)
Place of birth for the foreign-born population - St. Vincent and the Grenadines (%)
Place of birth for the foreign-born population - Trinidad and Tobago (%)
Place of birth for the foreign-born population - West Indies (%)
Place of birth for the foreign-born population - Other Caribbean (%)
Place of birth for the foreign-born population - Belize (%)
Place of birth for the foreign-born population - Costa Rica (%)
Place of birth for the foreign-born population - El Salvador (%)
Place of birth for the foreign-born population - Guatemala (%)
Place of birth for the foreign-born population - Honduras (%)
Place of birth for the foreign-born population - Mexico (%)
Place of birth for the foreign-born population - Nicaragua (%)
Place of birth for the foreign-born population - Panama (%)
Place of birth for the foreign-born population - Other Central America (%)
Place of birth for the foreign-born population - Argentina (%)
Place of birth for the foreign-born population - Bolivia (%)
Place of birth for the foreign-born population - Brazil (%)
Place of birth for the foreign-born population - Chile (%)
Place of birth for the foreign-born population - Colombia (%)
Place of birth for the foreign-born population - Ecuador (%)
Place of birth for the foreign-born population - Guyana (%)
Place of birth for the foreign-born population - Peru (%)
Place of birth for the foreign-born population - Uruguay (%)
Place of birth for the foreign-born population - Venezuela (%)
Place of birth for the foreign-born population - Other South America (%)
Place of birth for the foreign-born population - Canada (%)
Place of birth for the foreign-born population - Other Northern America (%)
Place of birth for the foreign-born population - Other (%)
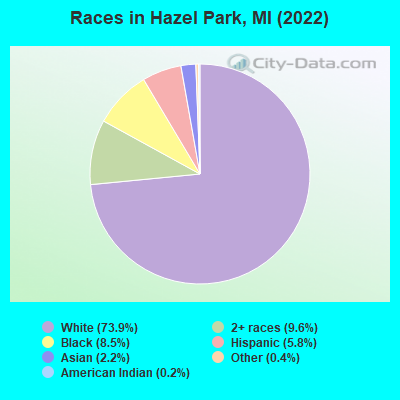
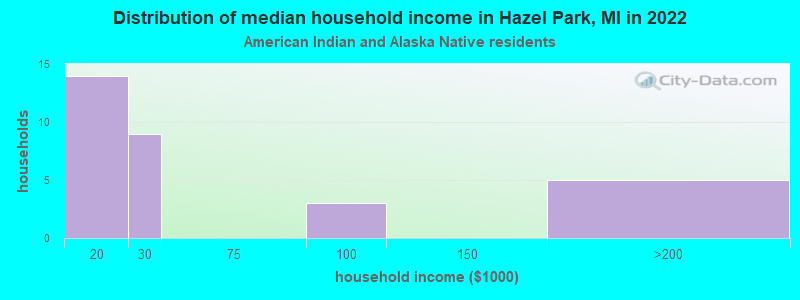
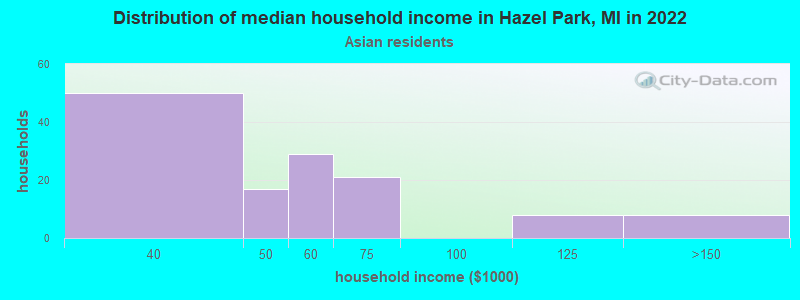
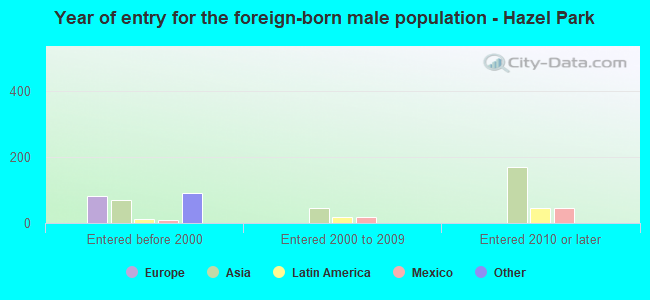
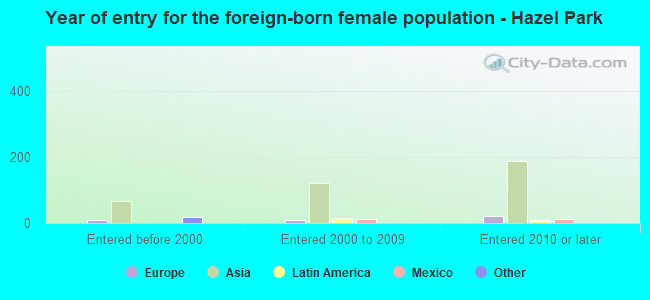
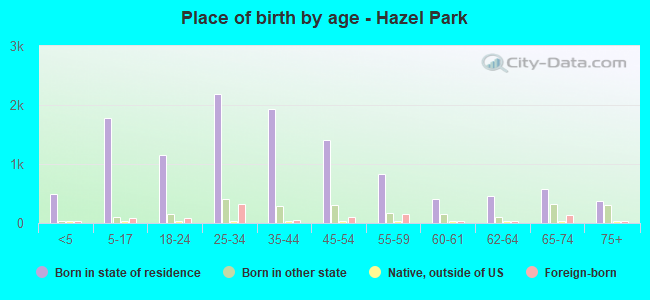
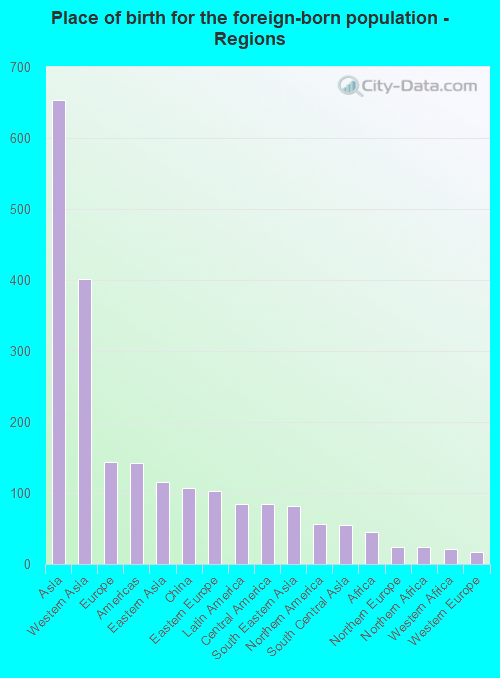
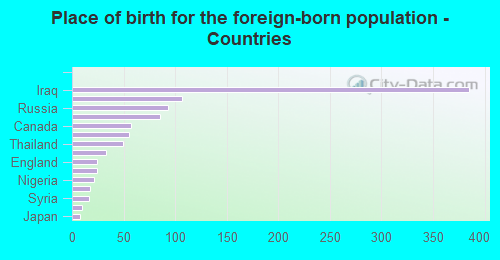
According to 2022 data, the most numerous races in Hazel Park, MI are White alone (11,111 residents), Black alone (1,276 residents), and Hispanic (875 residents). 90.4% of Hazel Park residents speak English at home. 6.5% of Hazel Park, MI residents are foreign-born (4.3% born in Asia, 1.0% born in Europe), which is 8.3% greater than the foreign-born rate of 6.0% across the entire state of Michigan.
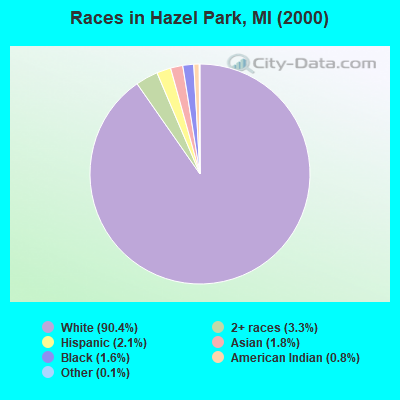
Race distribution in Hazel Park
2000 2022
7,806,691 78.6% White alone 1,402,047 14.1% Black alone 323,877 3.3% Hispanic 175,311 1.8% Asian alone 163,487 1.6% Two or more races 53,421 0.5% American Indian alone 11,465 0.1% Other race alone 2,145 0.02% Native Hawaiian and Other
7,289,051 72.6% White alone 1,310,464 13.1% Black alone 572,405 5.7% Hispanic 450,031 4.5% Two or more races 335,732 3.3% Asian alone 45,217 0.5% Other race alone 29,011 0.3% American Indian alone 2,207 0.02% Native Hawaiian and Other
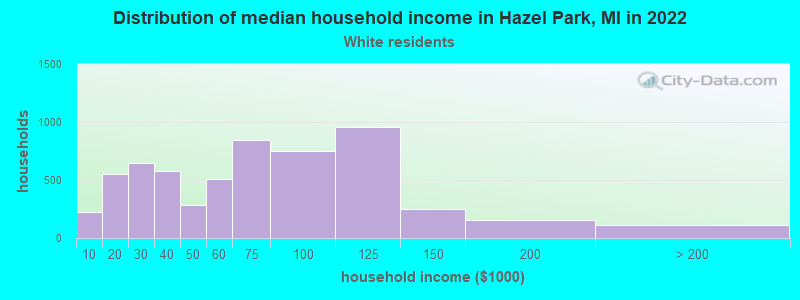
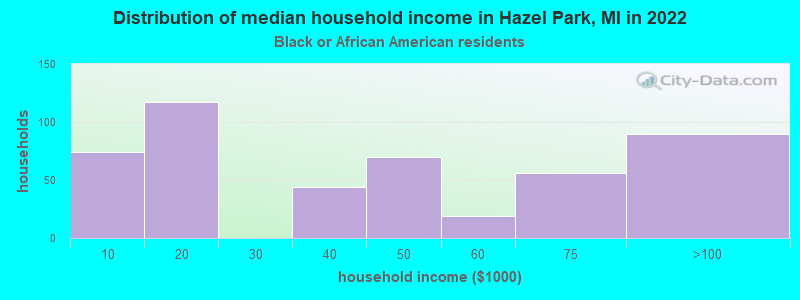
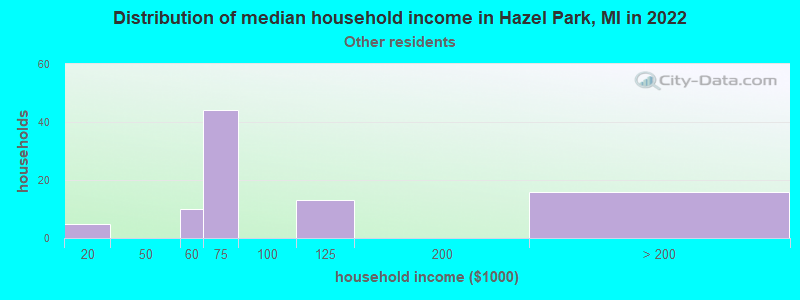
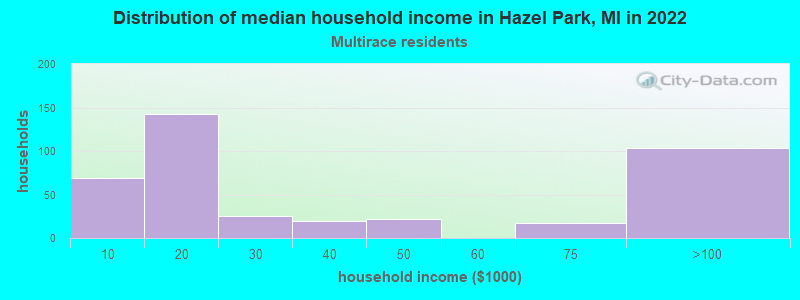
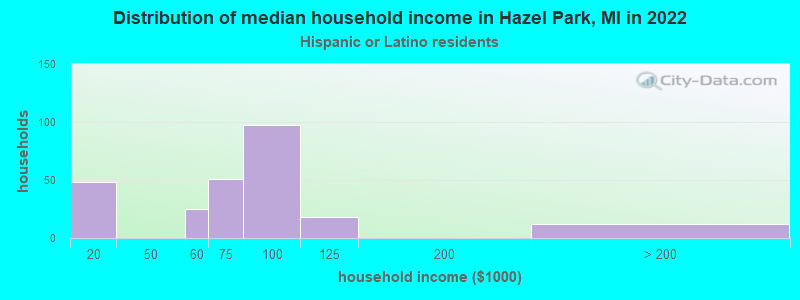
Income and house value in Hazel Park Median household income in 2022 $59,974 White non-Hispanic householders$42,421 Black householders$61,653 Asian householders$83,568 Some other race householders$22,589 Two or more races householders$73,228 Hispanic or Latino race householdersMedian 2022 house value $139,790 White Non-Hispanic householders$283,978 Black or African American householders$230,480 American Indian or Alaska Native householders $174,051 Asian householders$209,594 Some other race householders$157,012 Two or more races householders$183,211 Hispanic or Latino householders
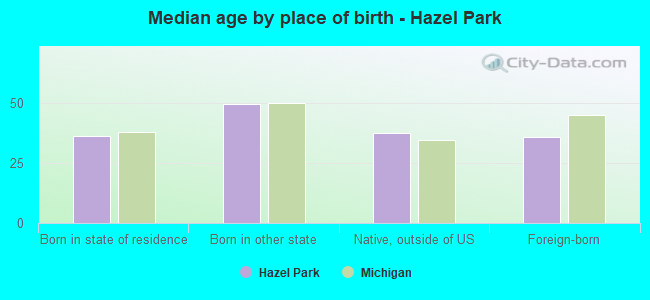
Median age by race in Hazel Park
40.9 Median age for White residents40.5 40.9 29.3 Median age for Black or African American residents29.0 29.8 63.4 Median age for American Indian / Alaska Native residents-505,050,504.5 72.3 26.8 Median age for Asian residents27.3 26.4 -670,531,400.3 Median age for Native Hawaiian / Pacific Islander residents-674,772,035.8 -699,588,476.7 30.0 Median age for Other race residents32.0 30.1 27.1 Median age for Two or more races residents17.4 33.1 40.8 Median age for White alone residents40.5 40.9 28.9 Median age for Hispanic or Latino residents17.2 34.1
Owner/renter occupied households by race in Hazel Park
House owners and renters - White residents 3,562 62.2% Owner occupied2,166 37.8% Renter occupiedHouse owners and renters - Black or African American residents 194 39.8% Owner occupied294 60.2% Renter occupiedHouse owners and renters - American Indian / Alaska Native residents 14 46.2% Owner occupied16 53.8% Renter occupiedHouse owners and renters - Asian residents 67 59.6% Owner occupied46 40.4% Renter occupiedHouse owners and renters - Other race residents 10 10.2% Owner occupied91 89.8% Renter occupiedHouse owners and renters - Two or more races residents 302 86.5% Owner occupied47 13.5% Renter occupiedHouse owners and renters - White alone residents 3,571 62.5% Owner occupied2,146 37.5% Renter occupiedHouse owners and renters - Hispanic or Latino residents 122 51.2% Owner occupied116 48.8% Renter occupied
Language usage in Hazel Park
English speakers - Total 90.4% of residents of Hazel Park speak English at home.
3.7% of residents speak Spanish at home 325 59.7% Speak English very well219 40.3% Speak English less than very well5.9% of residents speak other language at home 533 62.0% Speak English very well327 38.0% Speak English less than very well
English speakers - Born in the United States 93.1% of residents of Hazel Park speak English at home.
7.0% of residents speak Spanish at home 140 85.9% Speak English very well23 14.1% Speak English less than very well1.0% of residents speak other language at home 23 100.0% Speak English very well
English speakers - Native, born elsewhere 75.0% of residents of Hazel Park speak English at home.
31.9% of residents speak other language at home 23 100.0% Speak English very well
English speakers - Foreign-born 22.2% of residents of Hazel Park speak English at home.
11.3% of residents speak Spanish at home 68 60.7% Speak English very well44 39.3% Speak English less than very well65.9% of residents speak other language at home 350 53.5% Speak English very well304 46.5% Speak English less than very well
White (Caucasian) - Speak only English Native:
95.8% (9,952)Foreign-born:
22.5% (120)
White (Caucasian) - Speak another language Native:
4.1% (429)Foreign-born:
76.7% (410)
Black or African American - Speak only English Native:
99.2% (1,328)Foreign-born:
69.8% (20)
Asian - Speak only English Native:
72.9% (37)Foreign-born:
27.2% (72)
Asian - Speak another language Native:
28.3% (14)Foreign-born:
73.4% (193)
Other race - Speak only English Native:
67.8% (154)Foreign-born:
4.0% (5)
Other race - Speak another language Native:
29.9% (68)Foreign-born:
99.6% (129)
White alone - Speak only English Native:
96.2% (9,933)Foreign-born:
21.7% (121)
White alone - Speak another language Native:
3.8% (393)Foreign-born:
77.7% (434)
Hispanic or Latino - Speak another language Native:
27.2% (188)Foreign-born:
100.0% (108)
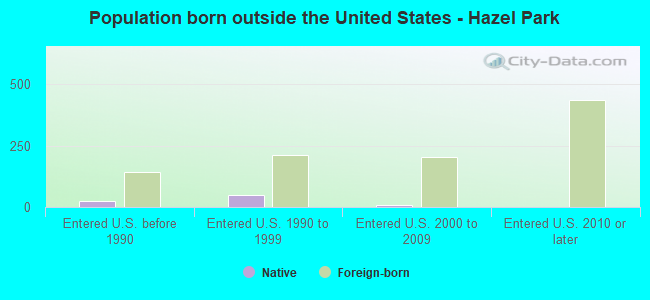
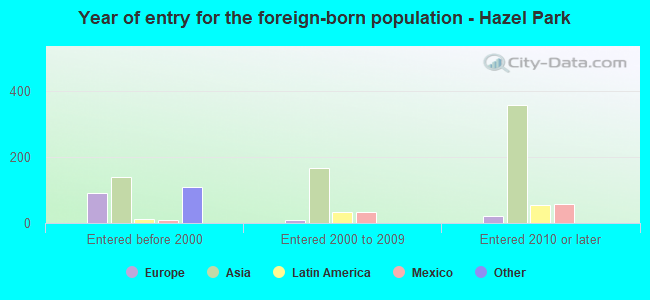
Foreign-born residents in Hazel Park 984 residents are foreign born (4.3% Asia , 1.0% Europe ).
This city:
6.5%Michigan:
6.9%
Marital status for residents in Hazel Park Marital status - White (Caucasian) population 15 years and over
Males 44.4% Never married35.3% Now married1.8% Separated6.9% Widowed11.6% DivorcedFemales 36.8% Never married36.3% Now married2.0% Separated10.5% Widowed14.5% DivorcedWomen who gave birth in the past 12 months Now married:
58.1% (34)Unmarried:
41.9% (25)
Women who did not give birth in the past 12 months Now married:
32.4% (892)Unmarried:
67.6% (1,862)
Marital status - Black or African American population 15 years and over
Males 57.3% Never married33.7% Now married0.0% Separated7.5% Widowed1.6% DivorcedFemales 69.8% Never married18.1% Now married0.0% Separated4.1% Widowed7.9% DivorcedWomen who gave birth in the past 12 months Now married:
0.0% (0)Unmarried:
100.0% (14)
Women who did not give birth in the past 12 months Now married:
22.6% (126)Unmarried:
77.4% (431)
Marital status - American Indian / Alaska Native population 15 years and over
Males 0.0% Never married0.0% Now married0.0% Separated100.0% Widowed0.0% DivorcedFemales 67.6% Never married14.7% Now married0.0% Separated2.9% Widowed14.7% DivorcedWomen who did not give birth in the past 12 months Now married:
0.0% (0)Unmarried:
100.0% (17)
Marital status - Asian population 15 years and over
Males 75.8% Never married24.2% Now married0.0% Separated0.0% Widowed0.0% DivorcedFemales 53.0% Never married25.9% Now married0.0% Separated7.2% Widowed13.9% DivorcedWomen who gave birth in the past 12 months Now married:
0.0% (0)Unmarried:
100.0% (19)
Women who did not give birth in the past 12 months Now married:
27.0% (34)Unmarried:
73.0% (93)
Marital status - Other race population 15 years and over
Males 58.6% Never married32.7% Now married0.0% Separated0.0% Widowed8.6% DivorcedFemales 18.2% Never married81.8% Now married0.0% Separated0.0% Widowed0.0% DivorcedWomen who did not give birth in the past 12 months Now married:
72.4% (31)Unmarried:
27.6% (12)
Marital status - Two or more races population 15 years and over
Males 55.9% Never married35.9% Now married0.0% Separated0.0% Widowed8.2% DivorcedFemales 47.2% Never married30.1% Now married5.7% Separated1.6% Widowed15.4% DivorcedWomen who gave birth in the past 12 months Now married:
10.9% (8)Unmarried:
89.1% (68)
Women who did not give birth in the past 12 months Now married:
30.8% (191)Unmarried:
69.2% (429)
Marital status - White alone, not Hispanic / Latino population 15 years and over
Males 44.1% Never married35.2% Now married1.9% Separated7.0% Widowed11.8% DivorcedFemales 37.1% Never married35.7% Now married2.0% Separated10.6% Widowed14.6% DivorcedWomen who gave birth in the past 12 months Now married:
58.1% (35)Unmarried:
41.9% (25)
Women who did not give birth in the past 12 months Now married:
31.4% (866)Unmarried:
68.6% (1,894)
Marital status - Hispanic or Latino population 15 years and over
Males 62.7% Never married29.0% Now married0.0% Separated0.0% Widowed8.3% DivorcedFemales 60.7% Never married37.7% Now married0.0% Separated0.3% Widowed1.4% DivorcedWomen who gave birth in the past 12 months Now married:
100.0% (7)Unmarried:
0.0% (0)
Women who did not give birth in the past 12 months Now married:
33.9% (125)Unmarried:
66.1% (243)
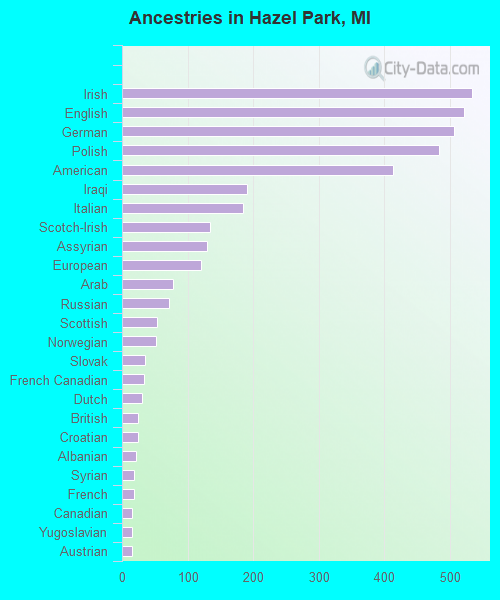
Ancestries in Hazel Park
533 8.8% Irish521 8.6% English506 8.3% German484 8.0% Polish413 6.8% American190 3.1% Iraqi185 3.0% Italian134 2.2% Scotch-Irish130 2.1% Assyrian120 2.0% European78 1.3% Arab72 1.2% Russian54 0.9% Scottish52 0.9% Norwegian35 0.6% Slovak34 0.6% French Canadian30 0.5% Dutch25 0.4% British24 0.4% Croatian22 0.4% Albanian19 0.3% Syrian18 0.3% French16 0.3% Canadian16 0.3% Yugoslavian15 0.2% Austrian15 0.2% Swedish12 0.2% Bulgarian11 0.2% Belgian7 0.1% Welsh6 0.10% Greek1 0.02% Maltese
Geographical mobility in Hazel Park Same house 1 year ago 9,393 84.7% White (Caucasian)1,264 91.4% Black or African American18 58.6% American Indian / Alaska Native148 47.1% Asian324 93.0% Other race1,573 82.4% Two or more races9,334 84.5% White alone, not Hispanic / Latino834 96.7% Hispanic or LatinoMoved within same county 1,229 11.1% White / Caucasian46 3.4% Black or African American8 26.4% American Indian / Alaska Native108 34.6% Asian7 94.6% Native Hawaiian / Pacific Islander10 3.0% Other race190 10.0% Two or more races1,232 11.1% White alone, not Hispanic / Latino24 2.8% Hispanic or LatinoMoved within same state 399 3.6% White / Caucasian57 4.1% Black or African American5 1.7% Asian81 4.3% Two or more races394 3.6% White alone, not Hispanic / LatinoMoved from different state 65 0.6% White / Caucasian33 2.4% Black or African American23 7.4% Asian45 2.4% Two or more races69 0.6% White alone, not Hispanic / LatinoMoved from abroad 24 0.2% White15 4.3% Other race32 0.3% White alone, not Hispanic / Latino8 0.9% Hispanic or Latino
Children Nativity (place of birth) in Hazel Park
Children under 6 years - Living with two parents Both parents native 166 100.0% NativeBoth parents foreign-born 14 100.0% NativeChildren under 6 years - Living with one parent Native parent 372 100.0% NativeForeign-born parent 44 100.0% NativeChildren 6 to 17 years - Living with two parents Both parents native 734 99.0% Native8 1.0% Foreign-bornBoth parents foreign-born 27 25.2% Native81 74.8% Foreign-bornOne native, one foreign-born parent 17 100.0% NativeChildren 6 to 17 years - Living with one parent Native parent 979 100.0% Native
Grandparents responsible for own grandchildren in Hazel Park
Grandparents (30 to 59 years) White / Caucasian 3 6.3% Responsible for grandchildren40 93.7% Not responsible for grandchildrenBlack or African American 15 28.5% Responsible for grandchildren37 71.5% Not responsible for grandchildrenAsian 56 100.0% Responsible for grandchildrenWhite alone, not Hispanic / Latino 3 6.4% Responsible for grandchildren41 93.6% Not responsible for grandchildren
Grandparents (60 years and over) White / Caucasian 155 100.0% Not responsible for grandchildrenBlack or African American 36 100.0% Responsible for grandchildrenWhite alone, not Hispanic / Latino 156 100.0% Not responsible for grandchildren