Races in Greatwood, Texas (TX) Detailed Stats
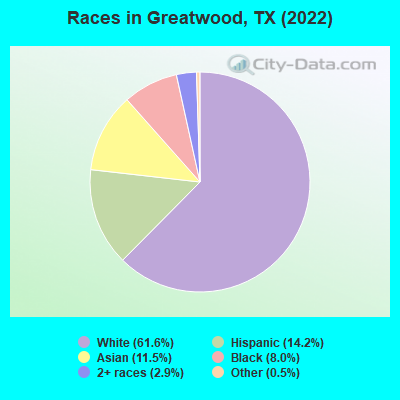
According to 2022 data, the most numerous races in Greatwood, TX are Hispanic (1,876 residents), White alone (8,147 residents), and Black alone (1,064 residents). 82.9% of Greatwood residents speak English at home. 11.6% of Greatwood, TX residents are foreign-born (6.3% born in Asia, 2.6% born in Latin America, 1.7% born in Africa, 1.2% born in Europe), which is 46.9% less than the foreign-born rate of 17.0% across the entire state of Texas.
Race distribution in Greatwood
2000 2022
10,933,313 52.4% White alone 6,669,666 32.0% Hispanic 2,364,255 11.3% Black alone 554,445 2.7% Asian alone 230,567 1.1% Two or more races 68,859 0.3% American Indian alone 19,958 0.10% Other race alone 10,757 0.05% Native Hawaiian and Other
12,070,642 40.2% Hispanic 11,683,430 38.9% White alone 3,508,706 11.7% Black alone 1,608,173 5.4% Asian alone 956,560 3.2% Two or more races 125,763 0.4% Other race alone 47,023 0.2% American Indian alone 29,275 0.10% Native Hawaiian and Other
Income and house value in Greatwood Median household income in 2022 $190,539 White non-Hispanic householders$182,920 Black householdersover $200,000 Asian householdersover $200,000 Some other race householders$181,420 Two or more races householdersover $200,000 Hispanic or Latino race householdersMedian 2022 house value $611,174 White Non-Hispanic householders$613,396 Black or African American householders $535,650 Asian householders$458,857 Some other race householders$594,990 Two or more races householders$613,396 Hispanic or Latino householders
Median age by race in Greatwood
42.8 Median age for White residents45.5 41.9 38.2 Median age for Black or African American residents26.0 50.3 42.6 Median age for American Indian / Alaska Native residents41.2 Median age for Asian residents39.3 42.8 50.7 Median age for Other race residents45.8 80.7 17.8 Median age for Two or more races residents9.6 18.5 42.7 Median age for White alone residents44.9 41.2 42.6 Median age for Hispanic or Latino residents41.9 42.5
Owner/renter occupied households by race in Greatwood
House owners and renters - White residents 2,864 90.1% Owner occupied314 9.9% Renter occupiedHouse owners and renters - Black or African American residents 302 100.0% Owner occupiedHouse owners and renters - Asian residents 569 97.0% Owner occupied17 3.0% Renter occupiedHouse owners and renters - Other race residents 142 100.0% Owner occupiedHouse owners and renters - Two or more races residents 371 100.0% Owner occupiedHouse owners and renters - White alone residents 2,738 88.3% Owner occupied363 11.7% Renter occupiedHouse owners and renters - Hispanic or Latino residents 591 100.0% Owner occupied
Language usage in Greatwood
English speakers - Total 82.9% of residents of Greatwood speak English at home.
7.2% of residents speak Spanish at home 760 84.4% Speak English very well141 15.6% Speak English less than very well11.4% of residents speak other language at home 1,028 72.0% Speak English very well399 28.0% Speak English less than very well
English speakers - Born in the United States 94.8% of residents of Greatwood speak English at home.
3.6% of residents speak Spanish at home 144 100.0% Speak English very well1.3% of residents speak other language at home 40 75.5% Speak English very well13 24.5% Speak English less than very well
English speakers - Native, born elsewhere 77.3% of residents of Greatwood speak English at home.
12.4% of residents speak Spanish at home 28 100.0% Speak English very well5.8% of residents speak other language at home 13 100.0% Speak English very well
English speakers - Foreign-born 28.5% of residents of Greatwood speak English at home.
18.2% of residents speak Spanish at home 241 76.5% Speak English very well74 23.5% Speak English less than very well66.7% of residents speak other language at home 831 71.8% Speak English very well326 28.2% Speak English less than very well
White (Caucasian) - Speak only English Native:
100.0% (8,172)Foreign-born:
41.3% (133)
White (Caucasian) - Speak another language Native:
4.7% (388)Foreign-born:
65.9% (212)
Black or African American - Speak only English Native:
96.6% (709)Foreign-born:
25.4% (69)
Black or African American - Speak another language Native:
2.8% (20)Foreign-born:
71.1% (193)
Asian - Speak only English Native:
84.3% (447)Foreign-born:
28.4% (285)
Asian - Speak another language Native:
26.1% (139)Foreign-born:
76.8% (770)
Other race - Speak another language Native:
42.6% (95)Foreign-born:
98.5% (39)
Two or more races - Speak only English Native:
39.1% (191)Foreign-born:
12.7% (79)
Two or more races - Speak another language Native:
51.4% (251)Foreign-born:
89.4% (554)
White alone - Speak only English Native:
98.3% (7,788)Foreign-born:
49.8% (124)
White alone - Speak another language Native:
1.6% (130)Foreign-born:
47.8% (120)
Hispanic or Latino - Speak only English Native:
64.8% (929)Foreign-born:
14.3% (56)
Hispanic or Latino - Speak another language Native:
39.1% (561)Foreign-born:
84.6% (330)
Foreign-born residents in Greatwood 1,606 residents are foreign born (6.3% Asia , 2.6% Latin America , 1.7% Africa , 1.2% Europe ).
This city:
11.6%Texas:
100.0%
Marital status for residents in Greatwood Marital status - White (Caucasian) population 15 years and over
Males 17.1% Never married76.8% Now married0.0% Separated2.8% Widowed3.3% DivorcedFemales 16.5% Never married66.4% Now married1.3% Separated6.6% Widowed9.3% DivorcedWomen who gave birth in the past 12 months Now married:
100.0% (65)Unmarried:
0.0% (0)
Women who did not give birth in the past 12 months Now married:
64.2% (1,241)Unmarried:
35.8% (693)
Marital status - Black or African American population 15 years and over
Males 29.2% Never married62.5% Now married0.0% Separated0.0% Widowed8.3% DivorcedFemales 23.4% Never married56.6% Now married0.0% Separated14.2% Widowed5.8% DivorcedWomen who did not give birth in the past 12 months Now married:
61.8% (119)Unmarried:
38.2% (74)
Marital status - Asian population 15 years and over
Males 14.8% Never married77.0% Now married0.0% Separated0.0% Widowed8.1% DivorcedFemales 29.7% Never married64.8% Now married0.0% Separated1.6% Widowed3.9% DivorcedWomen who gave birth in the past 12 months Now married:
100.0% (17)Unmarried:
0.0% (0)
Women who did not give birth in the past 12 months Now married:
53.8% (215)Unmarried:
46.2% (184)
Marital status - Other race population 15 years and over
Males 41.7% Never married20.8% Now married0.0% Separated0.0% Widowed37.5% DivorcedFemales 17.1% Never married65.9% Now married0.0% Separated17.1% Widowed0.0% DivorcedWomen who did not give birth in the past 12 months Now married:
0.0% (0)Unmarried:
100.0% (18)
Marital status - Two or more races population 15 years and over
Males 0.0% Never married60.8% Now married0.0% Separated0.0% Widowed39.2% DivorcedFemales 0.0% Never married32.8% Now married0.0% Separated0.0% Widowed67.2% DivorcedWomen who did not give birth in the past 12 months Now married:
0.0% (0)Unmarried:
100.0% (130)
Marital status - White alone, not Hispanic / Latino population 15 years and over
Males 15.6% Never married77.3% Now married0.0% Separated3.3% Widowed3.8% DivorcedFemales 17.1% Never married65.4% Now married1.4% Separated6.0% Widowed10.0% DivorcedWomen who gave birth in the past 12 months Now married:
100.0% (74)Unmarried:
0.0% (0)
Women who did not give birth in the past 12 months Now married:
60.6% (1,104)Unmarried:
39.4% (718)
Marital status - Hispanic or Latino population 15 years and over
Males 26.7% Never married66.4% Now married0.0% Separated0.0% Widowed7.0% DivorcedFemales 12.0% Never married66.8% Now married0.0% Separated10.4% Widowed10.7% DivorcedWomen who did not give birth in the past 12 months Now married:
74.9% (376)Unmarried:
25.1% (126)
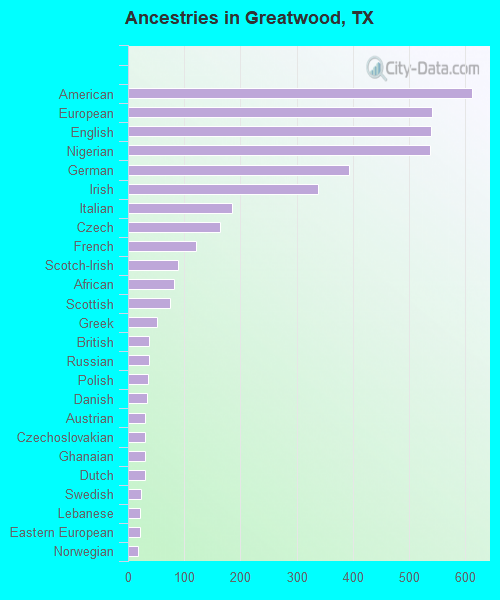
Ancestries in Greatwood
612 9.4% American542 8.3% European539 8.2% English538 8.2% Nigerian394 6.0% German338 5.2% Irish186 2.8% Italian164 2.5% Czech121 1.9% French89 1.4% Scotch-Irish81 1.2% African74 1.1% Scottish51 0.8% Greek38 0.6% British37 0.6% Russian36 0.6% Polish34 0.5% Danish31 0.5% Austrian31 0.5% Czechoslovakian31 0.5% Ghanaian30 0.5% Dutch24 0.4% Swedish22 0.3% Lebanese22 0.3% Eastern European17 0.3% Norwegian17 0.3% Portuguese14 0.2% Palestinian14 0.2% Turkish11 0.2% French Canadian8 0.1% Lithuanian7 0.1% Hungarian6 0.09% Cajun5 0.08% Belgian5 0.08% Canadian
Geographical mobility in Greatwood Same house 1 year ago 7,776 96.5% White (Caucasian)1,041 97.6% Black or African American1,532 96.9% Asian234 79.9% Other race2,506 100.0% Two or more races7,791 96.6% White alone, not Hispanic / Latino1,796 96.0% Hispanic or LatinoMoved within same county 134 1.7% White / Caucasian42 3.9% Black or African American42 2.7% Asian161 2.0% White alone, not Hispanic / LatinoMoved within same state 109 1.3% White / Caucasian19 0.8% Two or more races119 1.5% White alone, not Hispanic / LatinoMoved from different state 143 1.8% White / Caucasian20 1.9% Black or African American92 1.1% White alone, not Hispanic / Latino70 3.7% Hispanic or LatinoMoved from abroad 3 0.0% White18 1.1% Asian89 30.4% Other race63 3.4% Hispanic or Latino
Children Nativity (place of birth) in Greatwood
Children under 6 years - Living with two parents Both parents native 775 100.0% NativeBoth parents foreign-born 34 100.0% NativeOne native, one foreign-born parent 95 100.0% NativeChildren under 6 years - Living with one parent Native parent 18 100.0% NativeForeign-born parent 15 100.0% NativeChildren 6 to 17 years - Living with two parents Both parents native 1,829 97.6% Native45 2.4% Foreign-bornBoth parents foreign-born 325 96.8% Native11 3.2% Foreign-bornOne native, one foreign-born parent 183 100.0% NativeChildren 6 to 17 years - Living with one parent Native parent 494 100.0% NativeForeign-born parent 77 49.9% Native78 50.1% Foreign-born