Races in Gilford, New Hampshire (NH) Detailed Stats
Ancestries, Foreign-born residents, place of birth

Recent posts about races in Gilford, New Hampshire on our local forum with over 2,400,000 registered users:
 | Best area for a lake house? (11 replies) |
| Restaurant suggestions near the Lake Region? (15 replies) |
| Open/Concealed carry in NH (19 replies) |
| Thinking of retiring to NH (67 replies) |
| Meredith NH - Other Towns? (30 replies) |
| Gilford NH- Greyhound Bus Station (26 replies) |
Latest news about races in Gilford, NH collected exclusively by city-data.com from local newspapers, TV, and radio stations
2.3% of Gilford, NH residents are foreign-born (1.5% born in Europe, 0.6% born in Asia), which is 116.7% less than the foreign-born rate of 5.0% across the entire state of New Hampshire.
Race distribution in Gilford

- 6,66698.0%White alone
- 390.6%Hispanic
- 430.6%Two or more races
- 320.5%Asian alone
- 120.2%Black alone
- 100.1%American Indian alone
- 10.01%Other race alone

2000
2022
-
- 1,175,25295.1%White alone
- 20,4891.7%Hispanic
- 15,8031.3%Asian alone
- 11,6060.9%Two or more races
- 8,3540.7%Black alone
- 2,6980.2%American Indian alone
- 1,2540.1%Other race alone
- 3300.03%Native Hawaiian and Other
Pacific Islander alone

-
- 1,208,10186.6%White alone
- 63,4794.5%Hispanic
- 60,7244.4%Two or more races
- 36,5192.6%Asian alone
- 17,9311.3%Black alone
- 6,6150.5%Other race alone
- 1,0140.07%American Indian alone
- 8480.06%Native Hawaiian and Other
Pacific Islander alone

Income and house value in Gilford
- Median household income in 2022
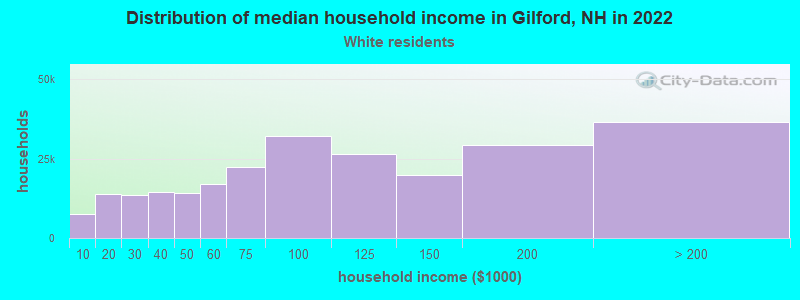
- $89,086White non-Hispanic householders
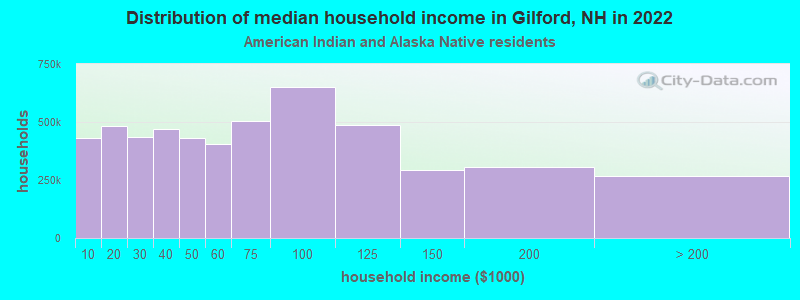
- over $200,000American Indian and Alaska Native householders
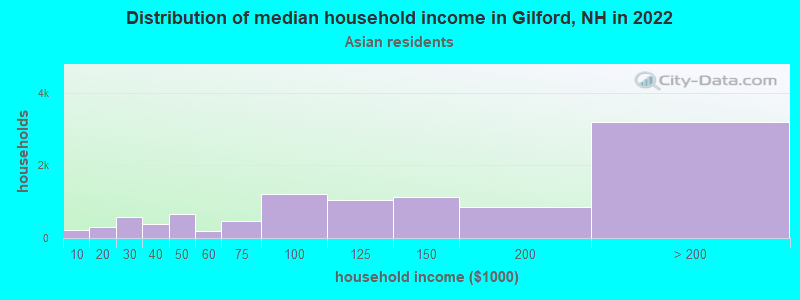
- $98,019Asian householders
- $76,033Some other race householders
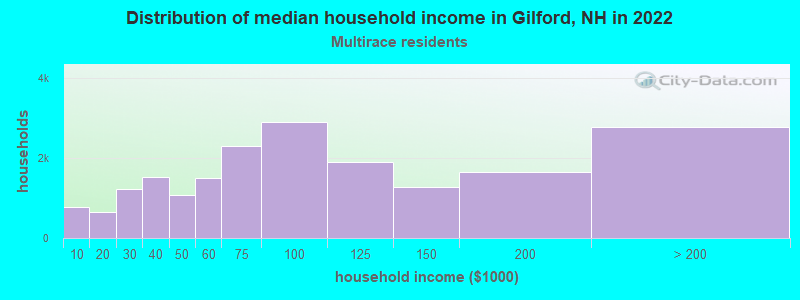
- $119,295Two or more races householders
- Median 2022 house value
- $436,294White Non-Hispanic householders
- $322,436Asian householders
- $527,121Two or more races householders
Household income for White non-Hispanic householders
Household income for American Indian and Alaska Native householders
Household income for Asian householders
Household income for Two or more races householders
Foreign-born residents in Gilford
157 residents are foreign born (1.5% Europe, 0.6% Asia).
| This city: | 2.3% |
| New Hampshire: | 4.4% |
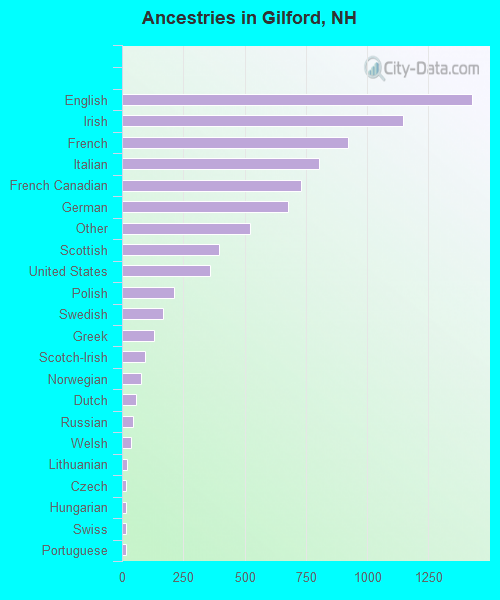
Ancestries in Gilford

- 1,42618.0%English
- 1,14614.5%Irish
- 92111.7%French
- 80510.2%Italian
- 7329.3%French Canadian
- 6788.6%German
- 5226.6%Other
- 3975.0%Scottish
- 3574.5%United States
- 2122.7%Polish
- 1682.1%Swedish
- 1311.7%Greek
- 921.2%Scotch-Irish
- 791.0%Norwegian
- 580.7%Dutch
- 460.6%Russian
- 350.4%Welsh
- 200.3%Lithuanian
- 180.2%Czech
- 170.2%Hungarian
- 160.2%Swiss
- 150.2%Portuguese
- 110.1%Danish
Zip codes: 03246.