Races in Four Corners, Oregon (OR) Detailed Stats
Data:
Races - White alone (%)
Races - White alone (% change since 2000)
Races - Black alone (%)
Races - Black alone (% change since 2000)
Races - American Indian alone (%)
Races - American Indian alone (% change since 2000)
Races - Asian alone (%)
Races - Asian alone (% change since 2000)
Races - Hispanic (%)
Races - Hispanic (% change since 2000)
Races - Native Hawaiian and Other Pacific Islander alone (%)
Races - Native Hawaiian and Other Pacific Islander alone (% change since 2000)
Races - Two or more races(%)
Races - Two or more races(% change since 2000)
Races - Other race alone (%)
Races - Other race alone (% change since 2000)
Racial diversity
Place of birth - Born in state of residence (%)
Place of birth - Born in state of residence (%) - White
Place of birth - Born in state of residence (%) - Black or African American
Place of birth - Born in state of residence (%) - Asian
Place of birth - Born in state of residence (%) - Hispanic or Latino
Place of birth - Born in state of residence (%) - American Indian and Alaska Native
Place of birth - Born in state of residence (%) - Multirace
Place of birth - Born in state of residence (%) - Other Race
Place of birth - Born in other state (%)
Place of birth - Born in other state (%) - White
Place of birth - Born in other state (%) - Black or African American
Place of birth - Born in other state (%) - Asian
Place of birth - Born in other state (%) - Hispanic or Latino
Place of birth - Born in other state (%) - American Indian and Alaska Native
Place of birth - Born in other state (%) - Multirace
Place of birth - Born in other state (%) - Other Race
Place of birth - Native, outside of US (%)
Place of birth - Native, outside of US (%) - White
Place of birth - Native, outside of US (%) - Black or African American
Place of birth - Native, outside of US (%) - Asian
Place of birth - Native, outside of US (%) - Hispanic or Latino
Place of birth - Native, outside of US (%) - American Indian and Alaska Native
Place of birth - Native, outside of US (%) - Multirace
Place of birth - Native, outside of US (%) - Other Race
Place of birth - Foreign born (%)
Place of birth - Foreign born (%) - White
Place of birth - Foreign born (%) - Black or African American
Place of birth - Foreign born (%) - Asian
Place of birth - Foreign born (%) - Hispanic or Latino
Place of birth - Foreign born (%) - American Indian and Alaska Native
Place of birth - Foreign born (%) - Multirace
Place of birth - Foreign born (%) - Other Race
Residents speaking English at home (%)
Residents speaking English at home - Born in the United States (%)
Residents speaking English at home - Native, born elsewhere (%)
Residents speaking English at home - Foreign born (%)
Residents speaking Spanish at home (%)
Residents speaking Spanish at home - Born in the United States (%)
Residents speaking Spanish at home - Native, born elsewhere (%)
Residents speaking Spanish at home - Foreign born (%)
Residents speaking other language at home (%)
Residents speaking other language at home - Born in the United States (%)
Residents speaking other language at home - Native, born elsewhere (%)
Residents speaking other language at home - Foreign born (%)
Marital status - Never married (%)
Marital status - Now married (%)
Marital status - Separated (%)
Marital status - Widowed (%)
Marital status - Divorced (%)
Ancestries Reported - Arab (%)
Ancestries Reported - Czech (%)
Ancestries Reported - Danish (%)
Ancestries Reported - Dutch (%)
Ancestries Reported - English (%)
Ancestries Reported - French (%)
Ancestries Reported - French Canadian (%)
Ancestries Reported - German (%)
Ancestries Reported - Greek (%)
Ancestries Reported - Hungarian (%)
Ancestries Reported - Irish (%)
Ancestries Reported - Italian (%)
Ancestries Reported - Lithuanian (%)
Ancestries Reported - Norwegian (%)
Ancestries Reported - Polish (%)
Ancestries Reported - Portuguese (%)
Ancestries Reported - Russian (%)
Ancestries Reported - Scotch-Irish (%)
Ancestries Reported - Scottish (%)
Ancestries Reported - Slovak (%)
Ancestries Reported - Subsaharan African (%)
Ancestries Reported - Swedish (%)
Ancestries Reported - Swiss (%)
Ancestries Reported - Ukrainian (%)
Ancestries Reported - United States (%)
Ancestries Reported - Welsh (%)
Ancestries Reported - West Indian (%)
Ancestries Reported - Other (%)
Geographical mobility - Same house 1 year ago (%)
Geographical mobility - Same house 1 year ago (%) - White
Geographical mobility - Same house 1 year ago (%) - Black or African American
Geographical mobility - Same house 1 year ago (%) - Asian
Geographical mobility - Same house 1 year ago (%) - Hispanic or Latino
Geographical mobility - Same house 1 year ago (%) - American Indian and Alaska Native
Geographical mobility - Same house 1 year ago (%) - Multirace
Geographical mobility - Same house 1 year ago (%) - Other Race
Geographical mobility - Moved within same county (%)
Geographical mobility - Moved within same county (%) - White
Geographical mobility - Moved within same county (%) - Black or African American
Geographical mobility - Moved within same county (%) - Asian
Geographical mobility - Moved within same county (%) - Hispanic or Latino
Geographical mobility - Moved within same county (%) - American Indian and Alaska Native
Geographical mobility - Moved within same county (%) - Multirace
Geographical mobility - Moved within same county (%) - Other Race
Geographical mobility - Moved from different county within same state (%)
Geographical mobility - Moved from different county within same state (%) - White
Geographical mobility - Moved from different county within same state (%) - Black or African American
Geographical mobility - Moved from different county within same state (%) - Asian
Geographical mobility - Moved from different county within same state (%) - Hispanic or Latino
Geographical mobility - Moved from different county within same state (%) - American Indian and Alaska Native
Geographical mobility - Moved from different county within same state (%) - Multirace
Geographical mobility - Moved from different county within same state (%) - Other Race
Geographical mobility - Moved from different state (%)
Geographical mobility - Moved from different state (%) - White
Geographical mobility - Moved from different state (%) - Black or African American
Geographical mobility - Moved from different state (%) - Asian
Geographical mobility - Moved from different state (%) - Hispanic or Latino
Geographical mobility - Moved from different state (%) - American Indian and Alaska Native
Geographical mobility - Moved from different state (%) - Multirace
Geographical mobility - Moved from different state (%) - Other Race
Geographical mobility - Moved from abroad (%)
Geographical mobility - Moved from abroad (%) - White
Geographical mobility - Moved from abroad (%) - Black or African American
Geographical mobility - Moved from abroad (%) - Asian
Geographical mobility - Moved from abroad (%) - Hispanic or Latino
Geographical mobility - Moved from abroad (%) - American Indian and Alaska Native
Geographical mobility - Moved from abroad (%) - Multirace
Geographical mobility - Moved from abroad (%) - Other Race
Place of birth for the foreign-born population - Ireland (%)
Place of birth for the foreign-born population - Denmark (%)
Place of birth for the foreign-born population - Norway (%)
Place of birth for the foreign-born population - Sweden (%)
Place of birth for the foreign-born population - United Kingdom (%)
Place of birth for the foreign-born population - England (%)
Place of birth for the foreign-born population - Scotland (%)
Place of birth for the foreign-born population - Other Northern Europe (%)
Place of birth for the foreign-born population - Austria (%)
Place of birth for the foreign-born population - Belgium (%)
Place of birth for the foreign-born population - France (%)
Place of birth for the foreign-born population - Germany (%)
Place of birth for the foreign-born population - Netherlands (%)
Place of birth for the foreign-born population - Switzerland (%)
Place of birth for the foreign-born population - Other Western Europe (%)
Place of birth for the foreign-born population - Greece (%)
Place of birth for the foreign-born population - Italy (%)
Place of birth for the foreign-born population - Portugal (%)
Place of birth for the foreign-born population - Spain (%)
Place of birth for the foreign-born population - Other Southern Europe (%)
Place of birth for the foreign-born population - Albania (%)
Place of birth for the foreign-born population - Belarus (%)
Place of birth for the foreign-born population - Bosnia and Herzegovina (%)
Place of birth for the foreign-born population - Bulgaria (%)
Place of birth for the foreign-born population - Croatia (%)
Place of birth for the foreign-born population - Czechoslovakia (%)
Place of birth for the foreign-born population - Hungary (%)
Place of birth for the foreign-born population - Latvia (%)
Place of birth for the foreign-born population - Lithuania (%)
Place of birth for the foreign-born population - North Macedonia (Macedonia) (%)
Place of birth for the foreign-born population - Moldova (%)
Place of birth for the foreign-born population - Poland (%)
Place of birth for the foreign-born population - Romania (%)
Place of birth for the foreign-born population - Russia (%)
Place of birth for the foreign-born population - Serbia (%)
Place of birth for the foreign-born population - Ukraine (%)
Place of birth for the foreign-born population - Other Eastern Europe (%)
Place of birth for the foreign-born population - China (%)
Place of birth for the foreign-born population - Hong Kong (%)
Place of birth for the foreign-born population - Taiwan (%)
Place of birth for the foreign-born population - Japan (%)
Place of birth for the foreign-born population - Korea (%)
Place of birth for the foreign-born population - Other Eastern Asia (%)
Place of birth for the foreign-born population - Afghanistan (%)
Place of birth for the foreign-born population - Bangladesh (%)
Place of birth for the foreign-born population - India (%)
Place of birth for the foreign-born population - Iran (%)
Place of birth for the foreign-born population - Kazakhstan (%)
Place of birth for the foreign-born population - Nepal (%)
Place of birth for the foreign-born population - Pakistan (%)
Place of birth for the foreign-born population - Sri Lanka (%)
Place of birth for the foreign-born population - Uzbekistan (%)
Place of birth for the foreign-born population - Other South Central Asia (%)
Place of birth for the foreign-born population - Burma (%)
Place of birth for the foreign-born population - Cambodia (%)
Place of birth for the foreign-born population - Indonesia (%)
Place of birth for the foreign-born population - Laos (%)
Place of birth for the foreign-born population - Malaysia (%)
Place of birth for the foreign-born population - Philippines (%)
Place of birth for the foreign-born population - Singapore (%)
Place of birth for the foreign-born population - Thailand (%)
Place of birth for the foreign-born population - Vietnam (%)
Place of birth for the foreign-born population - Other South Eastern Asia (%)
Place of birth for the foreign-born population - Armenia (%)
Place of birth for the foreign-born population - Iraq (%)
Place of birth for the foreign-born population - Israel (%)
Place of birth for the foreign-born population - Jordan (%)
Place of birth for the foreign-born population - Kuwait (%)
Place of birth for the foreign-born population - Lebanon (%)
Place of birth for the foreign-born population - Saudi Arabia (%)
Place of birth for the foreign-born population - Syria (%)
Place of birth for the foreign-born population - Turkey (%)
Place of birth for the foreign-born population - Yemen (%)
Place of birth for the foreign-born population - Other Western Asia (%)
Place of birth for the foreign-born population - Eritrea (%)
Place of birth for the foreign-born population - Ethiopia (%)
Place of birth for the foreign-born population - Kenya (%)
Place of birth for the foreign-born population - Somalia (%)
Place of birth for the foreign-born population - Uganda (%)
Place of birth for the foreign-born population - Zimbabwe (%)
Place of birth for the foreign-born population - Other Eastern Africa (%)
Place of birth for the foreign-born population - Cameroon (%)
Place of birth for the foreign-born population - Congo (%)
Place of birth for the foreign-born population - Democratic Republic of Congo (Zaire) (%)
Place of birth for the foreign-born population - Other Middle Africa (%)
Place of birth for the foreign-born population - Egypt (%)
Place of birth for the foreign-born population - Morocco (%)
Place of birth for the foreign-born population - Sudan (%)
Place of birth for the foreign-born population - Other Northern Africa (%)
Place of birth for the foreign-born population - South Africa (%)
Place of birth for the foreign-born population - Other Southern Africa (%)
Place of birth for the foreign-born population - Cabo Verde (%)
Place of birth for the foreign-born population - Ghana (%)
Place of birth for the foreign-born population - Liberia (%)
Place of birth for the foreign-born population - Nigeria (%)
Place of birth for the foreign-born population - Senegal (%)
Place of birth for the foreign-born population - Sierra Leone (%)
Place of birth for the foreign-born population - Other Western Africa (%)
Place of birth for the foreign-born population - Australia (%)
Place of birth for the foreign-born population - New Zealand (%)
Place of birth for the foreign-born population - Fiji (%)
Place of birth for the foreign-born population - Micronesia (%)
Place of birth for the foreign-born population - Bahamas (%)
Place of birth for the foreign-born population - Barbados (%)
Place of birth for the foreign-born population - Cuba (%)
Place of birth for the foreign-born population - Dominica (%)
Place of birth for the foreign-born population - Dominican Republic (%)
Place of birth for the foreign-born population - Grenada (%)
Place of birth for the foreign-born population - Haiti (%)
Place of birth for the foreign-born population - Jamaica (%)
Place of birth for the foreign-born population - St. Vincent and the Grenadines (%)
Place of birth for the foreign-born population - Trinidad and Tobago (%)
Place of birth for the foreign-born population - West Indies (%)
Place of birth for the foreign-born population - Other Caribbean (%)
Place of birth for the foreign-born population - Belize (%)
Place of birth for the foreign-born population - Costa Rica (%)
Place of birth for the foreign-born population - El Salvador (%)
Place of birth for the foreign-born population - Guatemala (%)
Place of birth for the foreign-born population - Honduras (%)
Place of birth for the foreign-born population - Mexico (%)
Place of birth for the foreign-born population - Nicaragua (%)
Place of birth for the foreign-born population - Panama (%)
Place of birth for the foreign-born population - Other Central America (%)
Place of birth for the foreign-born population - Argentina (%)
Place of birth for the foreign-born population - Bolivia (%)
Place of birth for the foreign-born population - Brazil (%)
Place of birth for the foreign-born population - Chile (%)
Place of birth for the foreign-born population - Colombia (%)
Place of birth for the foreign-born population - Ecuador (%)
Place of birth for the foreign-born population - Guyana (%)
Place of birth for the foreign-born population - Peru (%)
Place of birth for the foreign-born population - Uruguay (%)
Place of birth for the foreign-born population - Venezuela (%)
Place of birth for the foreign-born population - Other South America (%)
Place of birth for the foreign-born population - Canada (%)
Place of birth for the foreign-born population - Other Northern America (%)
Place of birth for the foreign-born population - Other (%)
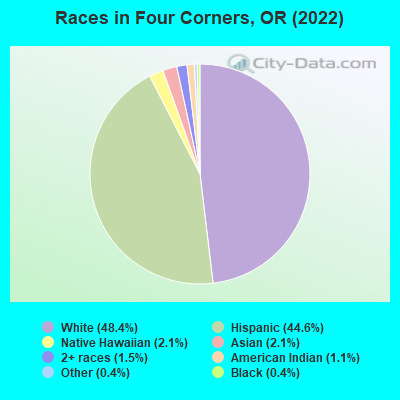
According to 2022 data, the most numerous races in Four Corners, OR are White alone (7,840 residents), Hispanic (7,225 residents), and Two or more races (250 residents). 60.5% of Four Corners residents speak English at home. 17.5% of Four Corners, OR residents are foreign-born (15.1% born in Latin America), which is 48.5% greater than the foreign-born rate of 9.0% across the entire state of Oregon.
Race distribution in Four Corners
2000 2022
2,857,616 83.5% White alone 275,314 8.0% Hispanic 100,333 2.9% Asian alone 82,733 2.4% Two or more races 53,325 1.6% Black alone 40,130 1.2% American Indian alone 7,398 0.2% Native Hawaiian and Other 4,550 0.1% Other race alone
3,037,571 71.6% White alone 609,538 14.4% Hispanic 252,744 6.0% Two or more races 191,283 4.5% Asian alone 78,228 1.8% Black alone 29,399 0.7% American Indian alone 25,731 0.6% Other race alone 15,643 0.4% Native Hawaiian and Other
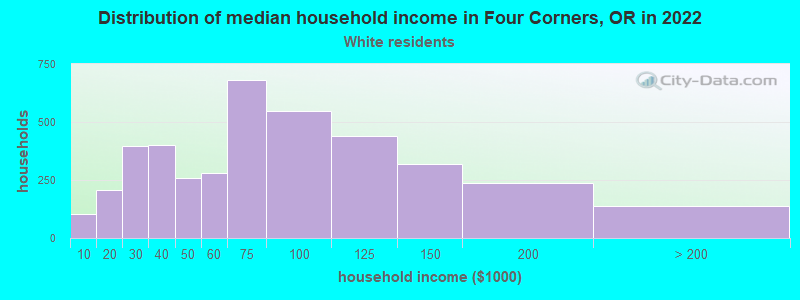
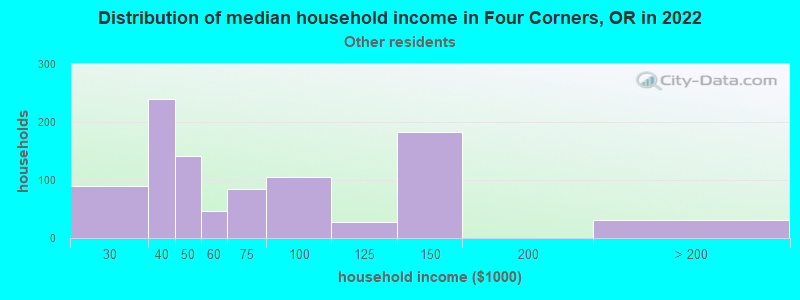
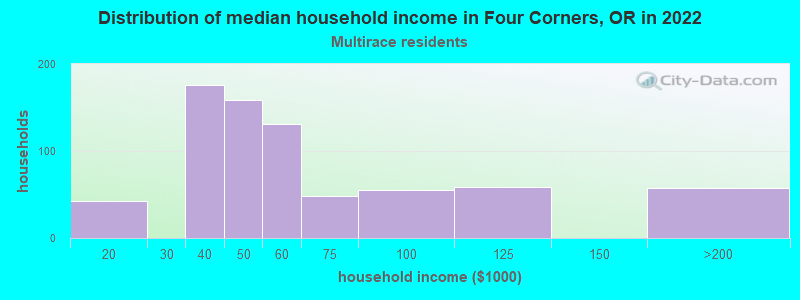
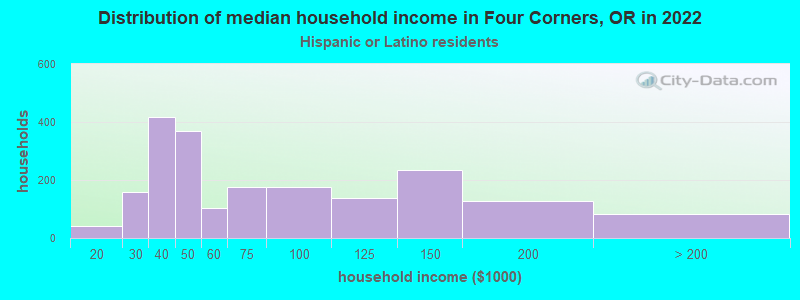
Income and house value in Four Corners Median household income in 2022 $64,168 White non-Hispanic householders$58,004 Some other race householders$45,968 Two or more races householders$63,474 Hispanic or Latino race householdersMedian 2022 house value $325,940 White Non-Hispanic householders$191,729 Black or African American householders$372,545 American Indian or Alaska Native householders $392,308 Asian householders$321,516 Some other race householders$385,229 Two or more races householders$324,465 Hispanic or Latino householders
Median age by race in Four Corners
42.9 Median age for White residents43.4 42.4 47.7 Median age for Black or African American residents53.4 16.7 40.9 Median age for American Indian / Alaska Native residents24.7 43.2 29.7 Median age for Asian residents30.8 57.9 94.5 Median age for Native Hawaiian / Pacific Islander residents-966,942,147.8 91.4 26.6 Median age for Other race residents24.6 31.8 29.6 Median age for Two or more races residents31.7 28.0 46.7 Median age for White alone residents43.8 48.9 28.9 Median age for Hispanic or Latino residents27.3 29.7
Owner/renter occupied households by race in Four Corners
House owners and renters - White residents 2,749 69.1% Owner occupied1,231 30.9% Renter occupiedHouse owners and renters - Black or African American residents 19 100.0% Renter occupiedHouse owners and renters - American Indian / Alaska Native residents 73 72.5% Owner occupied28 27.5% Renter occupiedHouse owners and renters - Asian residents 107 100.0% Owner occupiedHouse owners and renters - Native Hawaiian / Pacific Islander residents 27 100.0% Owner occupiedHouse owners and renters - Other race residents 411 45.8% Owner occupied486 54.2% Renter occupiedHouse owners and renters - Two or more races residents 435 57.2% Owner occupied326 42.8% Renter occupiedHouse owners and renters - White alone residents 2,337 66.1% Owner occupied1,197 33.9% Renter occupiedHouse owners and renters - Hispanic or Latino residents 1,170 60.4% Owner occupied768 39.6% Renter occupied
Language usage in Four Corners
English speakers - Total 60.5% of residents of Four Corners speak English at home.
35.6% of residents speak Spanish at home 3,158 57.2% Speak English very well2,367 42.8% Speak English less than very well3.4% of residents speak other language at home 376 71.3% Speak English very well151 28.7% Speak English less than very well
English speakers - Born in the United States 85.5% of residents of Four Corners speak English at home.
10.9% of residents speak Spanish at home 419 89.9% Speak English very well47 10.1% Speak English less than very well2.6% of residents speak other language at home 111 100.0% Speak English very well
English speakers - Native, born elsewhere 47.8% of residents of Four Corners speak English at home.
34.9% of residents speak Spanish at home 84 62.2% Speak English very well51 37.8% Speak English less than very well0.3% of residents speak other language at home 1 100.0% Speak English very well
English speakers - Foreign-born 6.5% of residents of Four Corners speak English at home.
82.9% of residents speak Spanish at home 879 33.1% Speak English very well1,778 66.9% Speak English less than very well8.3% of residents speak other language at home 100 37.7% Speak English very well165 62.3% Speak English less than very well
White (Caucasian) - Speak only English Native:
92.0% (7,496)Foreign-born:
18.3% (132)
White (Caucasian) - Speak another language Native:
6.0% (489)Foreign-born:
76.3% (552)
Asian - Speak only English Native:
87.5% (182)Foreign-born:
22.1% (28)
Asian - Speak another language Native:
56.4% (117)Foreign-born:
77.2% (99)
Other race - Speak another language Native:
80.8% (1,228)Foreign-born:
100.0% (1,259)
Two or more races - Speak only English Native:
35.7% (710)Foreign-born:
6.6% (48)
Two or more races - Speak another language Native:
66.8% (1,329)Foreign-born:
93.2% (685)
White alone - Speak only English Native:
98.3% (7,172)Foreign-born:
39.0% (102)
White alone - Speak another language Native:
1.8% (129)Foreign-born:
61.2% (161)
Hispanic or Latino - Speak only English Native:
27.9% (1,103)Foreign-born:
2.8% (79)
Hispanic or Latino - Speak another language Native:
71.5% (2,829)Foreign-born:
97.5% (2,765)
Foreign-born residents in Four Corners 2,830 residents are foreign born (15.1% Latin America ).
This city:
17.5%Oregon:
9.8%
Marital status for residents in Four Corners Marital status - White (Caucasian) population 15 years and over
Males 39.0% Never married42.8% Now married0.4% Separated3.8% Widowed14.0% DivorcedFemales 29.1% Never married37.7% Now married4.1% Separated8.4% Widowed20.8% DivorcedWomen who gave birth in the past 12 months Now married:
67.8% (69)Unmarried:
32.2% (33)
Women who did not give birth in the past 12 months Now married:
34.7% (653)Unmarried:
65.3% (1,228)
Marital status - Black or African American population 15 years and over
Males 6.1% Never married0.0% Now married28.6% Separated0.0% Widowed65.3% DivorcedFemales 0.0% Never married100.0% Now married0.0% Separated0.0% Widowed0.0% DivorcedWomen who did not give birth in the past 12 months Now married:
100.0% (12)Unmarried:
0.0% (0)
Marital status - American Indian / Alaska Native population 15 years and over
Males 64.9% Never married35.1% Now married0.0% Separated0.0% Widowed0.0% DivorcedFemales 0.0% Never married28.9% Now married0.0% Separated0.0% Widowed71.1% DivorcedWomen who did not give birth in the past 12 months Now married:
22.9% (17)Unmarried:
77.1% (59)
Marital status - Asian population 15 years and over
Males 77.6% Never married9.8% Now married0.0% Separated0.0% Widowed12.6% DivorcedFemales 29.4% Never married25.4% Now married5.6% Separated18.1% Widowed21.5% DivorcedWomen who did not give birth in the past 12 months Now married:
35.8% (32)Unmarried:
64.2% (58)
Marital status - Native Hawaiian / Pacific Islander population 15 years and over
Males 67.8% Never married32.2% Now married0.0% Separated0.0% Widowed0.0% DivorcedFemales 15.0% Never married1.7% Now married0.0% Separated0.0% Widowed83.3% DivorcedWomen who did not give birth in the past 12 months Now married:
0.0% (0)Unmarried:
100.0% (37)
Marital status - Other race population 15 years and over
Males 46.3% Never married52.2% Now married0.0% Separated0.0% Widowed1.5% DivorcedFemales 38.1% Never married49.8% Now married0.0% Separated5.6% Widowed6.4% DivorcedWomen who gave birth in the past 12 months Now married:
22.5% (25)Unmarried:
77.5% (86)
Women who did not give birth in the past 12 months Now married:
52.4% (523)Unmarried:
47.6% (475)
Marital status - Two or more races population 15 years and over
Males 36.6% Never married35.5% Now married0.0% Separated12.1% Widowed15.8% DivorcedFemales 38.1% Never married46.5% Now married0.0% Separated12.8% Widowed2.6% DivorcedWomen who gave birth in the past 12 months Now married:
100.0% (72)Unmarried:
0.0% (0)
Women who did not give birth in the past 12 months Now married:
24.1% (131)Unmarried:
75.9% (411)
Marital status - White alone, not Hispanic / Latino population 15 years and over
Males 41.6% Never married38.0% Now married0.5% Separated4.1% Widowed15.8% DivorcedFemales 24.7% Never married36.9% Now married4.7% Separated9.9% Widowed23.8% DivorcedWomen who gave birth in the past 12 months Now married:
75.8% (45)Unmarried:
24.2% (14)
Women who did not give birth in the past 12 months Now married:
32.4% (459)Unmarried:
67.6% (957)
Marital status - Hispanic or Latino population 15 years and over
Males 35.5% Never married53.5% Now married0.0% Separated4.6% Widowed6.5% DivorcedFemales 40.1% Never married44.4% Now married0.7% Separated5.2% Widowed9.5% DivorcedWomen who gave birth in the past 12 months Now married:
56.0% (111)Unmarried:
44.0% (87)
Women who did not give birth in the past 12 months Now married:
40.7% (801)Unmarried:
59.3% (1,165)
Ancestries in Four Corners
431 5.7% German427 5.6% American371 4.9% Irish330 4.3% English131 1.7% Norwegian112 1.5% French105 1.4% Italian95 1.3% European84 1.1% Russian42 0.6% Scottish40 0.5% Dutch35 0.5% Romanian28 0.4% French Canadian21 0.3% Polish19 0.3% Cajun15 0.2% German Russian13 0.2% Welsh12 0.2% Maltese12 0.2% Swiss11 0.1% African10 0.1% Scotch-Irish9 0.1% Lithuanian2 0.03% Northern European
Children Nativity (place of birth) in Four Corners
Children under 6 years - Living with two parents Both parents native 189 100.0% NativeBoth parents foreign-born 95 100.0% NativeOne native, one foreign-born parent 144 100.0% NativeChildren under 6 years - Living with one parent Native parent 276 100.0% NativeForeign-born parent 74 100.0% NativeChildren 6 to 17 years - Living with two parents Both parents native 398 100.0% NativeBoth parents foreign-born 715 100.0% NativeOne native, one foreign-born parent 285 100.0% NativeChildren 6 to 17 years - Living with one parent Native parent 629 100.0% NativeForeign-born parent 278 50.0% Native278 50.0% Foreign-born
Grandparents responsible for own grandchildren in Four Corners
Grandparents (30 to 59 years) White / Caucasian 127 68.1% Responsible for grandchildren60 31.9% Not responsible for grandchildrenOther race 11 15.8% Responsible for grandchildren59 84.2% Not responsible for grandchildrenTwo or more races 29 100.0% Responsible for grandchildrenWhite alone, not Hispanic / Latino 158 81.8% Responsible for grandchildren35 18.2% Not responsible for grandchildrenHispanic or Latino 7 7.9% Responsible for grandchildren87 92.1% Not responsible for grandchildrenGrandparents (60 years and over) White / Caucasian 10 16.3% Responsible for grandchildren50 83.7% Not responsible for grandchildrenTwo or more races 191 100.0% Not responsible for grandchildrenWhite alone, not Hispanic / Latino 10 15.7% Responsible for grandchildren55 84.3% Not responsible for grandchildrenHispanic or Latino 14 10.2% Responsible for grandchildren127 89.8% Not responsible for grandchildren