Races in Florence, Oregon (OR) Detailed Stats
Ancestries, Foreign-born residents, place of birth
Settings
X


Recent posts about races in Florence, Oregon on our local forum with over 2,400,000 registered users:
 | Florence OR. real estate trap. Bay Area Oregon! (58 replies) |
| What do you like and dislike about living in Florence OR? (62 replies) |
| Place for a Tiny House (11 replies) |
| Is the Coos Bay/Florence area the "Last Hidden Gem" of Oregon?? (106 replies) |
| Oregon’s population declines for first time in 30 years, state economist warns of revenue loss (188 replies) |
| They never learn (41 replies) |
Latest news about races in Florence, OR collected exclusively by city-data.com from local newspapers, TV, and radio stations
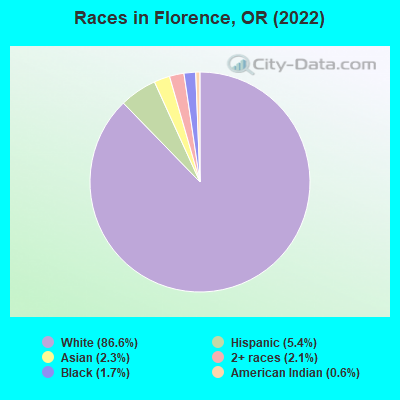
According to 2022 data, the most numerous races in Florence, OR are White alone (8,125 residents), Hispanic (503 residents), and Two or more races (194 residents). 92.3% of Florence residents speak English at home. 9.0% of Florence, OR residents are foreign-born (3.4% born in Latin America, 2.1% born in Asia, 1.6% born in Europe, 1.2% born in Africa), which is about the same as the foreign-born rate of 9.0% across the entire state of Oregon.
Race distribution in Florence
2000
2022

- 6,84394.2%White alone
- 1722.4%Hispanic
- 1141.6%Two or more races
- 660.9%American Indian alone
- 380.5%Asian alone
- 190.3%Black alone
- 90.1%Native Hawaiian and Other
Pacific Islander alone - 20.03%Other race alone

-
- 8,12586.6%White alone
- 5035.4%Hispanic
- 2152.3%Asian alone
- 1942.1%Two or more races
- 1611.7%Black alone
- 520.6%American Indian alone
- 40.04%Other race alone
2000
2022
-
- 2,857,61683.5%White alone
- 275,3148.0%Hispanic
- 100,3332.9%Asian alone
- 82,7332.4%Two or more races
- 53,3251.6%Black alone
- 40,1301.2%American Indian alone
- 7,3980.2%Native Hawaiian and Other
Pacific Islander alone - 4,5500.1%Other race alone

-
- 3,037,57171.6%White alone
- 609,53814.4%Hispanic
- 252,7446.0%Two or more races
- 191,2834.5%Asian alone
- 78,2281.8%Black alone
- 29,3990.7%American Indian alone
- 25,7310.6%Other race alone
- 15,6430.4%Native Hawaiian and Other
Pacific Islander alone

Income and house value in Florence
- Median household income in 2022
- $57,754White non-Hispanic householders
- $44,161Two or more races householders
- $42,204Hispanic or Latino race householders
- Median 2022 house value
- $431,806White Non-Hispanic householders
- $291,275American Indian or Alaska Native householders
- $334,596Some other race householders
- $139,474Two or more races householders
- $437,089Hispanic or Latino householders
Household income for White non-Hispanic householders

Household income for Some other race householders

Household income for Two or more races householders

Household income for Hispanic or Latino race householders

Median age by race in Florence
- 61.4Median age for White residents
- 56.2Males
- 63.2Females
- 13.3Median age for Black or African American residents
- 20.8Males
- 10.9Females
- 42.5Median age for American Indian / Alaska Native residents
- -592,808,551.4Males
- -828,888,888.1Females
- 39.8Median age for Asian residents
- 38.1Males
- 32.4Females
- -530,901,721.9Median age for Native Hawaiian / Pacific Islander residents
- -463,011,313.7Males
- -488,188,975.9Females
- 47.8Median age for Other race residents
- 42.9Males
- 46.2Females
- 59.1Median age for Two or more races residents
- 63.4Males
- 58.7Females
- 61.8Median age for White alone residents
- 56.8Males
- 63.3Females
- 36.9Median age for Hispanic or Latino residents
- 45.0Males
- 31.3Females
Owner/renter occupied households by race in Florence
- House owners and renters - White residents
- 2,84666.0%Owner occupied
- 1,46434.0%Renter occupied
- House owners and renters - Black or African American residents
- 19100.0%Renter occupied
- House owners and renters - American Indian / Alaska Native residents
- 45100.0%Owner occupied
- House owners and renters - Asian residents
- 18100.0%Owner occupied
- House owners and renters - Other race residents
- 2392.5%Owner occupied
- 27.5%Renter occupied
- House owners and renters - Two or more races residents
- 13478.5%Owner occupied
- 3721.5%Renter occupied
- House owners and renters - White alone residents
- 2,85766.9%Owner occupied
- 1,41133.1%Renter occupied
- House owners and renters - Hispanic or Latino residents
- 5841.8%Owner occupied
- 8158.2%Renter occupied
Language usage in Florence
- English speakers - Total
- 92.3% of residents of Florence speak English at home.
- 2.5% of residents speak Spanish at home
- 8838.4%Speak English very well
- 14161.6%Speak English less than very well
- 5.0% of residents speak other language at home
- 40086.2%Speak English very well
- 6413.8%Speak English less than very well
- English speakers - Born in the United States
- 98.1% of residents of Florence speak English at home.
- 0.5% of residents speak Spanish at home
- 28100.0%Speak English less than very well
- 1.7% of residents speak other language at home
- 93100.0%Speak English very well
- English speakers - Native, born elsewhere
- 98.6% of residents of Florence speak English at home.
- English speakers - Foreign-born
- 33.6% of residents of Florence speak English at home.
- 22.1% of residents speak Spanish at home
- 7740.5%Speak English very well
- 11359.5%Speak English less than very well
- 43.5% of residents speak other language at home
- 30581.6%Speak English very well
- 6918.4%Speak English less than very well
White (Caucasian) - Speak only English
| Native: | 99.1% (7,637) |
| Foreign-born: | 69.5% (291) |
White (Caucasian) - Speak another language
| Native: | 0.8% (65) |
| Foreign-born: | 32.0% (134) |
Asian - Speak only English
| Native: | 32.5% (9) |
| Foreign-born: | 5.3% (10) |
Asian - Speak another language
| Native: | 69.6% (19) |
| Foreign-born: | 92.9% (179) |
Other race - Speak another language
| Native: | 71.1% (11) |
| Foreign-born: | 100.0% (117) |
Two or more races - Speak another language
| Native: | 4.3% (15) |
| Foreign-born: | 93.5% (15) |
White alone - Speak only English
| Native: | 99.3% (7,596) |
| Foreign-born: | 79.8% (299) |
White alone - Speak another language
| Native: | 0.7% (52) |
| Foreign-born: | 20.2% (76) |
Hispanic or Latino - Speak another language
| Native: | 11.8% (29) |
| Foreign-born: | 100.0% (199) |
Foreign-born residents in Florence
845 residents are foreign born (3.4% Latin America, 2.1% Asia, 1.6% Europe, 1.2% Africa).
| This city: | 9.0% |
| Oregon: | 9.8% |


Marital status for residents in Florence
Marital status - White (Caucasian) population 15 years and over
- Males
- 27.9%Never married
- 56.8%Now married
- 0.9%Separated
- 3.9%Widowed
- 10.5%Divorced
- Females
- 18.6%Never married
- 41.3%Now married
- 2.2%Separated
- 15.1%Widowed
- 22.8%Divorced
Women who gave birth in the past 12 months
| Now married: | 71.7% (37) |
| Unmarried: | 28.3% (15) |
Women who did not give birth in the past 12 months
| Now married: | 28.8% (335) |
| Unmarried: | 71.2% (828) |
Marital status - Black or African American population 15 years and over
- Males
- 100.0%Never married
- 0.0%Now married
- 0.0%Separated
- 0.0%Widowed
- 0.0%Divorced
- Females
- 30.6%Never married
- 69.4%Now married
- 0.0%Separated
- 0.0%Widowed
- 0.0%Divorced
Women who did not give birth in the past 12 months
| Now married: | 69.4% (27) |
| Unmarried: | 30.6% (12) |
Marital status - Asian population 15 years and over
- Males
- 18.6%Never married
- 81.4%Now married
- 0.0%Separated
- 0.0%Widowed
- 0.0%Divorced
- Females
- 33.6%Never married
- 66.4%Now married
- 0.0%Separated
- 0.0%Widowed
- 0.0%Divorced
Women who did not give birth in the past 12 months
| Now married: | 62.6% (80) |
| Unmarried: | 37.4% (48) |
Marital status - Other race population 15 years and over
- Males
- 20.4%Never married
- 61.1%Now married
- 0.0%Separated
- 0.0%Widowed
- 18.5%Divorced
- Females
- 0.0%Never married
- 22.6%Now married
- 0.0%Separated
- 45.2%Widowed
- 32.3%Divorced
Women who did not give birth in the past 12 months
| Now married: | 41.2% (11) |
| Unmarried: | 58.8% (16) |
Marital status - Two or more races population 15 years and over
- Males
- 18.8%Never married
- 36.5%Now married
- 1.2%Separated
- 17.6%Widowed
- 25.9%Divorced
- Females
- 8.8%Never married
- 20.0%Now married
- 27.1%Separated
- 25.3%Widowed
- 18.8%Divorced
Women who did not give birth in the past 12 months
| Now married: | 100.0% (80) |
| Unmarried: | 0.0% (0) |
Marital status - White alone, not Hispanic / Latino population 15 years and over
- Males
- 28.1%Never married
- 56.4%Now married
- 0.9%Separated
- 3.9%Widowed
- 10.6%Divorced
- Females
- 18.4%Never married
- 41.2%Now married
- 2.2%Separated
- 14.9%Widowed
- 23.2%Divorced
Women who gave birth in the past 12 months
| Now married: | 71.7% (37) |
| Unmarried: | 28.3% (15) |
Women who did not give birth in the past 12 months
| Now married: | 27.1% (302) |
| Unmarried: | 72.9% (813) |
Marital status - Hispanic or Latino population 15 years and over
- Males
- 13.3%Never married
- 66.5%Now married
- 0.0%Separated
- 8.7%Widowed
- 11.6%Divorced
- Females
- 15.5%Never married
- 31.5%Now married
- 21.0%Separated
- 22.8%Widowed
- 9.1%Divorced
Women who did not give birth in the past 12 months
| Now married: | 74.5% (126) |
| Unmarried: | 25.5% (43) |
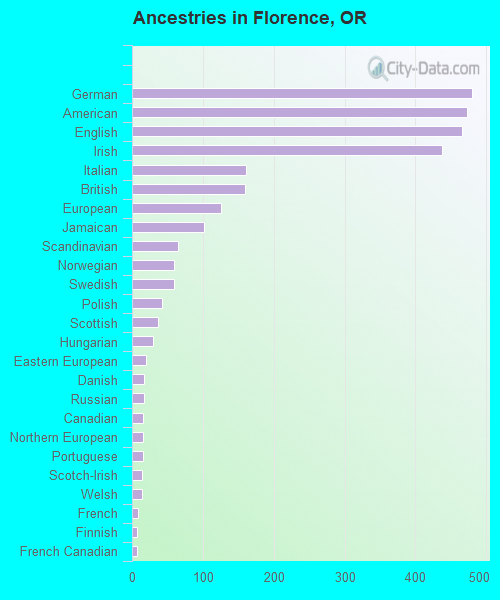
Ancestries in Florence

- 48013.4%German
- 47313.2%American
- 46613.0%English
- 43812.2%Irish
- 1614.5%Italian
- 1604.5%British
- 1263.5%European
- 1012.8%Jamaican
- 651.8%Scandinavian
- 591.6%Norwegian
- 591.6%Swedish
- 421.2%Polish
- 371.0%Scottish
- 290.8%Hungarian
- 200.6%Eastern European
- 170.5%Danish
- 170.5%Russian
- 150.4%Canadian
- 150.4%Northern European
- 150.4%Portuguese
- 140.4%Scotch-Irish
- 140.4%Welsh
- 90.3%French
- 70.2%Finnish
- 70.2%French Canadian
- 30.08%Nigerian
Geographical mobility in Florence

- Same house 1 year ago
- 6,46778.7%White (Caucasian)
- 176100.0%Black or African American
- 61100.0%American Indian / Alaska Native
- 16276.3%Asian
- 14365.7%Other race
- 34387.0%Two or more races
- 6,38178.8%White alone, not Hispanic / Latino
- 38576.1%Hispanic or Latino

-
- Moved within same county
- 6728.2%White / Caucasian
- 4119.1%Asian
- 20.9%Other race
- 102.5%Two or more races
- 6678.2%White alone, not Hispanic / Latino
- 61.2%Hispanic or Latino

-
- Moved within same state
- 1672.0%White / Caucasian
- 205.0%Two or more races
- 1662.1%White alone, not Hispanic / Latino

-
- Moved from different state
- 94911.5%White / Caucasian
- 7936.1%Other race
- 369.1%Two or more races
- 91511.3%White alone, not Hispanic / Latino
- 9218.2%Hispanic or Latino

-
- Moved from abroad
- 300.4%White
- 310.4%White alone, not Hispanic / Latino

Children Nativity (place of birth) in Florence
Place of birth for residents in Florence
![Place of birth for the foreign-born population - Regions]()
- 374Americas
- 324Latin America
- 223Central America
- 201Asia
- 151Europe
- 117Africa
- 116South Eastern Asia
- 100Caribbean
- 65Eastern Asia
- 64Western Europe
- 62Southern Africa
- 55Eastern Africa
- 50Northern Europe
- 49Northern America
- 44China
- 36Eastern Europe
- 20South Central Asia

![Place of birth for the foreign-born population - Countries]()
- 223Mexico
- 100Jamaica
- 64Germany
- 62Philippines
- 62South Africa
- 49Canada
- 44China
- 40Thailand
- 23Russia
- 20Japan
- 20Pakistan
- 15Ireland
- 14United Kingdom
- 13England
- 13Hungary
- 13Indonesia
- 8Sweden

Grandparents responsible for own grandchildren in Florence
Zip codes: 97439.