Races in Fisherville, Tennessee (TN) Detailed Stats
Ancestries, Foreign-born residents, place of birth
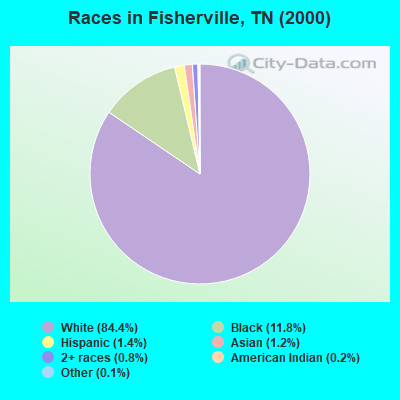
Race distribution in Fisherville

- 5,69484.4%White alone
- 79911.8%Black alone
- 951.4%Hispanic
- 841.2%Asian alone
- 510.8%Two or more races
- 130.2%American Indian alone
- 80.1%Other race alone
2000
2022
-
- 4,505,93079.2%White alone
- 928,20416.3%Black alone
- 123,8382.2%Hispanic
- 54,8241.0%Two or more races
- 56,0771.0%Asian alone
- 13,8200.2%American Indian alone
- 4,7800.08%Other race alone
- 1,8100.03%Native Hawaiian and Other
Pacific Islander alone

-
- 5,070,02671.9%White alone
- 1,089,73815.5%Black alone
- 442,6296.3%Hispanic
- 279,3814.0%Two or more races
- 131,8171.9%Asian alone
- 26,9720.4%Other race alone
- 6,3870.09%American Indian alone
- 4,3890.06%Native Hawaiian and Other
Pacific Islander alone

Income and house value in Fisherville
- Median household income in 2022
- $137,825White non-Hispanic householders
- $94,355Black householders
- $58,493American Indian and Alaska Native householders
- $116,895Asian householders
- $103,025Some other race householders
- $183,172Two or more races householders
- over $200,000Hispanic or Latino race householders
- Median 2022 house value
- $597,959White Non-Hispanic householders
- $496,273Black or African American householders
- $518,102American Indian or Alaska Native householders
- $449,022Asian householders
- $234,873Some other race householders
- $644,658Two or more races householders
- $224,096Hispanic or Latino householders
Household income for White non-Hispanic householders

Household income for Black householders

Household income for American Indian and Alaska Native householders

Household income for Asian householders

Household income for Two or more races householders

Household income for Hispanic or Latino race householders

Zip code: 38018