Races in Eggertsville, New York (NY) Detailed Stats
Data:
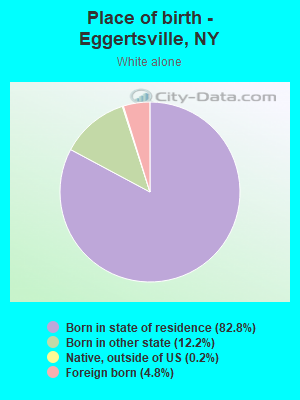
Races - White alone (%)
Races - White alone (% change since 2000)
Races - Black alone (%)
Races - Black alone (% change since 2000)
Races - American Indian alone (%)
Races - American Indian alone (% change since 2000)
Races - Asian alone (%)
Races - Asian alone (% change since 2000)
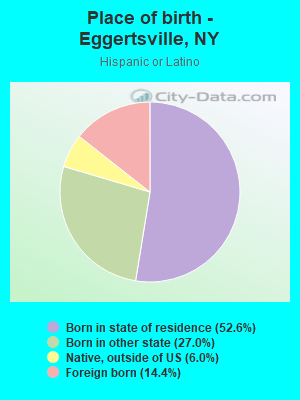
Races - Hispanic (%)
Races - Hispanic (% change since 2000)
Races - Native Hawaiian and Other Pacific Islander alone (%)
Races - Native Hawaiian and Other Pacific Islander alone (% change since 2000)
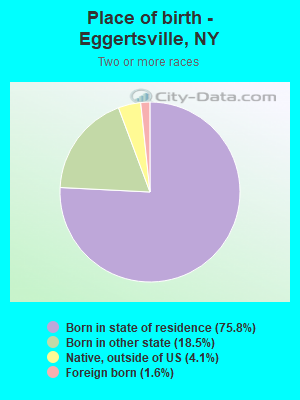
Races - Two or more races(%)
Races - Two or more races(% change since 2000)
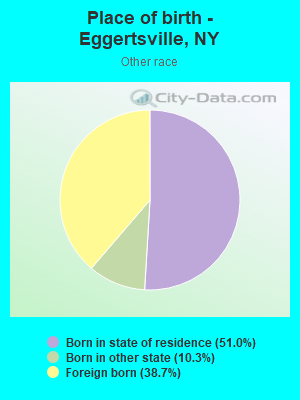
Races - Other race alone (%)
Races - Other race alone (% change since 2000)
Racial diversity
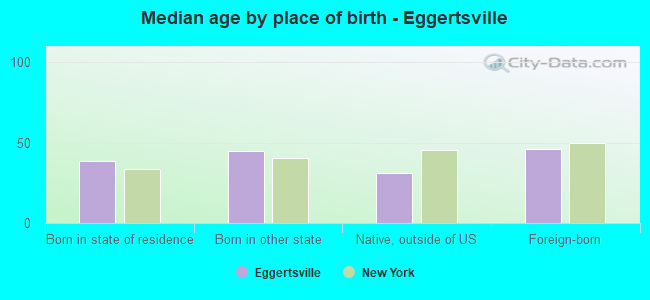
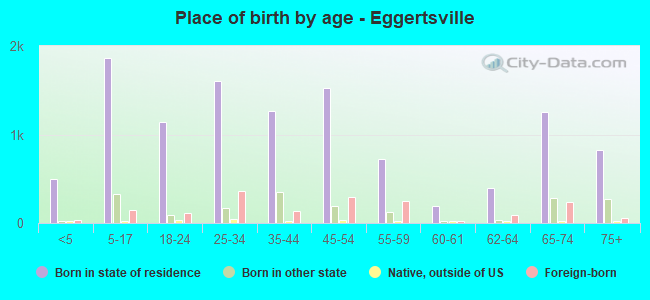
Place of birth - Born in state of residence (%)
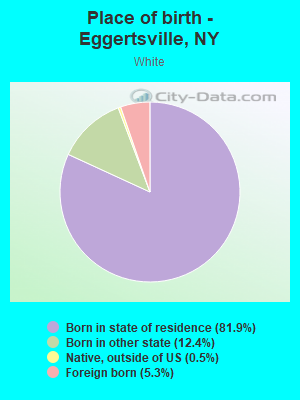
Place of birth - Born in state of residence (%) - White
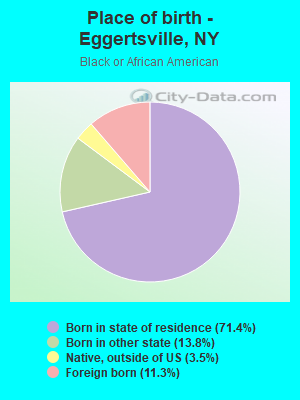
Place of birth - Born in state of residence (%) - Black or African American
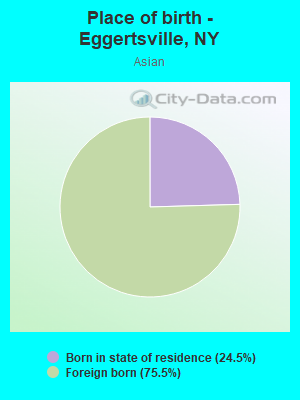
Place of birth - Born in state of residence (%) - Asian
Place of birth - Born in state of residence (%) - Hispanic or Latino
Place of birth - Born in state of residence (%) - American Indian and Alaska Native
Place of birth - Born in state of residence (%) - Multirace
Place of birth - Born in state of residence (%) - Other Race
Place of birth - Born in other state (%)
Place of birth - Born in other state (%) - White
Place of birth - Born in other state (%) - Black or African American
Place of birth - Born in other state (%) - Asian
Place of birth - Born in other state (%) - Hispanic or Latino
Place of birth - Born in other state (%) - American Indian and Alaska Native
Place of birth - Born in other state (%) - Multirace
Place of birth - Born in other state (%) - Other Race
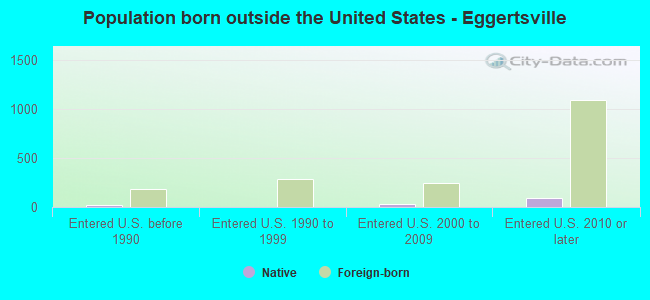
Place of birth - Native, outside of US (%)
Place of birth - Native, outside of US (%) - White
Place of birth - Native, outside of US (%) - Black or African American
Place of birth - Native, outside of US (%) - Asian
Place of birth - Native, outside of US (%) - Hispanic or Latino
Place of birth - Native, outside of US (%) - American Indian and Alaska Native
Place of birth - Native, outside of US (%) - Multirace
Place of birth - Native, outside of US (%) - Other Race
Place of birth - Foreign born (%)
Place of birth - Foreign born (%) - White
Place of birth - Foreign born (%) - Black or African American
Place of birth - Foreign born (%) - Asian
Place of birth - Foreign born (%) - Hispanic or Latino
Place of birth - Foreign born (%) - American Indian and Alaska Native
Place of birth - Foreign born (%) - Multirace
Place of birth - Foreign born (%) - Other Race
Residents speaking English at home (%)
Residents speaking English at home - Born in the United States (%)
Residents speaking English at home - Native, born elsewhere (%)
Residents speaking English at home - Foreign born (%)
Residents speaking Spanish at home (%)
Residents speaking Spanish at home - Born in the United States (%)
Residents speaking Spanish at home - Native, born elsewhere (%)
Residents speaking Spanish at home - Foreign born (%)
Residents speaking other language at home (%)
Residents speaking other language at home - Born in the United States (%)
Residents speaking other language at home - Native, born elsewhere (%)
Residents speaking other language at home - Foreign born (%)
Marital status - Never married (%)
Marital status - Now married (%)
Marital status - Separated (%)
Marital status - Widowed (%)
Marital status - Divorced (%)
Ancestries Reported - Arab (%)
Ancestries Reported - Czech (%)
Ancestries Reported - Danish (%)
Ancestries Reported - Dutch (%)
Ancestries Reported - English (%)
Ancestries Reported - French (%)
Ancestries Reported - French Canadian (%)
Ancestries Reported - German (%)
Ancestries Reported - Greek (%)
Ancestries Reported - Hungarian (%)
Ancestries Reported - Irish (%)
Ancestries Reported - Italian (%)
Ancestries Reported - Lithuanian (%)
Ancestries Reported - Norwegian (%)
Ancestries Reported - Polish (%)
Ancestries Reported - Portuguese (%)
Ancestries Reported - Russian (%)
Ancestries Reported - Scotch-Irish (%)
Ancestries Reported - Scottish (%)
Ancestries Reported - Slovak (%)
Ancestries Reported - Subsaharan African (%)
Ancestries Reported - Swedish (%)
Ancestries Reported - Swiss (%)
Ancestries Reported - Ukrainian (%)
Ancestries Reported - United States (%)
Ancestries Reported - Welsh (%)
Ancestries Reported - West Indian (%)
Ancestries Reported - Other (%)
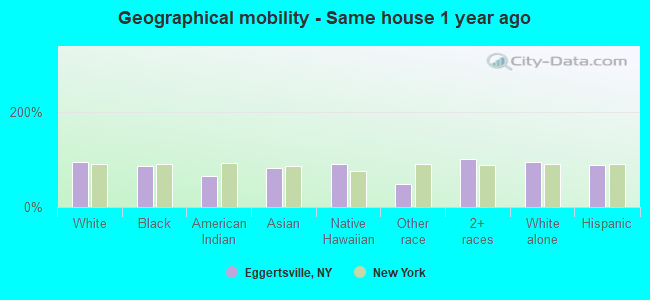
Geographical mobility - Same house 1 year ago (%)
Geographical mobility - Same house 1 year ago (%) - White
Geographical mobility - Same house 1 year ago (%) - Black or African American
Geographical mobility - Same house 1 year ago (%) - Asian
Geographical mobility - Same house 1 year ago (%) - Hispanic or Latino
Geographical mobility - Same house 1 year ago (%) - American Indian and Alaska Native
Geographical mobility - Same house 1 year ago (%) - Multirace
Geographical mobility - Same house 1 year ago (%) - Other Race
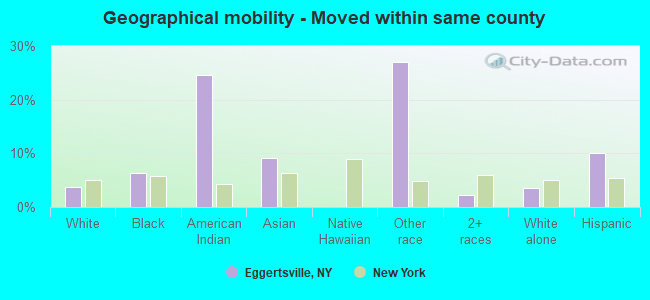
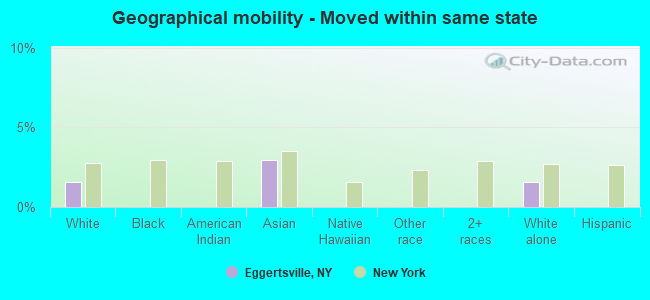
Geographical mobility - Moved within same county (%)
Geographical mobility - Moved within same county (%) - White
Geographical mobility - Moved within same county (%) - Black or African American
Geographical mobility - Moved within same county (%) - Asian
Geographical mobility - Moved within same county (%) - Hispanic or Latino
Geographical mobility - Moved within same county (%) - American Indian and Alaska Native
Geographical mobility - Moved within same county (%) - Multirace
Geographical mobility - Moved within same county (%) - Other Race
Geographical mobility - Moved from different county within same state (%)
Geographical mobility - Moved from different county within same state (%) - White
Geographical mobility - Moved from different county within same state (%) - Black or African American
Geographical mobility - Moved from different county within same state (%) - Asian
Geographical mobility - Moved from different county within same state (%) - Hispanic or Latino
Geographical mobility - Moved from different county within same state (%) - American Indian and Alaska Native
Geographical mobility - Moved from different county within same state (%) - Multirace
Geographical mobility - Moved from different county within same state (%) - Other Race
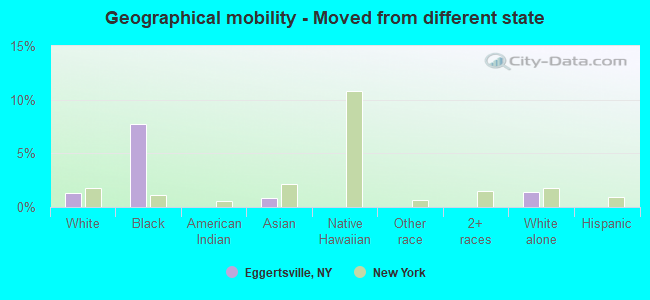
Geographical mobility - Moved from different state (%)
Geographical mobility - Moved from different state (%) - White
Geographical mobility - Moved from different state (%) - Black or African American
Geographical mobility - Moved from different state (%) - Asian
Geographical mobility - Moved from different state (%) - Hispanic or Latino
Geographical mobility - Moved from different state (%) - American Indian and Alaska Native
Geographical mobility - Moved from different state (%) - Multirace
Geographical mobility - Moved from different state (%) - Other Race
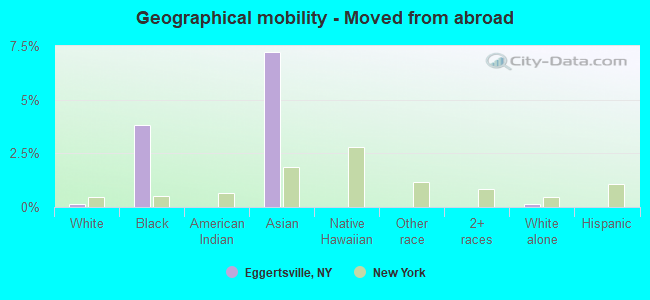
Geographical mobility - Moved from abroad (%)
Geographical mobility - Moved from abroad (%) - White
Geographical mobility - Moved from abroad (%) - Black or African American
Geographical mobility - Moved from abroad (%) - Asian
Geographical mobility - Moved from abroad (%) - Hispanic or Latino
Geographical mobility - Moved from abroad (%) - American Indian and Alaska Native
Geographical mobility - Moved from abroad (%) - Multirace
Geographical mobility - Moved from abroad (%) - Other Race
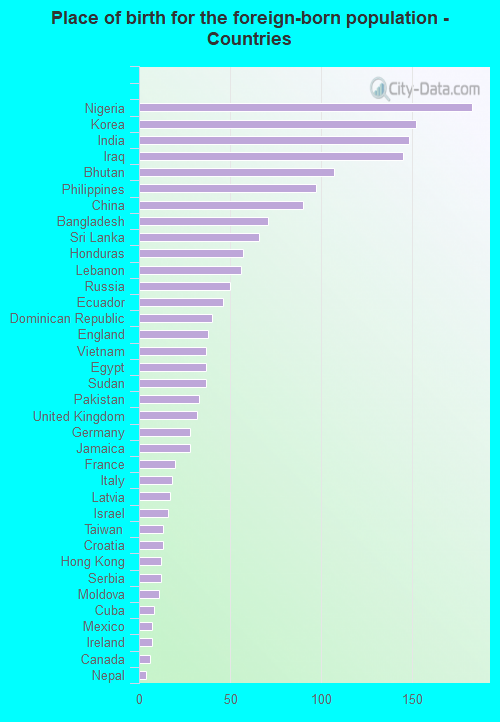
Place of birth for the foreign-born population - Ireland (%)
Place of birth for the foreign-born population - Denmark (%)
Place of birth for the foreign-born population - Norway (%)
Place of birth for the foreign-born population - Sweden (%)
Place of birth for the foreign-born population - United Kingdom (%)
Place of birth for the foreign-born population - England (%)
Place of birth for the foreign-born population - Scotland (%)
Place of birth for the foreign-born population - Other Northern Europe (%)
Place of birth for the foreign-born population - Austria (%)
Place of birth for the foreign-born population - Belgium (%)
Place of birth for the foreign-born population - France (%)
Place of birth for the foreign-born population - Germany (%)
Place of birth for the foreign-born population - Netherlands (%)
Place of birth for the foreign-born population - Switzerland (%)
Place of birth for the foreign-born population - Other Western Europe (%)
Place of birth for the foreign-born population - Greece (%)
Place of birth for the foreign-born population - Italy (%)
Place of birth for the foreign-born population - Portugal (%)
Place of birth for the foreign-born population - Spain (%)
Place of birth for the foreign-born population - Other Southern Europe (%)
Place of birth for the foreign-born population - Albania (%)
Place of birth for the foreign-born population - Belarus (%)
Place of birth for the foreign-born population - Bosnia and Herzegovina (%)
Place of birth for the foreign-born population - Bulgaria (%)
Place of birth for the foreign-born population - Croatia (%)
Place of birth for the foreign-born population - Czechoslovakia (%)
Place of birth for the foreign-born population - Hungary (%)
Place of birth for the foreign-born population - Latvia (%)
Place of birth for the foreign-born population - Lithuania (%)
Place of birth for the foreign-born population - North Macedonia (Macedonia) (%)
Place of birth for the foreign-born population - Moldova (%)
Place of birth for the foreign-born population - Poland (%)
Place of birth for the foreign-born population - Romania (%)
Place of birth for the foreign-born population - Russia (%)
Place of birth for the foreign-born population - Serbia (%)
Place of birth for the foreign-born population - Ukraine (%)
Place of birth for the foreign-born population - Other Eastern Europe (%)
Place of birth for the foreign-born population - China (%)
Place of birth for the foreign-born population - Hong Kong (%)
Place of birth for the foreign-born population - Taiwan (%)
Place of birth for the foreign-born population - Japan (%)
Place of birth for the foreign-born population - Korea (%)
Place of birth for the foreign-born population - Other Eastern Asia (%)
Place of birth for the foreign-born population - Afghanistan (%)
Place of birth for the foreign-born population - Bangladesh (%)
Place of birth for the foreign-born population - India (%)
Place of birth for the foreign-born population - Iran (%)
Place of birth for the foreign-born population - Kazakhstan (%)
Place of birth for the foreign-born population - Nepal (%)
Place of birth for the foreign-born population - Pakistan (%)
Place of birth for the foreign-born population - Sri Lanka (%)
Place of birth for the foreign-born population - Uzbekistan (%)
Place of birth for the foreign-born population - Other South Central Asia (%)
Place of birth for the foreign-born population - Burma (%)
Place of birth for the foreign-born population - Cambodia (%)
Place of birth for the foreign-born population - Indonesia (%)
Place of birth for the foreign-born population - Laos (%)
Place of birth for the foreign-born population - Malaysia (%)
Place of birth for the foreign-born population - Philippines (%)
Place of birth for the foreign-born population - Singapore (%)
Place of birth for the foreign-born population - Thailand (%)
Place of birth for the foreign-born population - Vietnam (%)
Place of birth for the foreign-born population - Other South Eastern Asia (%)
Place of birth for the foreign-born population - Armenia (%)
Place of birth for the foreign-born population - Iraq (%)
Place of birth for the foreign-born population - Israel (%)
Place of birth for the foreign-born population - Jordan (%)
Place of birth for the foreign-born population - Kuwait (%)
Place of birth for the foreign-born population - Lebanon (%)
Place of birth for the foreign-born population - Saudi Arabia (%)
Place of birth for the foreign-born population - Syria (%)
Place of birth for the foreign-born population - Turkey (%)
Place of birth for the foreign-born population - Yemen (%)
Place of birth for the foreign-born population - Other Western Asia (%)
Place of birth for the foreign-born population - Eritrea (%)
Place of birth for the foreign-born population - Ethiopia (%)
Place of birth for the foreign-born population - Kenya (%)
Place of birth for the foreign-born population - Somalia (%)
Place of birth for the foreign-born population - Uganda (%)
Place of birth for the foreign-born population - Zimbabwe (%)
Place of birth for the foreign-born population - Other Eastern Africa (%)
Place of birth for the foreign-born population - Cameroon (%)
Place of birth for the foreign-born population - Congo (%)
Place of birth for the foreign-born population - Democratic Republic of Congo (Zaire) (%)
Place of birth for the foreign-born population - Other Middle Africa (%)
Place of birth for the foreign-born population - Egypt (%)
Place of birth for the foreign-born population - Morocco (%)
Place of birth for the foreign-born population - Sudan (%)
Place of birth for the foreign-born population - Other Northern Africa (%)
Place of birth for the foreign-born population - South Africa (%)
Place of birth for the foreign-born population - Other Southern Africa (%)
Place of birth for the foreign-born population - Cabo Verde (%)
Place of birth for the foreign-born population - Ghana (%)
Place of birth for the foreign-born population - Liberia (%)
Place of birth for the foreign-born population - Nigeria (%)
Place of birth for the foreign-born population - Senegal (%)
Place of birth for the foreign-born population - Sierra Leone (%)
Place of birth for the foreign-born population - Other Western Africa (%)
Place of birth for the foreign-born population - Australia (%)
Place of birth for the foreign-born population - New Zealand (%)
Place of birth for the foreign-born population - Fiji (%)
Place of birth for the foreign-born population - Micronesia (%)
Place of birth for the foreign-born population - Bahamas (%)
Place of birth for the foreign-born population - Barbados (%)
Place of birth for the foreign-born population - Cuba (%)
Place of birth for the foreign-born population - Dominica (%)
Place of birth for the foreign-born population - Dominican Republic (%)
Place of birth for the foreign-born population - Grenada (%)
Place of birth for the foreign-born population - Haiti (%)
Place of birth for the foreign-born population - Jamaica (%)
Place of birth for the foreign-born population - St. Vincent and the Grenadines (%)
Place of birth for the foreign-born population - Trinidad and Tobago (%)
Place of birth for the foreign-born population - West Indies (%)
Place of birth for the foreign-born population - Other Caribbean (%)
Place of birth for the foreign-born population - Belize (%)
Place of birth for the foreign-born population - Costa Rica (%)
Place of birth for the foreign-born population - El Salvador (%)
Place of birth for the foreign-born population - Guatemala (%)
Place of birth for the foreign-born population - Honduras (%)
Place of birth for the foreign-born population - Mexico (%)
Place of birth for the foreign-born population - Nicaragua (%)
Place of birth for the foreign-born population - Panama (%)
Place of birth for the foreign-born population - Other Central America (%)
Place of birth for the foreign-born population - Argentina (%)
Place of birth for the foreign-born population - Bolivia (%)
Place of birth for the foreign-born population - Brazil (%)
Place of birth for the foreign-born population - Chile (%)
Place of birth for the foreign-born population - Colombia (%)
Place of birth for the foreign-born population - Ecuador (%)
Place of birth for the foreign-born population - Guyana (%)
Place of birth for the foreign-born population - Peru (%)
Place of birth for the foreign-born population - Uruguay (%)
Place of birth for the foreign-born population - Venezuela (%)
Place of birth for the foreign-born population - Other South America (%)
Place of birth for the foreign-born population - Canada (%)
Place of birth for the foreign-born population - Other Northern America (%)
Place of birth for the foreign-born population - Other (%)
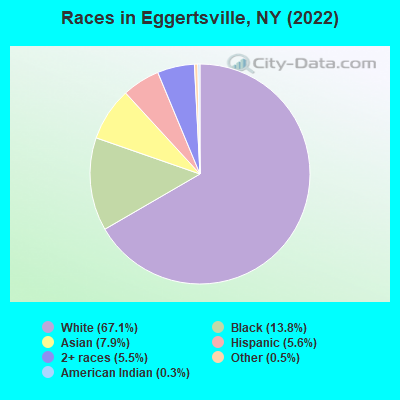
According to 2022 data, the most numerous races in Eggertsville, NY are White alone (10,108 residents), Hispanic (836 residents), and Black alone (2,071 residents). 88.0% of Eggertsville residents speak English at home.
Race distribution in Eggertsville 10,108 67.1% White alone 2,071 13.8% Black alone 1,186 7.9% Asian alone 836 5.6% Hispanic 826 5.5% Two or more races 71 0.5% Other race alone 43 0.3% American Indian alone 15 0.10% Native Hawaiian and Other
2000 2022
11,760,981 62.0% White alone 2,867,583 15.1% Hispanic 2,812,623 14.8% Black alone 1,035,926 5.5% Asian alone 366,116 1.9% Two or more races 75,499 0.4% Other race alone 52,499 0.3% American Indian alone 5,230 0.03% Native Hawaiian and Other
10,408,933 52.9% White alone 3,867,299 19.7% Hispanic 2,633,840 13.4% Black alone 1,776,286 9.0% Asian alone 732,670 3.7% Two or more races 216,110 1.1% Other race alone 35,082 0.2% American Indian alone 6,931 0.04% Native Hawaiian and Other
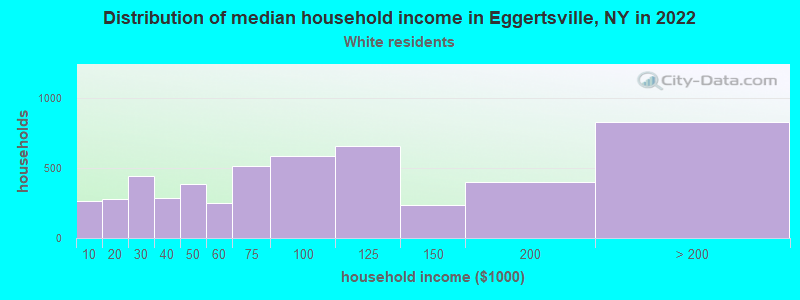
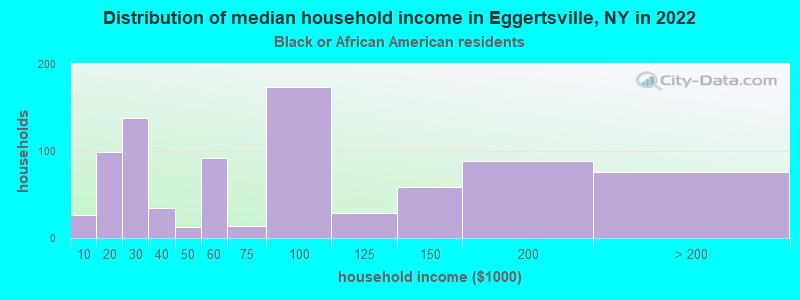
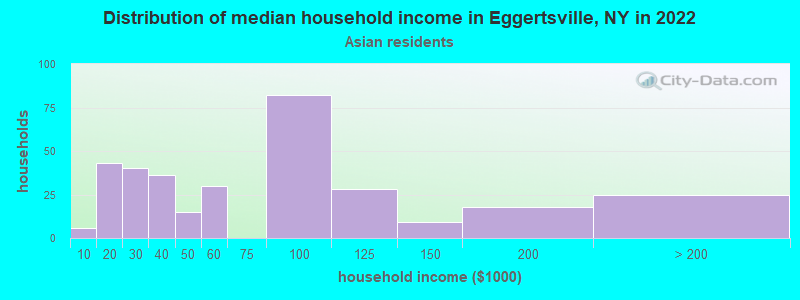
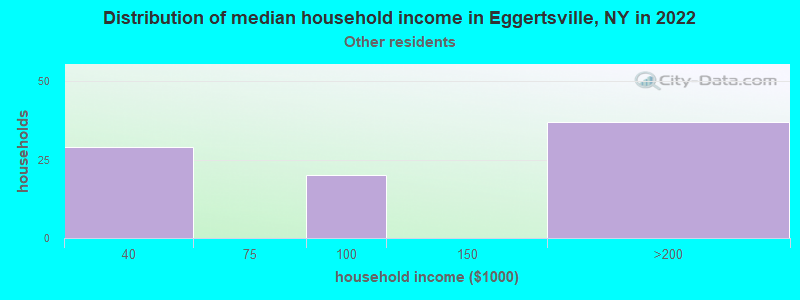
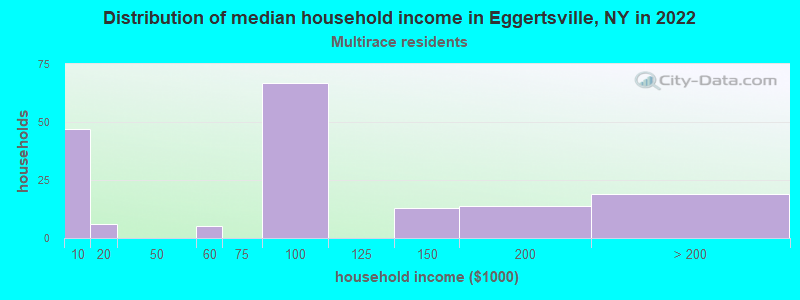
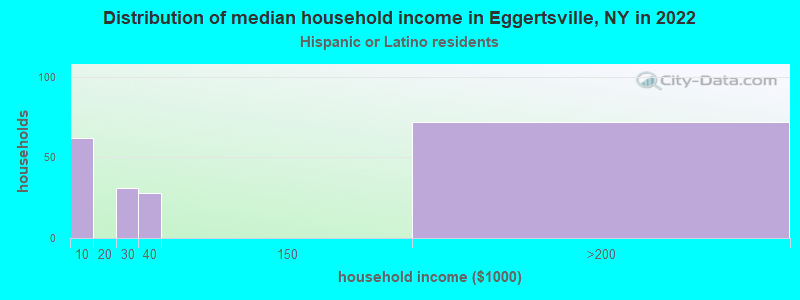
Income and house value in Eggertsville Median household income in 2022 $80,146 White non-Hispanic householders$70,389 Black householders
Median age by race in Eggertsville
43.9 Median age for White residents43.2 43.8 35.9 Median age for Black or African American residents35.0 44.9 18.9 Median age for American Indian / Alaska Native residents14.9 14.9 34.8 Median age for Asian residents27.5 55.6 -700,534,758.7 Median age for Native Hawaiian / Pacific Islander residents-477,502,295.2 -497,387,669.3 46.1 Median age for Other race residents45.7 62.2 15.8 Median age for Two or more races residents20.9 9.9 44.6 Median age for White alone residents43.6 45.1 20.0 Median age for Hispanic or Latino residents26.2 13.4
Owner/renter occupied households by race in Eggertsville
House owners and renters - White residents 3,895 75.8% Owner occupied1,245 24.2% Renter occupiedHouse owners and renters - Black or African American residents 573 66.2% Owner occupied292 33.8% Renter occupiedHouse owners and renters - American Indian / Alaska Native residents 8 100.0% Owner occupiedHouse owners and renters - Asian residents 192 60.7% Owner occupied125 39.3% Renter occupiedHouse owners and renters - Other race residents 45 61.7% Owner occupied28 38.3% Renter occupiedHouse owners and renters - Two or more races residents 128 82.4% Owner occupied27 17.6% Renter occupiedHouse owners and renters - White alone residents 3,844 76.9% Owner occupied1,157 23.1% Renter occupiedHouse owners and renters - Hispanic or Latino residents 85 40.2% Owner occupied126 59.8% Renter occupied
Language usage in Eggertsville
English speakers - Total 88.0% of residents of Eggertsville speak English at home.
0.9% of residents speak Spanish at home 62 47.7% Speak English very well68 52.3% Speak English less than very well11.6% of residents speak other language at home 786 46.8% Speak English very well894 53.2% Speak English less than very well
English speakers - Born in the United States 98.6% of residents of Eggertsville speak English at home.
0.4% of residents speak Spanish at home 7 100.0% Speak English very well1.3% of residents speak other language at home 24 100.0% Speak English very well
English speakers - Native, born elsewhere 77.1% of residents of Eggertsville speak English at home.
24.2% of residents speak Spanish at home 37 100.0% Speak English very well
English speakers - Foreign-born 20.4% of residents of Eggertsville speak English at home.
3.1% of residents speak Spanish at home 1 1.9% Speak English very well51 98.1% Speak English less than very well76.1% of residents speak other language at home 420 32.9% Speak English very well858 67.1% Speak English less than very well
White (Caucasian) - Speak only English Native:
97.5% (9,366)Foreign-born:
30.7% (170)
White (Caucasian) - Speak another language Native:
2.5% (243)Foreign-born:
67.6% (374)
Black or African American - Speak only English Native:
99.6% (1,755)Foreign-born:
49.5% (97)
Asian - Speak only English Native:
29.8% (74)Foreign-born:
3.5% (30)
Asian - Speak another language Native:
70.3% (175)Foreign-born:
98.0% (844)
Other race - Speak only English Native:
100.0% (96)Foreign-born:
23.7% (15)
Two or more races - Speak another language Native:
3.9% (44)Foreign-born:
94.4% (18)
White alone - Speak only English Native:
97.3% (9,046)Foreign-born:
23.3% (112)
White alone - Speak another language Native:
2.7% (247)Foreign-born:
78.5% (379)
Hispanic or Latino - Speak only English Native:
100.0% (700)Foreign-born:
33.8% (38)
Hispanic or Latino - Speak another language Native:
6.6% (46)Foreign-born:
50.2% (57)
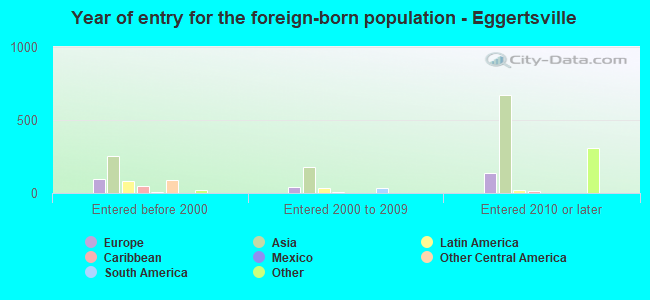
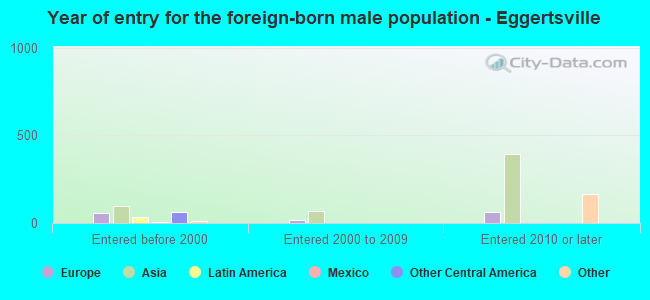
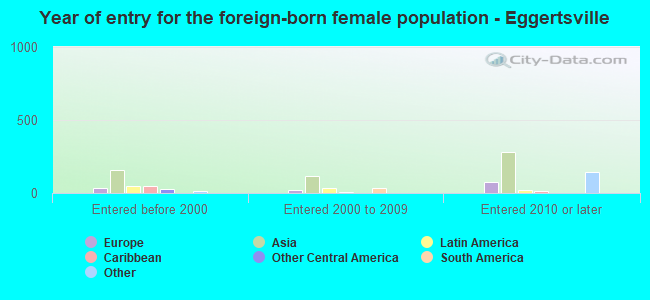
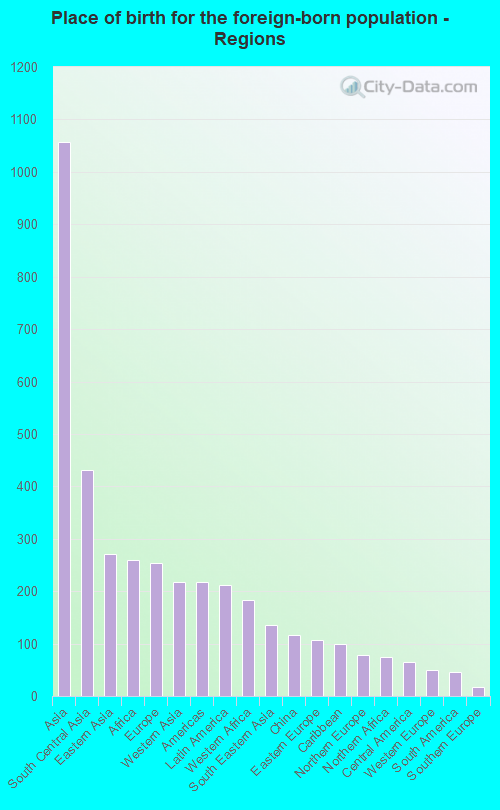
Foreign-born residents in Eggertsville
Marital status for residents in Eggertsville Marital status - White (Caucasian) population 15 years and over
Males 36.0% Never married48.6% Now married0.6% Separated4.2% Widowed10.6% DivorcedFemales 36.6% Never married41.7% Now married0.2% Separated6.2% Widowed15.3% DivorcedWomen who gave birth in the past 12 months Now married:
100.0% (89)Unmarried:
0.0% (0)
Women who did not give birth in the past 12 months Now married:
35.4% (878)Unmarried:
64.6% (1,600)
Marital status - Black or African American population 15 years and over
Males 47.0% Never married35.0% Now married10.1% Separated3.5% Widowed4.3% DivorcedFemales 56.3% Never married29.1% Now married0.0% Separated8.3% Widowed6.3% DivorcedWomen who gave birth in the past 12 months Now married:
100.0% (20)Unmarried:
0.0% (0)
Women who did not give birth in the past 12 months Now married:
16.0% (79)Unmarried:
84.0% (415)
Marital status - American Indian / Alaska Native population 15 years and over
Males 60.0% Never married40.0% Now married0.0% Separated0.0% Widowed0.0% DivorcedFemales 50.0% Never married50.0% Now married0.0% Separated0.0% Widowed0.0% DivorcedWomen who gave birth in the past 12 months Now married:
100.0% (4)Unmarried:
0.0% (0)
Women who did not give birth in the past 12 months Now married:
33.3% (4)Unmarried:
66.7% (9)
Marital status - Asian population 15 years and over
Males 36.1% Never married60.7% Now married0.0% Separated0.0% Widowed3.2% DivorcedFemales 5.5% Never married54.1% Now married0.0% Separated2.6% Widowed37.8% DivorcedWomen who did not give birth in the past 12 months Now married:
50.6% (131)Unmarried:
49.4% (127)
Marital status - Other race population 15 years and over
Males 61.2% Never married38.8% Now married0.0% Separated0.0% Widowed0.0% DivorcedFemales 34.8% Never married39.1% Now married0.0% Separated26.1% Widowed0.0% DivorcedWomen who did not give birth in the past 12 months Now married:
0.0% (0)Unmarried:
100.0% (26)
Marital status - Two or more races population 15 years and over
Males 78.0% Never married22.0% Now married0.0% Separated0.0% Widowed0.0% DivorcedFemales 64.4% Never married31.4% Now married0.0% Separated4.1% Widowed0.0% DivorcedWomen who did not give birth in the past 12 months Now married:
21.7% (33)Unmarried:
78.3% (119)
Marital status - White alone, not Hispanic / Latino population 15 years and over
Males 35.5% Never married48.7% Now married0.6% Separated4.3% Widowed10.8% DivorcedFemales 35.1% Never married43.3% Now married0.2% Separated6.4% Widowed14.9% DivorcedWomen who gave birth in the past 12 months Now married:
100.0% (89)Unmarried:
0.0% (0)
Women who did not give birth in the past 12 months Now married:
37.4% (877)Unmarried:
62.6% (1,469)
Marital status - Hispanic or Latino population 15 years and over
Males 60.8% Never married39.2% Now married0.0% Separated0.0% Widowed0.0% DivorcedFemales 68.2% Never married8.2% Now married0.0% Separated3.4% Widowed20.2% DivorcedWomen who did not give birth in the past 12 months Now married:
5.9% (10)Unmarried:
94.1% (165)
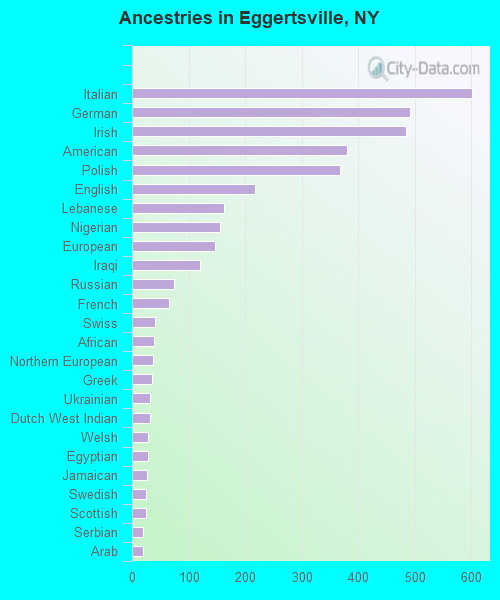
Ancestries in Eggertsville
601 9.0% Italian491 7.4% German485 7.3% Irish380 5.7% American368 5.5% Polish217 3.3% English163 2.5% Lebanese155 2.3% Nigerian146 2.2% European120 1.8% Iraqi74 1.1% Russian66 1.0% French41 0.6% Swiss39 0.6% African37 0.6% Northern European35 0.5% Greek32 0.5% Ukrainian31 0.5% Dutch West Indian29 0.4% Welsh28 0.4% Egyptian27 0.4% Jamaican25 0.4% Swedish24 0.4% Scottish20 0.3% Serbian19 0.3% Arab18 0.3% Eastern European14 0.2% Scotch-Irish13 0.2% Czechoslovakian13 0.2% Hungarian12 0.2% French Canadian5 0.08% British4 0.06% Canadian3 0.05% Norwegian
Children Nativity (place of birth) in Eggertsville
Children under 6 years - Living with two parents Both parents native 401 94.7% Native22 5.3% Foreign-bornBoth parents foreign-born 56 47.3% Native62 52.7% Foreign-bornOne native, one foreign-born parent 24 100.0% NativeChildren under 6 years - Living with one parent Native parent 196 100.0% NativeForeign-born parent 8 100.0% NativeChildren 6 to 17 years - Living with two parents Both parents native 893 100.0% NativeBoth parents foreign-born 82 41.2% Native117 58.8% Foreign-bornChildren 6 to 17 years - Living with one parent Native parent 524 100.0% NativeForeign-born parent 99 54.8% Native81 45.2% Foreign-born
Grandparents responsible for own grandchildren in Eggertsville
Grandparents (30 to 59 years) White / Caucasian 83 100.0% Responsible for grandchildrenBlack or African American 136 100.0% Responsible for grandchildrenAsian 36 100.0% Not responsible for grandchildrenWhite alone, not Hispanic / Latino 39 100.0% Responsible for grandchildrenHispanic or Latino 44 100.0% Responsible for grandchildrenGrandparents (60 years and over) White / Caucasian 41 100.0% Responsible for grandchildrenBlack or African American 61 70.3% Responsible for grandchildren26 29.7% Not responsible for grandchildrenAsian 20 100.0% Not responsible for grandchildrenWhite alone, not Hispanic / Latino 42 100.0% Responsible for grandchildren