Races in East Moline, Illinois (IL) Detailed Stats
Data:
Races - White alone (%)
Races - White alone (% change since 2000)
Races - Black alone (%)
Races - Black alone (% change since 2000)
Races - American Indian alone (%)
Races - American Indian alone (% change since 2000)
Races - Asian alone (%)
Races - Asian alone (% change since 2000)
Races - Hispanic (%)
Races - Hispanic (% change since 2000)
Races - Native Hawaiian and Other Pacific Islander alone (%)
Races - Native Hawaiian and Other Pacific Islander alone (% change since 2000)
Races - Two or more races(%)
Races - Two or more races(% change since 2000)
Races - Other race alone (%)
Races - Other race alone (% change since 2000)
Racial diversity
Place of birth - Born in state of residence (%)
Place of birth - Born in state of residence (%) - White
Place of birth - Born in state of residence (%) - Black or African American
Place of birth - Born in state of residence (%) - Asian
Place of birth - Born in state of residence (%) - Hispanic or Latino
Place of birth - Born in state of residence (%) - American Indian and Alaska Native
Place of birth - Born in state of residence (%) - Multirace
Place of birth - Born in state of residence (%) - Other Race
Place of birth - Born in other state (%)
Place of birth - Born in other state (%) - White
Place of birth - Born in other state (%) - Black or African American
Place of birth - Born in other state (%) - Asian
Place of birth - Born in other state (%) - Hispanic or Latino
Place of birth - Born in other state (%) - American Indian and Alaska Native
Place of birth - Born in other state (%) - Multirace
Place of birth - Born in other state (%) - Other Race
Place of birth - Native, outside of US (%)
Place of birth - Native, outside of US (%) - White
Place of birth - Native, outside of US (%) - Black or African American
Place of birth - Native, outside of US (%) - Asian
Place of birth - Native, outside of US (%) - Hispanic or Latino
Place of birth - Native, outside of US (%) - American Indian and Alaska Native
Place of birth - Native, outside of US (%) - Multirace
Place of birth - Native, outside of US (%) - Other Race
Place of birth - Foreign born (%)
Place of birth - Foreign born (%) - White
Place of birth - Foreign born (%) - Black or African American
Place of birth - Foreign born (%) - Asian
Place of birth - Foreign born (%) - Hispanic or Latino
Place of birth - Foreign born (%) - American Indian and Alaska Native
Place of birth - Foreign born (%) - Multirace
Place of birth - Foreign born (%) - Other Race
Residents speaking English at home (%)
Residents speaking English at home - Born in the United States (%)
Residents speaking English at home - Native, born elsewhere (%)
Residents speaking English at home - Foreign born (%)
Residents speaking Spanish at home (%)
Residents speaking Spanish at home - Born in the United States (%)
Residents speaking Spanish at home - Native, born elsewhere (%)
Residents speaking Spanish at home - Foreign born (%)
Residents speaking other language at home (%)
Residents speaking other language at home - Born in the United States (%)
Residents speaking other language at home - Native, born elsewhere (%)
Residents speaking other language at home - Foreign born (%)
Marital status - Never married (%)
Marital status - Now married (%)
Marital status - Separated (%)
Marital status - Widowed (%)
Marital status - Divorced (%)
Ancestries Reported - Arab (%)
Ancestries Reported - Czech (%)
Ancestries Reported - Danish (%)
Ancestries Reported - Dutch (%)
Ancestries Reported - English (%)
Ancestries Reported - French (%)
Ancestries Reported - French Canadian (%)
Ancestries Reported - German (%)
Ancestries Reported - Greek (%)
Ancestries Reported - Hungarian (%)
Ancestries Reported - Irish (%)
Ancestries Reported - Italian (%)
Ancestries Reported - Lithuanian (%)
Ancestries Reported - Norwegian (%)
Ancestries Reported - Polish (%)
Ancestries Reported - Portuguese (%)
Ancestries Reported - Russian (%)
Ancestries Reported - Scotch-Irish (%)
Ancestries Reported - Scottish (%)
Ancestries Reported - Slovak (%)
Ancestries Reported - Subsaharan African (%)
Ancestries Reported - Swedish (%)
Ancestries Reported - Swiss (%)
Ancestries Reported - Ukrainian (%)
Ancestries Reported - United States (%)
Ancestries Reported - Welsh (%)
Ancestries Reported - West Indian (%)
Ancestries Reported - Other (%)
Geographical mobility - Same house 1 year ago (%)
Geographical mobility - Same house 1 year ago (%) - White
Geographical mobility - Same house 1 year ago (%) - Black or African American
Geographical mobility - Same house 1 year ago (%) - Asian
Geographical mobility - Same house 1 year ago (%) - Hispanic or Latino
Geographical mobility - Same house 1 year ago (%) - American Indian and Alaska Native
Geographical mobility - Same house 1 year ago (%) - Multirace
Geographical mobility - Same house 1 year ago (%) - Other Race
Geographical mobility - Moved within same county (%)
Geographical mobility - Moved within same county (%) - White
Geographical mobility - Moved within same county (%) - Black or African American
Geographical mobility - Moved within same county (%) - Asian
Geographical mobility - Moved within same county (%) - Hispanic or Latino
Geographical mobility - Moved within same county (%) - American Indian and Alaska Native
Geographical mobility - Moved within same county (%) - Multirace
Geographical mobility - Moved within same county (%) - Other Race
Geographical mobility - Moved from different county within same state (%)
Geographical mobility - Moved from different county within same state (%) - White
Geographical mobility - Moved from different county within same state (%) - Black or African American
Geographical mobility - Moved from different county within same state (%) - Asian
Geographical mobility - Moved from different county within same state (%) - Hispanic or Latino
Geographical mobility - Moved from different county within same state (%) - American Indian and Alaska Native
Geographical mobility - Moved from different county within same state (%) - Multirace
Geographical mobility - Moved from different county within same state (%) - Other Race
Geographical mobility - Moved from different state (%)
Geographical mobility - Moved from different state (%) - White
Geographical mobility - Moved from different state (%) - Black or African American
Geographical mobility - Moved from different state (%) - Asian
Geographical mobility - Moved from different state (%) - Hispanic or Latino
Geographical mobility - Moved from different state (%) - American Indian and Alaska Native
Geographical mobility - Moved from different state (%) - Multirace
Geographical mobility - Moved from different state (%) - Other Race
Geographical mobility - Moved from abroad (%)
Geographical mobility - Moved from abroad (%) - White
Geographical mobility - Moved from abroad (%) - Black or African American
Geographical mobility - Moved from abroad (%) - Asian
Geographical mobility - Moved from abroad (%) - Hispanic or Latino
Geographical mobility - Moved from abroad (%) - American Indian and Alaska Native
Geographical mobility - Moved from abroad (%) - Multirace
Geographical mobility - Moved from abroad (%) - Other Race
Place of birth for the foreign-born population - Ireland (%)
Place of birth for the foreign-born population - Denmark (%)
Place of birth for the foreign-born population - Norway (%)
Place of birth for the foreign-born population - Sweden (%)
Place of birth for the foreign-born population - United Kingdom (%)
Place of birth for the foreign-born population - England (%)
Place of birth for the foreign-born population - Scotland (%)
Place of birth for the foreign-born population - Other Northern Europe (%)
Place of birth for the foreign-born population - Austria (%)
Place of birth for the foreign-born population - Belgium (%)
Place of birth for the foreign-born population - France (%)
Place of birth for the foreign-born population - Germany (%)
Place of birth for the foreign-born population - Netherlands (%)
Place of birth for the foreign-born population - Switzerland (%)
Place of birth for the foreign-born population - Other Western Europe (%)
Place of birth for the foreign-born population - Greece (%)
Place of birth for the foreign-born population - Italy (%)
Place of birth for the foreign-born population - Portugal (%)
Place of birth for the foreign-born population - Spain (%)
Place of birth for the foreign-born population - Other Southern Europe (%)
Place of birth for the foreign-born population - Albania (%)
Place of birth for the foreign-born population - Belarus (%)
Place of birth for the foreign-born population - Bosnia and Herzegovina (%)
Place of birth for the foreign-born population - Bulgaria (%)
Place of birth for the foreign-born population - Croatia (%)
Place of birth for the foreign-born population - Czechoslovakia (%)
Place of birth for the foreign-born population - Hungary (%)
Place of birth for the foreign-born population - Latvia (%)
Place of birth for the foreign-born population - Lithuania (%)
Place of birth for the foreign-born population - North Macedonia (Macedonia) (%)
Place of birth for the foreign-born population - Moldova (%)
Place of birth for the foreign-born population - Poland (%)
Place of birth for the foreign-born population - Romania (%)
Place of birth for the foreign-born population - Russia (%)
Place of birth for the foreign-born population - Serbia (%)
Place of birth for the foreign-born population - Ukraine (%)
Place of birth for the foreign-born population - Other Eastern Europe (%)
Place of birth for the foreign-born population - China (%)
Place of birth for the foreign-born population - Hong Kong (%)
Place of birth for the foreign-born population - Taiwan (%)
Place of birth for the foreign-born population - Japan (%)
Place of birth for the foreign-born population - Korea (%)
Place of birth for the foreign-born population - Other Eastern Asia (%)
Place of birth for the foreign-born population - Afghanistan (%)
Place of birth for the foreign-born population - Bangladesh (%)
Place of birth for the foreign-born population - India (%)
Place of birth for the foreign-born population - Iran (%)
Place of birth for the foreign-born population - Kazakhstan (%)
Place of birth for the foreign-born population - Nepal (%)
Place of birth for the foreign-born population - Pakistan (%)
Place of birth for the foreign-born population - Sri Lanka (%)
Place of birth for the foreign-born population - Uzbekistan (%)
Place of birth for the foreign-born population - Other South Central Asia (%)
Place of birth for the foreign-born population - Burma (%)
Place of birth for the foreign-born population - Cambodia (%)
Place of birth for the foreign-born population - Indonesia (%)
Place of birth for the foreign-born population - Laos (%)
Place of birth for the foreign-born population - Malaysia (%)
Place of birth for the foreign-born population - Philippines (%)
Place of birth for the foreign-born population - Singapore (%)
Place of birth for the foreign-born population - Thailand (%)
Place of birth for the foreign-born population - Vietnam (%)
Place of birth for the foreign-born population - Other South Eastern Asia (%)
Place of birth for the foreign-born population - Armenia (%)
Place of birth for the foreign-born population - Iraq (%)
Place of birth for the foreign-born population - Israel (%)
Place of birth for the foreign-born population - Jordan (%)
Place of birth for the foreign-born population - Kuwait (%)
Place of birth for the foreign-born population - Lebanon (%)
Place of birth for the foreign-born population - Saudi Arabia (%)
Place of birth for the foreign-born population - Syria (%)
Place of birth for the foreign-born population - Turkey (%)
Place of birth for the foreign-born population - Yemen (%)
Place of birth for the foreign-born population - Other Western Asia (%)
Place of birth for the foreign-born population - Eritrea (%)
Place of birth for the foreign-born population - Ethiopia (%)
Place of birth for the foreign-born population - Kenya (%)
Place of birth for the foreign-born population - Somalia (%)
Place of birth for the foreign-born population - Uganda (%)
Place of birth for the foreign-born population - Zimbabwe (%)
Place of birth for the foreign-born population - Other Eastern Africa (%)
Place of birth for the foreign-born population - Cameroon (%)
Place of birth for the foreign-born population - Congo (%)
Place of birth for the foreign-born population - Democratic Republic of Congo (Zaire) (%)
Place of birth for the foreign-born population - Other Middle Africa (%)
Place of birth for the foreign-born population - Egypt (%)
Place of birth for the foreign-born population - Morocco (%)
Place of birth for the foreign-born population - Sudan (%)
Place of birth for the foreign-born population - Other Northern Africa (%)
Place of birth for the foreign-born population - South Africa (%)
Place of birth for the foreign-born population - Other Southern Africa (%)
Place of birth for the foreign-born population - Cabo Verde (%)
Place of birth for the foreign-born population - Ghana (%)
Place of birth for the foreign-born population - Liberia (%)
Place of birth for the foreign-born population - Nigeria (%)
Place of birth for the foreign-born population - Senegal (%)
Place of birth for the foreign-born population - Sierra Leone (%)
Place of birth for the foreign-born population - Other Western Africa (%)
Place of birth for the foreign-born population - Australia (%)
Place of birth for the foreign-born population - New Zealand (%)
Place of birth for the foreign-born population - Fiji (%)
Place of birth for the foreign-born population - Micronesia (%)
Place of birth for the foreign-born population - Bahamas (%)
Place of birth for the foreign-born population - Barbados (%)
Place of birth for the foreign-born population - Cuba (%)
Place of birth for the foreign-born population - Dominica (%)
Place of birth for the foreign-born population - Dominican Republic (%)
Place of birth for the foreign-born population - Grenada (%)
Place of birth for the foreign-born population - Haiti (%)
Place of birth for the foreign-born population - Jamaica (%)
Place of birth for the foreign-born population - St. Vincent and the Grenadines (%)
Place of birth for the foreign-born population - Trinidad and Tobago (%)
Place of birth for the foreign-born population - West Indies (%)
Place of birth for the foreign-born population - Other Caribbean (%)
Place of birth for the foreign-born population - Belize (%)
Place of birth for the foreign-born population - Costa Rica (%)
Place of birth for the foreign-born population - El Salvador (%)
Place of birth for the foreign-born population - Guatemala (%)
Place of birth for the foreign-born population - Honduras (%)
Place of birth for the foreign-born population - Mexico (%)
Place of birth for the foreign-born population - Nicaragua (%)
Place of birth for the foreign-born population - Panama (%)
Place of birth for the foreign-born population - Other Central America (%)
Place of birth for the foreign-born population - Argentina (%)
Place of birth for the foreign-born population - Bolivia (%)
Place of birth for the foreign-born population - Brazil (%)
Place of birth for the foreign-born population - Chile (%)
Place of birth for the foreign-born population - Colombia (%)
Place of birth for the foreign-born population - Ecuador (%)
Place of birth for the foreign-born population - Guyana (%)
Place of birth for the foreign-born population - Peru (%)
Place of birth for the foreign-born population - Uruguay (%)
Place of birth for the foreign-born population - Venezuela (%)
Place of birth for the foreign-born population - Other South America (%)
Place of birth for the foreign-born population - Canada (%)
Place of birth for the foreign-born population - Other Northern America (%)
Place of birth for the foreign-born population - Other (%)
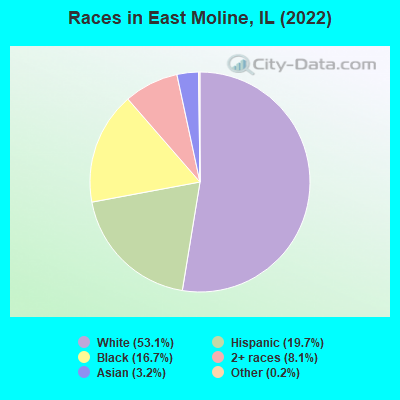
According to 2022 data, the most numerous races in East Moline, IL are White alone (10,931 residents), Hispanic (4,066 residents), and Black alone (3,443 residents). 77.5% of East Moline residents speak English at home. 14.6% of East Moline, IL residents are foreign-born (5.8% born in Africa, 4.1% born in Latin America, 3.1% born in Asia), which is 3.9% greater than the foreign-born rate of 14.0% across the entire state of Illinois.
Race distribution in East Moline
2000 2022
8,424,140 67.8% White alone 1,856,152 14.9% Black alone 1,530,262 12.3% Hispanic 419,916 3.4% Asian alone 153,996 1.2% Two or more races 13,479 0.1% Other race alone 18,232 0.1% American Indian alone 3,116 0.03% Native Hawaiian and Other
7,356,301 58.5% White alone 2,299,726 18.3% Hispanic 1,660,423 13.2% Black alone 747,296 5.9% Asian alone 458,599 3.6% Two or more races 45,386 0.4% Other race alone 10,405 0.08% American Indian alone 3,896 0.03% Native Hawaiian and Other
Income and house value in East Moline Median household income in 2022 $60,282 White non-Hispanic householders$44,329 Black householders$150,642 Asian householders$51,853 Some other race householders$44,492 Two or more races householders$66,164 Hispanic or Latino race householdersMedian 2022 house value $136,937 White Non-Hispanic householders$81,079 Black or African American householders$55,012 American Indian or Alaska Native householders $144,554 Asian householders$88,696 Some other race householders$127,628 Two or more races householders$106,131 Hispanic or Latino householders
Median age by race in East Moline
47.2 Median age for White residents46.0 50.4 31.0 Median age for Black or African American residents30.7 29.2 87.8 Median age for American Indian / Alaska Native residents76.4 -688,956,432.9 41.1 Median age for Asian residents31.9 51.3 -593,236,714.4 Median age for Native Hawaiian / Pacific Islander residents-658,536,584.7 -576,015,108.0 29.1 Median age for Other race residents26.6 30.7 22.3 Median age for Two or more races residents24.6 22.0 51.0 Median age for White alone residents47.0 53.6 27.8 Median age for Hispanic or Latino residents28.7 26.7
Owner/renter occupied households by race in East Moline
House owners and renters - White residents 4,523 75.8% Owner occupied1,444 24.2% Renter occupiedHouse owners and renters - Black or African American residents 412 39.4% Owner occupied634 60.6% Renter occupiedHouse owners and renters - American Indian / Alaska Native residents 17 100.0% Owner occupiedHouse owners and renters - Asian residents 97 49.1% Owner occupied101 50.9% Renter occupiedHouse owners and renters - Other race residents 310 60.5% Owner occupied202 39.5% Renter occupiedHouse owners and renters - Two or more races residents 332 34.8% Owner occupied621 65.2% Renter occupiedHouse owners and renters - White alone residents 4,164 75.6% Owner occupied1,347 24.4% Renter occupiedHouse owners and renters - Hispanic or Latino residents 860 69.4% Owner occupied379 30.6% Renter occupied
Language usage in East Moline
English speakers - Total 77.5% of residents of East Moline speak English at home.
11.7% of residents speak Spanish at home 1,452 64.0% Speak English very well816 36.0% Speak English less than very well8.8% of residents speak other language at home 925 54.0% Speak English very well789 46.0% Speak English less than very well
English speakers - Born in the United States 87.7% of residents of East Moline speak English at home.
10.7% of residents speak Spanish at home 437 91.2% Speak English very well42 8.8% Speak English less than very well2.1% of residents speak other language at home 91 95.8% Speak English very well4 4.2% Speak English less than very well
All residents speak only English at home
English speakers - Foreign-born 7.0% of residents of East Moline speak English at home.
31.3% of residents speak Spanish at home 180 24.8% Speak English very well546 75.2% Speak English less than very well56.0% of residents speak other language at home 662 51.0% Speak English very well637 49.0% Speak English less than very well
White (Caucasian) - Speak only English Native:
95.9% (11,027)Foreign-born:
15.9% (56)
White (Caucasian) - Speak another language Native:
3.7% (427)Foreign-born:
100.0% (350)
Black or African American - Speak only English Native:
84.9% (1,920)Foreign-born:
24.1% (186)
Black or African American - Speak another language Native:
15.5% (350)Foreign-born:
100.0% (774)
Asian - Speak another language Native:
100.0% (121)Foreign-born:
99.6% (607)
Other race - Speak another language Native:
70.7% (763)Foreign-born:
98.1% (327)
Two or more races - Speak another language Native:
13.2% (288)Foreign-born:
98.4% (61)
White alone - Speak only English Native:
99.2% (10,330)Foreign-born:
24.3% (60)
White alone - Speak another language Native:
0.8% (88)Foreign-born:
75.2% (185)
Hispanic or Latino - Speak only English Native:
51.5% (1,497)Foreign-born:
0.1% (1)
Hispanic or Latino - Speak another language Native:
48.0% (1,396)Foreign-born:
100.0% (778)
Foreign-born residents in East Moline 3,002 residents are foreign born (5.8% Africa , 4.1% Latin America , 3.1% Asia ).
This city:
14.6%Illinois:
14.1%
Marital status for residents in East Moline Marital status - White (Caucasian) population 15 years and over
Males 32.9% Never married49.9% Now married2.6% Separated5.1% Widowed9.5% DivorcedFemales 17.4% Never married47.2% Now married2.0% Separated15.9% Widowed17.5% DivorcedWomen who gave birth in the past 12 months Now married:
82.3% (84)Unmarried:
17.7% (18)
Women who did not give birth in the past 12 months Now married:
42.4% (941)Unmarried:
57.6% (1,280)
Marital status - Black or African American population 15 years and over
Males 56.1% Never married37.4% Now married0.1% Separated0.0% Widowed6.4% DivorcedFemales 44.3% Never married41.1% Now married5.4% Separated3.7% Widowed5.5% DivorcedWomen who gave birth in the past 12 months Now married:
89.2% (24)Unmarried:
10.8% (3)
Women who did not give birth in the past 12 months Now married:
45.5% (315)Unmarried:
54.5% (378)
Marital status - American Indian / Alaska Native population 15 years and over
Males 0.0% Never married44.4% Now married11.1% Separated0.0% Widowed44.4% DivorcedFemales 0.0% Never married0.0% Now married0.0% Separated0.0% Widowed100.0% DivorcedMarital status - Asian population 15 years and over
Males 18.1% Never married77.5% Now married0.0% Separated0.0% Widowed4.3% DivorcedFemales 8.9% Never married76.0% Now married0.0% Separated15.1% Widowed0.0% DivorcedWomen who did not give birth in the past 12 months Now married:
88.4% (154)Unmarried:
11.6% (20)
Marital status - Other race population 15 years and over
Males 52.7% Never married32.5% Now married6.1% Separated0.0% Widowed8.7% DivorcedFemales 36.3% Never married37.4% Now married10.8% Separated0.0% Widowed15.5% DivorcedWomen who gave birth in the past 12 months Now married:
100.0% (6)Unmarried:
0.0% (0)
Women who did not give birth in the past 12 months Now married:
41.4% (180)Unmarried:
58.6% (255)
Marital status - Two or more races population 15 years and over
Males 52.5% Never married38.4% Now married0.0% Separated0.0% Widowed9.0% DivorcedFemales 70.5% Never married11.8% Now married2.6% Separated3.5% Widowed11.6% DivorcedWomen who gave birth in the past 12 months Now married:
0.0% (0)Unmarried:
100.0% (19)
Women who did not give birth in the past 12 months Now married:
13.0% (73)Unmarried:
87.0% (485)
Marital status - White alone, not Hispanic / Latino population 15 years and over
Males 29.9% Never married51.8% Now married2.9% Separated5.7% Widowed9.6% DivorcedFemales 17.2% Never married44.3% Now married1.9% Separated17.2% Widowed19.4% DivorcedWomen who gave birth in the past 12 months Now married:
23.1% (5)Unmarried:
76.9% (18)
Women who did not give birth in the past 12 months Now married:
40.2% (792)Unmarried:
59.8% (1,180)
Marital status - Hispanic or Latino population 15 years and over
Males 52.9% Never married36.7% Now married2.0% Separated0.0% Widowed8.4% DivorcedFemales 31.3% Never married52.8% Now married5.3% Separated3.0% Widowed7.6% DivorcedWomen who gave birth in the past 12 months Now married:
100.0% (93)Unmarried:
0.0% (0)
Women who did not give birth in the past 12 months Now married:
47.1% (457)Unmarried:
52.9% (513)
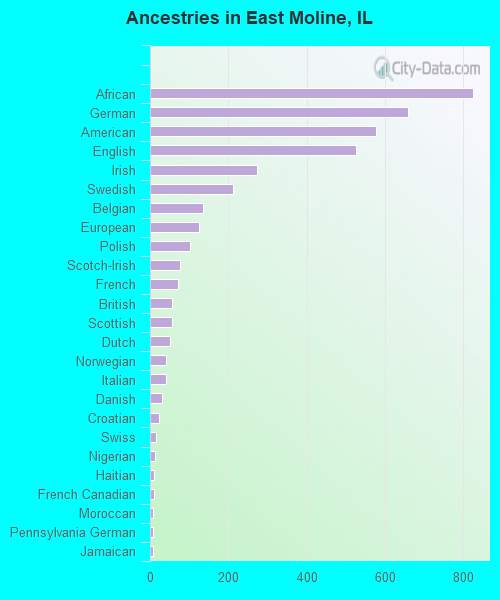
Ancestries in East Moline
824 8.7% African659 7.0% German577 6.1% American525 5.5% English272 2.9% Irish212 2.2% Swedish135 1.4% Belgian124 1.3% European103 1.1% Polish76 0.8% Scotch-Irish72 0.8% French57 0.6% British55 0.6% Scottish52 0.5% Dutch42 0.4% Norwegian40 0.4% Italian31 0.3% Danish22 0.2% Croatian15 0.2% Swiss12 0.1% Nigerian11 0.1% Haitian9 0.10% French Canadian8 0.08% Moroccan8 0.08% Pennsylvania German8 0.08% Jamaican6 0.06% Russian4 0.04% Northern European4 0.04% Sudanese
Geographical mobility in East Moline Same house 1 year ago 11,581 92.8% White (Caucasian)3,082 86.1% Black or African American31 99.7% American Indian / Alaska Native538 73.5% Asian1,509 96.7% Other race1,972 77.3% Two or more races10,315 94.4% White alone, not Hispanic / Latino3,538 87.7% Hispanic or LatinoMoved within same county 451 3.6% White / Caucasian332 9.3% Black or African American49 6.6% Asian8 94.6% Native Hawaiian / Pacific Islander33 2.1% Other race186 7.3% Two or more races293 2.7% White alone, not Hispanic / Latino228 5.6% Hispanic or LatinoMoved within same state 225 1.8% White / Caucasian356 9.9% Black or African American147 20.0% Asian8 0.5% Other race200 7.9% Two or more races217 2.0% White alone, not Hispanic / Latino59 1.5% Hispanic or LatinoMoved from different state 218 1.7% White / Caucasian39 1.1% Black or African American12 1.7% Asian16 1.0% Other race177 1.6% White alone, not Hispanic / Latino30 0.7% Hispanic or LatinoMoved from abroad 7 0.1% White122 3.4% Black or African American8 1.1% Asian23 0.9% Two or more races7 0.1% White alone, not Hispanic / Latino25 0.6% Hispanic or Latino
Children Nativity (place of birth) in East Moline
Children under 6 years - Living with two parents Both parents native 126 100.0% NativeBoth parents foreign-born 67 81.8% Native15 18.2% Foreign-bornOne native, one foreign-born parent 161 100.0% NativeChildren under 6 years - Living with one parent Native parent 912 100.0% NativeForeign-born parent 117 100.0% NativeChildren 6 to 17 years - Living with two parents Both parents native 1,096 81.1% Native255 18.9% Foreign-bornBoth parents foreign-born 412 70.9% Native169 29.1% Foreign-bornOne native, one foreign-born parent 184 100.0% NativeChildren 6 to 17 years - Living with one parent Native parent 1,428 100.0% NativeForeign-born parent 322 47.2% Native360 52.8% Foreign-born
Grandparents responsible for own grandchildren in East Moline
Grandparents (30 to 59 years) White / Caucasian 20 31.0% Responsible for grandchildren45 69.0% Not responsible for grandchildrenBlack or African American 149 71.1% Responsible for grandchildren60 28.9% Not responsible for grandchildrenOther race 2 100.0% Not responsible for grandchildrenTwo or more races 188 100.0% Responsible for grandchildrenWhite alone, not Hispanic / Latino 22 29.6% Responsible for grandchildren53 70.4% Not responsible for grandchildrenHispanic or Latino 238 93.1% Responsible for grandchildren18 6.9% Not responsible for grandchildrenGrandparents (60 years and over) White / Caucasian 43 52.6% Responsible for grandchildren39 47.4% Not responsible for grandchildrenBlack or African American 5 31.3% Responsible for grandchildren10 68.7% Not responsible for grandchildrenTwo or more races 27 100.0% Not responsible for grandchildrenWhite alone, not Hispanic / Latino 43 54.1% Responsible for grandchildren37 45.9% Not responsible for grandchildrenHispanic or Latino 16 100.0% Not responsible for grandchildren