Races in Dutch Fork, South Carolina (SC) Detailed Stats
Ancestries, Foreign-born residents, place of birth
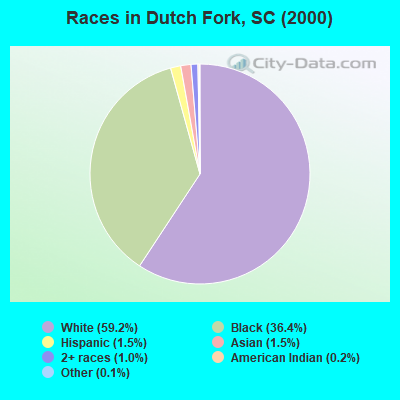
Race distribution in Dutch Fork

- 35,11759.2%White alone
- 21,60836.4%Black alone
- 9041.5%Hispanic
- 8961.5%Asian alone
- 5661.0%Two or more races
- 1160.2%American Indian alone
- 880.1%Other race alone
- 370.06%Native Hawaiian and Other
Pacific Islander alone
2000
2022
-
- 2,652,29166.1%White alone
- 1,178,48629.4%Black alone
- 95,0762.4%Hispanic
- 35,5680.9%Asian alone
- 33,2900.8%Two or more races
- 12,7650.3%American Indian alone
- 3,2660.08%Other race alone
- 1,2700.03%Native Hawaiian and Other
Pacific Islander alone

-
- 3,301,73962.5%White alone
- 1,313,29024.9%Black alone
- 343,7836.5%Hispanic
- 190,5083.6%Two or more races
- 89,8881.7%Asian alone
- 29,3900.6%Other race alone
- 12,1120.2%American Indian alone
- 1,9240.04%Native Hawaiian and Other
Pacific Islander alone

Income and house value in Dutch Fork
- Median household income in 2022
- $74,411White non-Hispanic householders
- $57,303Black householders
- $52,713American Indian and Alaska Native householders
- $75,730Asian householders
- $53,822Some other race householders
- $79,620Two or more races householders
- $68,005Hispanic or Latino race householders
- Median 2022 house value
- $250,231White Non-Hispanic householders
- $211,147Black or African American householders
- $259,525American Indian or Alaska Native householders
- $226,638Asian householders
- $387,263Native Hawaiian and other Pacific Islander householders
- $327,684Some other race householders
- $301,231Two or more races householders
- $221,872Hispanic or Latino householders
Household income for White non-Hispanic householders

Household income for Black householders

Household income for American Indian and Alaska Native householders

Household income for Asian householders

Household income for Native Hawaiian and other Pacific Islander householders

Household income for Two or more races householders

Household income for Hispanic or Latino race householders

Zip code: 29063