Races in Cos Cob, Connecticut (CT) Detailed Stats
Data:
Races - White alone (%)
Races - White alone (% change since 2000)
Races - Black alone (%)
Races - Black alone (% change since 2000)
Races - American Indian alone (%)
Races - American Indian alone (% change since 2000)
Races - Asian alone (%)
Races - Asian alone (% change since 2000)
Races - Hispanic (%)
Races - Hispanic (% change since 2000)
Races - Native Hawaiian and Other Pacific Islander alone (%)
Races - Native Hawaiian and Other Pacific Islander alone (% change since 2000)
Races - Two or more races(%)
Races - Two or more races(% change since 2000)
Races - Other race alone (%)
Races - Other race alone (% change since 2000)
Racial diversity
Place of birth - Born in state of residence (%)
Place of birth - Born in state of residence (%) - White
Place of birth - Born in state of residence (%) - Black or African American
Place of birth - Born in state of residence (%) - Asian
Place of birth - Born in state of residence (%) - Hispanic or Latino
Place of birth - Born in state of residence (%) - American Indian and Alaska Native
Place of birth - Born in state of residence (%) - Multirace
Place of birth - Born in state of residence (%) - Other Race
Place of birth - Born in other state (%)
Place of birth - Born in other state (%) - White
Place of birth - Born in other state (%) - Black or African American
Place of birth - Born in other state (%) - Asian
Place of birth - Born in other state (%) - Hispanic or Latino
Place of birth - Born in other state (%) - American Indian and Alaska Native
Place of birth - Born in other state (%) - Multirace
Place of birth - Born in other state (%) - Other Race
Place of birth - Native, outside of US (%)
Place of birth - Native, outside of US (%) - White
Place of birth - Native, outside of US (%) - Black or African American
Place of birth - Native, outside of US (%) - Asian
Place of birth - Native, outside of US (%) - Hispanic or Latino
Place of birth - Native, outside of US (%) - American Indian and Alaska Native
Place of birth - Native, outside of US (%) - Multirace
Place of birth - Native, outside of US (%) - Other Race
Place of birth - Foreign born (%)
Place of birth - Foreign born (%) - White
Place of birth - Foreign born (%) - Black or African American
Place of birth - Foreign born (%) - Asian
Place of birth - Foreign born (%) - Hispanic or Latino
Place of birth - Foreign born (%) - American Indian and Alaska Native
Place of birth - Foreign born (%) - Multirace
Place of birth - Foreign born (%) - Other Race
Residents speaking English at home (%)
Residents speaking English at home - Born in the United States (%)
Residents speaking English at home - Native, born elsewhere (%)
Residents speaking English at home - Foreign born (%)
Residents speaking Spanish at home (%)
Residents speaking Spanish at home - Born in the United States (%)
Residents speaking Spanish at home - Native, born elsewhere (%)
Residents speaking Spanish at home - Foreign born (%)
Residents speaking other language at home (%)
Residents speaking other language at home - Born in the United States (%)
Residents speaking other language at home - Native, born elsewhere (%)
Residents speaking other language at home - Foreign born (%)
Marital status - Never married (%)
Marital status - Now married (%)
Marital status - Separated (%)
Marital status - Widowed (%)
Marital status - Divorced (%)
Ancestries Reported - Arab (%)
Ancestries Reported - Czech (%)
Ancestries Reported - Danish (%)
Ancestries Reported - Dutch (%)
Ancestries Reported - English (%)
Ancestries Reported - French (%)
Ancestries Reported - French Canadian (%)
Ancestries Reported - German (%)
Ancestries Reported - Greek (%)
Ancestries Reported - Hungarian (%)
Ancestries Reported - Irish (%)
Ancestries Reported - Italian (%)
Ancestries Reported - Lithuanian (%)
Ancestries Reported - Norwegian (%)
Ancestries Reported - Polish (%)
Ancestries Reported - Portuguese (%)
Ancestries Reported - Russian (%)
Ancestries Reported - Scotch-Irish (%)
Ancestries Reported - Scottish (%)
Ancestries Reported - Slovak (%)
Ancestries Reported - Subsaharan African (%)
Ancestries Reported - Swedish (%)
Ancestries Reported - Swiss (%)
Ancestries Reported - Ukrainian (%)
Ancestries Reported - United States (%)
Ancestries Reported - Welsh (%)
Ancestries Reported - West Indian (%)
Ancestries Reported - Other (%)
Geographical mobility - Same house 1 year ago (%)
Geographical mobility - Same house 1 year ago (%) - White
Geographical mobility - Same house 1 year ago (%) - Black or African American
Geographical mobility - Same house 1 year ago (%) - Asian
Geographical mobility - Same house 1 year ago (%) - Hispanic or Latino
Geographical mobility - Same house 1 year ago (%) - American Indian and Alaska Native
Geographical mobility - Same house 1 year ago (%) - Multirace
Geographical mobility - Same house 1 year ago (%) - Other Race
Geographical mobility - Moved within same county (%)
Geographical mobility - Moved within same county (%) - White
Geographical mobility - Moved within same county (%) - Black or African American
Geographical mobility - Moved within same county (%) - Asian
Geographical mobility - Moved within same county (%) - Hispanic or Latino
Geographical mobility - Moved within same county (%) - American Indian and Alaska Native
Geographical mobility - Moved within same county (%) - Multirace
Geographical mobility - Moved within same county (%) - Other Race
Geographical mobility - Moved from different county within same state (%)
Geographical mobility - Moved from different county within same state (%) - White
Geographical mobility - Moved from different county within same state (%) - Black or African American
Geographical mobility - Moved from different county within same state (%) - Asian
Geographical mobility - Moved from different county within same state (%) - Hispanic or Latino
Geographical mobility - Moved from different county within same state (%) - American Indian and Alaska Native
Geographical mobility - Moved from different county within same state (%) - Multirace
Geographical mobility - Moved from different county within same state (%) - Other Race
Geographical mobility - Moved from different state (%)
Geographical mobility - Moved from different state (%) - White
Geographical mobility - Moved from different state (%) - Black or African American
Geographical mobility - Moved from different state (%) - Asian
Geographical mobility - Moved from different state (%) - Hispanic or Latino
Geographical mobility - Moved from different state (%) - American Indian and Alaska Native
Geographical mobility - Moved from different state (%) - Multirace
Geographical mobility - Moved from different state (%) - Other Race
Geographical mobility - Moved from abroad (%)
Geographical mobility - Moved from abroad (%) - White
Geographical mobility - Moved from abroad (%) - Black or African American
Geographical mobility - Moved from abroad (%) - Asian
Geographical mobility - Moved from abroad (%) - Hispanic or Latino
Geographical mobility - Moved from abroad (%) - American Indian and Alaska Native
Geographical mobility - Moved from abroad (%) - Multirace
Geographical mobility - Moved from abroad (%) - Other Race
Place of birth for the foreign-born population - Ireland (%)
Place of birth for the foreign-born population - Denmark (%)
Place of birth for the foreign-born population - Norway (%)
Place of birth for the foreign-born population - Sweden (%)
Place of birth for the foreign-born population - United Kingdom (%)
Place of birth for the foreign-born population - England (%)
Place of birth for the foreign-born population - Scotland (%)
Place of birth for the foreign-born population - Other Northern Europe (%)
Place of birth for the foreign-born population - Austria (%)
Place of birth for the foreign-born population - Belgium (%)
Place of birth for the foreign-born population - France (%)
Place of birth for the foreign-born population - Germany (%)
Place of birth for the foreign-born population - Netherlands (%)
Place of birth for the foreign-born population - Switzerland (%)
Place of birth for the foreign-born population - Other Western Europe (%)
Place of birth for the foreign-born population - Greece (%)
Place of birth for the foreign-born population - Italy (%)
Place of birth for the foreign-born population - Portugal (%)
Place of birth for the foreign-born population - Spain (%)
Place of birth for the foreign-born population - Other Southern Europe (%)
Place of birth for the foreign-born population - Albania (%)
Place of birth for the foreign-born population - Belarus (%)
Place of birth for the foreign-born population - Bosnia and Herzegovina (%)
Place of birth for the foreign-born population - Bulgaria (%)
Place of birth for the foreign-born population - Croatia (%)
Place of birth for the foreign-born population - Czechoslovakia (%)
Place of birth for the foreign-born population - Hungary (%)
Place of birth for the foreign-born population - Latvia (%)
Place of birth for the foreign-born population - Lithuania (%)
Place of birth for the foreign-born population - North Macedonia (Macedonia) (%)
Place of birth for the foreign-born population - Moldova (%)
Place of birth for the foreign-born population - Poland (%)
Place of birth for the foreign-born population - Romania (%)
Place of birth for the foreign-born population - Russia (%)
Place of birth for the foreign-born population - Serbia (%)
Place of birth for the foreign-born population - Ukraine (%)
Place of birth for the foreign-born population - Other Eastern Europe (%)
Place of birth for the foreign-born population - China (%)
Place of birth for the foreign-born population - Hong Kong (%)
Place of birth for the foreign-born population - Taiwan (%)
Place of birth for the foreign-born population - Japan (%)
Place of birth for the foreign-born population - Korea (%)
Place of birth for the foreign-born population - Other Eastern Asia (%)
Place of birth for the foreign-born population - Afghanistan (%)
Place of birth for the foreign-born population - Bangladesh (%)
Place of birth for the foreign-born population - India (%)
Place of birth for the foreign-born population - Iran (%)
Place of birth for the foreign-born population - Kazakhstan (%)
Place of birth for the foreign-born population - Nepal (%)
Place of birth for the foreign-born population - Pakistan (%)
Place of birth for the foreign-born population - Sri Lanka (%)
Place of birth for the foreign-born population - Uzbekistan (%)
Place of birth for the foreign-born population - Other South Central Asia (%)
Place of birth for the foreign-born population - Burma (%)
Place of birth for the foreign-born population - Cambodia (%)
Place of birth for the foreign-born population - Indonesia (%)
Place of birth for the foreign-born population - Laos (%)
Place of birth for the foreign-born population - Malaysia (%)
Place of birth for the foreign-born population - Philippines (%)
Place of birth for the foreign-born population - Singapore (%)
Place of birth for the foreign-born population - Thailand (%)
Place of birth for the foreign-born population - Vietnam (%)
Place of birth for the foreign-born population - Other South Eastern Asia (%)
Place of birth for the foreign-born population - Armenia (%)
Place of birth for the foreign-born population - Iraq (%)
Place of birth for the foreign-born population - Israel (%)
Place of birth for the foreign-born population - Jordan (%)
Place of birth for the foreign-born population - Kuwait (%)
Place of birth for the foreign-born population - Lebanon (%)
Place of birth for the foreign-born population - Saudi Arabia (%)
Place of birth for the foreign-born population - Syria (%)
Place of birth for the foreign-born population - Turkey (%)
Place of birth for the foreign-born population - Yemen (%)
Place of birth for the foreign-born population - Other Western Asia (%)
Place of birth for the foreign-born population - Eritrea (%)
Place of birth for the foreign-born population - Ethiopia (%)
Place of birth for the foreign-born population - Kenya (%)
Place of birth for the foreign-born population - Somalia (%)
Place of birth for the foreign-born population - Uganda (%)
Place of birth for the foreign-born population - Zimbabwe (%)
Place of birth for the foreign-born population - Other Eastern Africa (%)
Place of birth for the foreign-born population - Cameroon (%)
Place of birth for the foreign-born population - Congo (%)
Place of birth for the foreign-born population - Democratic Republic of Congo (Zaire) (%)
Place of birth for the foreign-born population - Other Middle Africa (%)
Place of birth for the foreign-born population - Egypt (%)
Place of birth for the foreign-born population - Morocco (%)
Place of birth for the foreign-born population - Sudan (%)
Place of birth for the foreign-born population - Other Northern Africa (%)
Place of birth for the foreign-born population - South Africa (%)
Place of birth for the foreign-born population - Other Southern Africa (%)
Place of birth for the foreign-born population - Cabo Verde (%)
Place of birth for the foreign-born population - Ghana (%)
Place of birth for the foreign-born population - Liberia (%)
Place of birth for the foreign-born population - Nigeria (%)
Place of birth for the foreign-born population - Senegal (%)
Place of birth for the foreign-born population - Sierra Leone (%)
Place of birth for the foreign-born population - Other Western Africa (%)
Place of birth for the foreign-born population - Australia (%)
Place of birth for the foreign-born population - New Zealand (%)
Place of birth for the foreign-born population - Fiji (%)
Place of birth for the foreign-born population - Micronesia (%)
Place of birth for the foreign-born population - Bahamas (%)
Place of birth for the foreign-born population - Barbados (%)
Place of birth for the foreign-born population - Cuba (%)
Place of birth for the foreign-born population - Dominica (%)
Place of birth for the foreign-born population - Dominican Republic (%)
Place of birth for the foreign-born population - Grenada (%)
Place of birth for the foreign-born population - Haiti (%)
Place of birth for the foreign-born population - Jamaica (%)
Place of birth for the foreign-born population - St. Vincent and the Grenadines (%)
Place of birth for the foreign-born population - Trinidad and Tobago (%)
Place of birth for the foreign-born population - West Indies (%)
Place of birth for the foreign-born population - Other Caribbean (%)
Place of birth for the foreign-born population - Belize (%)
Place of birth for the foreign-born population - Costa Rica (%)
Place of birth for the foreign-born population - El Salvador (%)
Place of birth for the foreign-born population - Guatemala (%)
Place of birth for the foreign-born population - Honduras (%)
Place of birth for the foreign-born population - Mexico (%)
Place of birth for the foreign-born population - Nicaragua (%)
Place of birth for the foreign-born population - Panama (%)
Place of birth for the foreign-born population - Other Central America (%)
Place of birth for the foreign-born population - Argentina (%)
Place of birth for the foreign-born population - Bolivia (%)
Place of birth for the foreign-born population - Brazil (%)
Place of birth for the foreign-born population - Chile (%)
Place of birth for the foreign-born population - Colombia (%)
Place of birth for the foreign-born population - Ecuador (%)
Place of birth for the foreign-born population - Guyana (%)
Place of birth for the foreign-born population - Peru (%)
Place of birth for the foreign-born population - Uruguay (%)
Place of birth for the foreign-born population - Venezuela (%)
Place of birth for the foreign-born population - Other South America (%)
Place of birth for the foreign-born population - Canada (%)
Place of birth for the foreign-born population - Other Northern America (%)
Place of birth for the foreign-born population - Other (%)
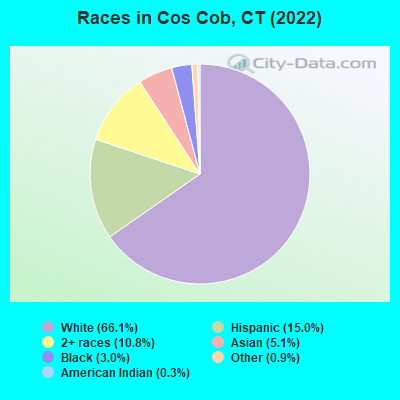
According to 2022 data, the most numerous races in Cos Cob, CT are White alone (4,808 residents), Hispanic (1,090 residents), and Black alone (216 residents). 74.2% of Cos Cob residents speak English at home.
Race distribution in Cos Cob 4,808 66.1% White alone 1,090 15.0% Hispanic 788 10.8% Two or more races 370 5.1% Asian alone 216 3.0% Black alone 66 0.9% Other race alone 23 0.3% American Indian alone
2000 2022
2,638,845 77.5% White alone 320,323 9.4% Hispanic 295,571 8.7% Black alone 81,564 2.4% Asian alone 52,896 1.6% Two or more races 8,141 0.2% Other race alone 7,267 0.2% American Indian alone 958 0.03% Native Hawaiian and Other
2,246,913 62.0% White alone 658,978 18.2% Hispanic 353,973 9.8% Black alone 172,929 4.8% Asian alone 159,631 4.4% Two or more races 29,761 0.8% Other race alone 3,428 0.09% American Indian alone 592 0.02% Native Hawaiian and Other
Income and house value in Cos Cob Median household income in 2022 $191,261 White non-Hispanic householdersover $200,000 Hispanic or Latino race householders
Median age by race in Cos Cob
43.1 Median age for White residents45.6 42.7 38.6 Median age for Black or African American residents-684,738,955.1 38.3 33.6 Median age for American Indian / Alaska Native residents-701,030,927.1 -704,477,611.2 45.8 Median age for Asian residents38.6 47.1 -641,269,840.6 Median age for Native Hawaiian / Pacific Islander residents-414,239,481.8 -691,588,784.4 14.2 Median age for Other race residents5.4 38.0 34.0 Median age for Two or more races residents51.8 19.2 42.5 Median age for White alone residents44.3 42.3 19.6 Median age for Hispanic or Latino residents13.4 37.2
Owner/renter occupied households by race in Cos Cob
House owners and renters - White residents 1,438 72.1% Owner occupied555 27.9% Renter occupiedHouse owners and renters - Black or African American residents 42 100.0% Renter occupiedHouse owners and renters - American Indian / Alaska Native residents 6 37.5% Owner occupied9 62.5% Renter occupiedHouse owners and renters - Asian residents 96 76.6% Owner occupied29 23.4% Renter occupiedHouse owners and renters - Other race residents 39 46.3% Owner occupied45 53.7% Renter occupiedHouse owners and renters - Two or more races residents 124 34.7% Owner occupied234 65.3% Renter occupiedHouse owners and renters - White alone residents 1,348 70.4% Owner occupied567 29.6% Renter occupiedHouse owners and renters - Hispanic or Latino residents 190 65.8% Owner occupied99 34.2% Renter occupied
Language usage in Cos Cob
English speakers - Total 74.2% of residents of Cos Cob speak English at home.
6.8% of residents speak Spanish at home 328 71.6% Speak English very well130 28.4% Speak English less than very well18.8% of residents speak other language at home 822 65.3% Speak English very well436 34.7% Speak English less than very well
English speakers - Born in the United States 88.1% of residents of Cos Cob speak English at home.
4.4% of residents speak Spanish at home 116 100.0% Speak English very well7.2% of residents speak other language at home 193 100.0% Speak English very well
English speakers - Native, born elsewhere 82.6% of residents of Cos Cob speak English at home.
4.3% of residents speak Spanish at home 1 100.0% Speak English very well21.7% of residents speak other language at home 5 100.0% Speak English very well
English speakers - Foreign-born 36.4% of residents of Cos Cob speak English at home.
14.1% of residents speak Spanish at home 143 52.4% Speak English very well130 47.6% Speak English less than very well48.8% of residents speak other language at home 517 54.9% Speak English very well425 45.1% Speak English less than very well
White (Caucasian) - Speak only English Native:
93.3% (3,658)Foreign-born:
61.0% (392)
White (Caucasian) - Speak another language Native:
6.4% (252)Foreign-born:
44.4% (285)
Black or African American - Speak only English Native:
99.1% (120)Foreign-born:
100.0% (101)
Asian - Speak only English Native:
22.9% (17)Foreign-born:
10.0% (28)
Asian - Speak another language Native:
75.4% (57)Foreign-born:
90.3% (252)
Other race - Speak only English Native:
88.7% (263)Foreign-born:
22.6% (34)
Other race - Speak another language Native:
18.4% (54)Foreign-born:
74.3% (113)
Two or more races - Speak only English Native:
78.1% (256)Foreign-born:
9.6% (86)
Two or more races - Speak another language Native:
19.1% (63)Foreign-born:
90.2% (807)
White alone - Speak only English Native:
92.0% (3,485)Foreign-born:
59.7% (406)
White alone - Speak another language Native:
8.1% (306)Foreign-born:
41.1% (280)
Hispanic or Latino - Speak only English Native:
84.8% (511)Foreign-born:
4.7% (13)
Hispanic or Latino - Speak another language Native:
18.3% (111)Foreign-born:
95.5% (271)
Foreign-born residents in Cos Cob
Marital status for residents in Cos Cob Marital status - White (Caucasian) population 15 years and over
Males 27.9% Never married64.6% Now married0.0% Separated0.0% Widowed7.5% DivorcedFemales 29.6% Never married56.1% Now married1.2% Separated5.2% Widowed7.9% DivorcedWomen who gave birth in the past 12 months Now married:
94.4% (93)Unmarried:
5.6% (6)
Women who did not give birth in the past 12 months Now married:
39.7% (418)Unmarried:
60.3% (633)
Marital status - Black or African American population 15 years and over
Males 40.0% Never married60.0% Now married0.0% Separated0.0% Widowed0.0% DivorcedFemales 36.3% Never married36.3% Now married0.0% Separated0.0% Widowed27.4% DivorcedWomen who did not give birth in the past 12 months Now married:
50.0% (60)Unmarried:
50.0% (60)
Marital status - American Indian / Alaska Native population 15 years and over
Males 100.0% Never married0.0% Now married0.0% Separated0.0% Widowed0.0% DivorcedFemales 0.0% Never married0.0% Now married0.0% Separated0.0% Widowed100.0% DivorcedMarital status - Asian population 15 years and over
Males 12.4% Never married87.6% Now married0.0% Separated0.0% Widowed0.0% DivorcedFemales 3.4% Never married96.6% Now married0.0% Separated0.0% Widowed0.0% DivorcedWomen who gave birth in the past 12 months Now married:
100.0% (22)Unmarried:
0.0% (0)
Women who did not give birth in the past 12 months Now married:
92.6% (74)Unmarried:
7.4% (6)
Marital status - Other race population 15 years and over
Males 57.9% Never married42.1% Now married0.0% Separated0.0% Widowed0.0% DivorcedFemales 28.2% Never married71.8% Now married0.0% Separated0.0% Widowed0.0% DivorcedWomen who gave birth in the past 12 months Now married:
77.9% (108)Unmarried:
22.1% (31)
Women who did not give birth in the past 12 months Now married:
36.4% (15)Unmarried:
63.6% (26)
Marital status - Two or more races population 15 years and over
Males 12.3% Never married87.7% Now married0.0% Separated0.0% Widowed0.0% DivorcedFemales 38.2% Never married51.3% Now married0.0% Separated0.0% Widowed10.5% DivorcedWomen who did not give birth in the past 12 months Now married:
45.7% (153)Unmarried:
54.3% (182)
Marital status - White alone, not Hispanic / Latino population 15 years and over
Males 28.5% Never married63.9% Now married0.0% Separated0.0% Widowed7.6% DivorcedFemales 27.6% Never married56.2% Now married1.3% Separated5.9% Widowed9.0% DivorcedWomen who gave birth in the past 12 months Now married:
94.4% (98)Unmarried:
5.6% (6)
Women who did not give birth in the past 12 months Now married:
42.3% (406)Unmarried:
57.7% (555)
Marital status - Hispanic or Latino population 15 years and over
Males 43.4% Never married56.6% Now married0.0% Separated0.0% Widowed0.0% DivorcedFemales 38.2% Never married55.8% Now married0.0% Separated0.0% Widowed6.0% DivorcedWomen who gave birth in the past 12 months Now married:
77.9% (92)Unmarried:
22.1% (26)
Women who did not give birth in the past 12 months Now married:
20.9% (48)Unmarried:
79.1% (183)
Ancestries in Cos Cob
650 18.6% Italian306 8.8% English233 6.7% American167 4.8% Irish132 3.8% Brazilian100 2.9% Jamaican98 2.8% German95 2.7% Polish84 2.4% Croatian84 2.4% European50 1.4% Portuguese33 0.9% Turkish32 0.9% Eastern European30 0.9% Serbian27 0.8% Swedish26 0.7% Greek23 0.7% Lithuanian18 0.5% Canadian18 0.5% Swiss15 0.4% Hungarian14 0.4% Norwegian11 0.3% Slovak9 0.3% French7 0.2% Austrian5 0.1% Albanian2 0.06% British1 0.03% Celtic1 0.03% Macedonian
Children Nativity (place of birth) in Cos Cob
Children under 6 years - Living with two parents Both parents native 439 100.0% NativeBoth parents foreign-born 74 100.0% NativeOne native, one foreign-born parent 64 100.0% NativeChildren under 6 years - Living with one parent Native parent 36 100.0% NativeForeign-born parent 96 100.0% NativeChildren 6 to 17 years - Living with two parents Both parents native 418 100.0% NativeBoth parents foreign-born 101 27.3% Native269 72.7% Foreign-bornOne native, one foreign-born parent 222 100.0% NativeChildren 6 to 17 years - Living with one parent Native parent 113 100.0% NativeForeign-born parent 174 50.8% Native169 49.2% Foreign-born