Races in Corrales, New Mexico (NM) Detailed Stats Ancestries, Foreign-born residents, place of birth
Data:
Races - White alone (%)
Races - White alone (% change since 2000)
Races - Black alone (%)
Races - Black alone (% change since 2000)
Races - American Indian alone (%)
Races - American Indian alone (% change since 2000)
Races - Asian alone (%)
Races - Asian alone (% change since 2000)
Races - Hispanic (%)
Races - Hispanic (% change since 2000)
Races - Native Hawaiian and Other Pacific Islander alone (%)
Races - Native Hawaiian and Other Pacific Islander alone (% change since 2000)
Races - Two or more races(%)
Races - Two or more races(% change since 2000)
Races - Other race alone (%)
Races - Other race alone (% change since 2000)
Racial diversity
Place of birth - Born in state of residence (%)
Place of birth - Born in state of residence (%) - White
Place of birth - Born in state of residence (%) - Black or African American
Place of birth - Born in state of residence (%) - Asian
Place of birth - Born in state of residence (%) - Hispanic or Latino
Place of birth - Born in state of residence (%) - American Indian and Alaska Native
Place of birth - Born in state of residence (%) - Multirace
Place of birth - Born in state of residence (%) - Other Race
Place of birth - Born in other state (%)
Place of birth - Born in other state (%) - White
Place of birth - Born in other state (%) - Black or African American
Place of birth - Born in other state (%) - Asian
Place of birth - Born in other state (%) - Hispanic or Latino
Place of birth - Born in other state (%) - American Indian and Alaska Native
Place of birth - Born in other state (%) - Multirace
Place of birth - Born in other state (%) - Other Race
Place of birth - Native, outside of US (%)
Place of birth - Native, outside of US (%) - White
Place of birth - Native, outside of US (%) - Black or African American
Place of birth - Native, outside of US (%) - Asian
Place of birth - Native, outside of US (%) - Hispanic or Latino
Place of birth - Native, outside of US (%) - American Indian and Alaska Native
Place of birth - Native, outside of US (%) - Multirace
Place of birth - Native, outside of US (%) - Other Race
Place of birth - Foreign born (%)
Place of birth - Foreign born (%) - White
Place of birth - Foreign born (%) - Black or African American
Place of birth - Foreign born (%) - Asian
Place of birth - Foreign born (%) - Hispanic or Latino
Place of birth - Foreign born (%) - American Indian and Alaska Native
Place of birth - Foreign born (%) - Multirace
Place of birth - Foreign born (%) - Other Race
Residents speaking English at home (%)
Residents speaking English at home - Born in the United States (%)
Residents speaking English at home - Native, born elsewhere (%)
Residents speaking English at home - Foreign born (%)
Residents speaking Spanish at home (%)
Residents speaking Spanish at home - Born in the United States (%)
Residents speaking Spanish at home - Native, born elsewhere (%)
Residents speaking Spanish at home - Foreign born (%)
Residents speaking other language at home (%)
Residents speaking other language at home - Born in the United States (%)
Residents speaking other language at home - Native, born elsewhere (%)
Residents speaking other language at home - Foreign born (%)
Marital status - Never married (%)
Marital status - Now married (%)
Marital status - Separated (%)
Marital status - Widowed (%)
Marital status - Divorced (%)
Ancestries Reported - Arab (%)
Ancestries Reported - Czech (%)
Ancestries Reported - Danish (%)
Ancestries Reported - Dutch (%)
Ancestries Reported - English (%)
Ancestries Reported - French (%)
Ancestries Reported - French Canadian (%)
Ancestries Reported - German (%)
Ancestries Reported - Greek (%)
Ancestries Reported - Hungarian (%)
Ancestries Reported - Irish (%)
Ancestries Reported - Italian (%)
Ancestries Reported - Lithuanian (%)
Ancestries Reported - Norwegian (%)
Ancestries Reported - Polish (%)
Ancestries Reported - Portuguese (%)
Ancestries Reported - Russian (%)
Ancestries Reported - Scotch-Irish (%)
Ancestries Reported - Scottish (%)
Ancestries Reported - Slovak (%)
Ancestries Reported - Subsaharan African (%)
Ancestries Reported - Swedish (%)
Ancestries Reported - Swiss (%)
Ancestries Reported - Ukrainian (%)
Ancestries Reported - United States (%)
Ancestries Reported - Welsh (%)
Ancestries Reported - West Indian (%)
Ancestries Reported - Other (%)
Geographical mobility - Same house 1 year ago (%)
Geographical mobility - Same house 1 year ago (%) - White
Geographical mobility - Same house 1 year ago (%) - Black or African American
Geographical mobility - Same house 1 year ago (%) - Asian
Geographical mobility - Same house 1 year ago (%) - Hispanic or Latino
Geographical mobility - Same house 1 year ago (%) - American Indian and Alaska Native
Geographical mobility - Same house 1 year ago (%) - Multirace
Geographical mobility - Same house 1 year ago (%) - Other Race
Geographical mobility - Moved within same county (%)
Geographical mobility - Moved within same county (%) - White
Geographical mobility - Moved within same county (%) - Black or African American
Geographical mobility - Moved within same county (%) - Asian
Geographical mobility - Moved within same county (%) - Hispanic or Latino
Geographical mobility - Moved within same county (%) - American Indian and Alaska Native
Geographical mobility - Moved within same county (%) - Multirace
Geographical mobility - Moved within same county (%) - Other Race
Geographical mobility - Moved from different county within same state (%)
Geographical mobility - Moved from different county within same state (%) - White
Geographical mobility - Moved from different county within same state (%) - Black or African American
Geographical mobility - Moved from different county within same state (%) - Asian
Geographical mobility - Moved from different county within same state (%) - Hispanic or Latino
Geographical mobility - Moved from different county within same state (%) - American Indian and Alaska Native
Geographical mobility - Moved from different county within same state (%) - Multirace
Geographical mobility - Moved from different county within same state (%) - Other Race
Geographical mobility - Moved from different state (%)
Geographical mobility - Moved from different state (%) - White
Geographical mobility - Moved from different state (%) - Black or African American
Geographical mobility - Moved from different state (%) - Asian
Geographical mobility - Moved from different state (%) - Hispanic or Latino
Geographical mobility - Moved from different state (%) - American Indian and Alaska Native
Geographical mobility - Moved from different state (%) - Multirace
Geographical mobility - Moved from different state (%) - Other Race
Geographical mobility - Moved from abroad (%)
Geographical mobility - Moved from abroad (%) - White
Geographical mobility - Moved from abroad (%) - Black or African American
Geographical mobility - Moved from abroad (%) - Asian
Geographical mobility - Moved from abroad (%) - Hispanic or Latino
Geographical mobility - Moved from abroad (%) - American Indian and Alaska Native
Geographical mobility - Moved from abroad (%) - Multirace
Geographical mobility - Moved from abroad (%) - Other Race
Place of birth for the foreign-born population - Ireland (%)
Place of birth for the foreign-born population - Denmark (%)
Place of birth for the foreign-born population - Norway (%)
Place of birth for the foreign-born population - Sweden (%)
Place of birth for the foreign-born population - United Kingdom (%)
Place of birth for the foreign-born population - England (%)
Place of birth for the foreign-born population - Scotland (%)
Place of birth for the foreign-born population - Other Northern Europe (%)
Place of birth for the foreign-born population - Austria (%)
Place of birth for the foreign-born population - Belgium (%)
Place of birth for the foreign-born population - France (%)
Place of birth for the foreign-born population - Germany (%)
Place of birth for the foreign-born population - Netherlands (%)
Place of birth for the foreign-born population - Switzerland (%)
Place of birth for the foreign-born population - Other Western Europe (%)
Place of birth for the foreign-born population - Greece (%)
Place of birth for the foreign-born population - Italy (%)
Place of birth for the foreign-born population - Portugal (%)
Place of birth for the foreign-born population - Spain (%)
Place of birth for the foreign-born population - Other Southern Europe (%)
Place of birth for the foreign-born population - Albania (%)
Place of birth for the foreign-born population - Belarus (%)
Place of birth for the foreign-born population - Bosnia and Herzegovina (%)
Place of birth for the foreign-born population - Bulgaria (%)
Place of birth for the foreign-born population - Croatia (%)
Place of birth for the foreign-born population - Czechoslovakia (%)
Place of birth for the foreign-born population - Hungary (%)
Place of birth for the foreign-born population - Latvia (%)
Place of birth for the foreign-born population - Lithuania (%)
Place of birth for the foreign-born population - North Macedonia (Macedonia) (%)
Place of birth for the foreign-born population - Moldova (%)
Place of birth for the foreign-born population - Poland (%)
Place of birth for the foreign-born population - Romania (%)
Place of birth for the foreign-born population - Russia (%)
Place of birth for the foreign-born population - Serbia (%)
Place of birth for the foreign-born population - Ukraine (%)
Place of birth for the foreign-born population - Other Eastern Europe (%)
Place of birth for the foreign-born population - China (%)
Place of birth for the foreign-born population - Hong Kong (%)
Place of birth for the foreign-born population - Taiwan (%)
Place of birth for the foreign-born population - Japan (%)
Place of birth for the foreign-born population - Korea (%)
Place of birth for the foreign-born population - Other Eastern Asia (%)
Place of birth for the foreign-born population - Afghanistan (%)
Place of birth for the foreign-born population - Bangladesh (%)
Place of birth for the foreign-born population - India (%)
Place of birth for the foreign-born population - Iran (%)
Place of birth for the foreign-born population - Kazakhstan (%)
Place of birth for the foreign-born population - Nepal (%)
Place of birth for the foreign-born population - Pakistan (%)
Place of birth for the foreign-born population - Sri Lanka (%)
Place of birth for the foreign-born population - Uzbekistan (%)
Place of birth for the foreign-born population - Other South Central Asia (%)
Place of birth for the foreign-born population - Burma (%)
Place of birth for the foreign-born population - Cambodia (%)
Place of birth for the foreign-born population - Indonesia (%)
Place of birth for the foreign-born population - Laos (%)
Place of birth for the foreign-born population - Malaysia (%)
Place of birth for the foreign-born population - Philippines (%)
Place of birth for the foreign-born population - Singapore (%)
Place of birth for the foreign-born population - Thailand (%)
Place of birth for the foreign-born population - Vietnam (%)
Place of birth for the foreign-born population - Other South Eastern Asia (%)
Place of birth for the foreign-born population - Armenia (%)
Place of birth for the foreign-born population - Iraq (%)
Place of birth for the foreign-born population - Israel (%)
Place of birth for the foreign-born population - Jordan (%)
Place of birth for the foreign-born population - Kuwait (%)
Place of birth for the foreign-born population - Lebanon (%)
Place of birth for the foreign-born population - Saudi Arabia (%)
Place of birth for the foreign-born population - Syria (%)
Place of birth for the foreign-born population - Turkey (%)
Place of birth for the foreign-born population - Yemen (%)
Place of birth for the foreign-born population - Other Western Asia (%)
Place of birth for the foreign-born population - Eritrea (%)
Place of birth for the foreign-born population - Ethiopia (%)
Place of birth for the foreign-born population - Kenya (%)
Place of birth for the foreign-born population - Somalia (%)
Place of birth for the foreign-born population - Uganda (%)
Place of birth for the foreign-born population - Zimbabwe (%)
Place of birth for the foreign-born population - Other Eastern Africa (%)
Place of birth for the foreign-born population - Cameroon (%)
Place of birth for the foreign-born population - Congo (%)
Place of birth for the foreign-born population - Democratic Republic of Congo (Zaire) (%)
Place of birth for the foreign-born population - Other Middle Africa (%)
Place of birth for the foreign-born population - Egypt (%)
Place of birth for the foreign-born population - Morocco (%)
Place of birth for the foreign-born population - Sudan (%)
Place of birth for the foreign-born population - Other Northern Africa (%)
Place of birth for the foreign-born population - South Africa (%)
Place of birth for the foreign-born population - Other Southern Africa (%)
Place of birth for the foreign-born population - Cabo Verde (%)
Place of birth for the foreign-born population - Ghana (%)
Place of birth for the foreign-born population - Liberia (%)
Place of birth for the foreign-born population - Nigeria (%)
Place of birth for the foreign-born population - Senegal (%)
Place of birth for the foreign-born population - Sierra Leone (%)
Place of birth for the foreign-born population - Other Western Africa (%)
Place of birth for the foreign-born population - Australia (%)
Place of birth for the foreign-born population - New Zealand (%)
Place of birth for the foreign-born population - Fiji (%)
Place of birth for the foreign-born population - Micronesia (%)
Place of birth for the foreign-born population - Bahamas (%)
Place of birth for the foreign-born population - Barbados (%)
Place of birth for the foreign-born population - Cuba (%)
Place of birth for the foreign-born population - Dominica (%)
Place of birth for the foreign-born population - Dominican Republic (%)
Place of birth for the foreign-born population - Grenada (%)
Place of birth for the foreign-born population - Haiti (%)
Place of birth for the foreign-born population - Jamaica (%)
Place of birth for the foreign-born population - St. Vincent and the Grenadines (%)
Place of birth for the foreign-born population - Trinidad and Tobago (%)
Place of birth for the foreign-born population - West Indies (%)
Place of birth for the foreign-born population - Other Caribbean (%)
Place of birth for the foreign-born population - Belize (%)
Place of birth for the foreign-born population - Costa Rica (%)
Place of birth for the foreign-born population - El Salvador (%)
Place of birth for the foreign-born population - Guatemala (%)
Place of birth for the foreign-born population - Honduras (%)
Place of birth for the foreign-born population - Mexico (%)
Place of birth for the foreign-born population - Nicaragua (%)
Place of birth for the foreign-born population - Panama (%)
Place of birth for the foreign-born population - Other Central America (%)
Place of birth for the foreign-born population - Argentina (%)
Place of birth for the foreign-born population - Bolivia (%)
Place of birth for the foreign-born population - Brazil (%)
Place of birth for the foreign-born population - Chile (%)
Place of birth for the foreign-born population - Colombia (%)
Place of birth for the foreign-born population - Ecuador (%)
Place of birth for the foreign-born population - Guyana (%)
Place of birth for the foreign-born population - Peru (%)
Place of birth for the foreign-born population - Uruguay (%)
Place of birth for the foreign-born population - Venezuela (%)
Place of birth for the foreign-born population - Other South America (%)
Place of birth for the foreign-born population - Canada (%)
Place of birth for the foreign-born population - Other Northern America (%)
Place of birth for the foreign-born population - Other (%)
Latest news about races in Corrales, NM collected exclusively by city-data.com from local newspapers, TV, and radio stations
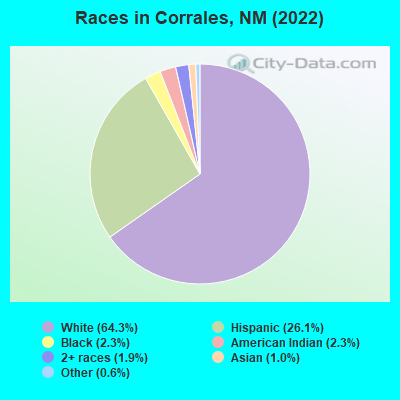
According to 2022 data, the most numerous races in Corrales, NM are Hispanic (2,281 residents), White alone (5,608 residents), and American Indian alone (203 residents). 90.5% of Corrales residents speak English at home. 7.0% of Corrales, NM residents are foreign-born (4.4% born in Latin America, 1.1% born in Asia, 0.8% born in Europe), which is 28.9% less than the foreign-born rate of 9.0% across the entire state of New Mexico.
Race distribution in Corrales
2000
2022
813,495 44.7% White alone
765,386 42.1% Hispanic
161,460 8.9% American Indian alone
30,654 1.7% Black alone
25,793 1.4% Two or more races
18,257 1.0% Asian alone
3,009 0.2% Other race alone
992 0.05% Native Hawaiian and Other Pacific Islander alone
1,059,867 50.2% Hispanic
735,478 34.8% White alone
171,808 8.1% American Indian alone
65,084 3.1% Two or more races
36,870 1.7% Black alone
35,870 1.7% Asian alone
7,582 0.4% Other race alone
785 0.04% Native Hawaiian and Other Pacific Islander alone
Income and house value in Corrales Median household income in 2022 $116,668 White non-Hispanic householders
$102,004 Black householders
$157,072 American Indian and Alaska Native householders
$113,416 Two or more races householders
$77,424 Hispanic or Latino race householders
Median 2022 house value $638,920 White Non-Hispanic householders
over $1,000,000 Black or African American householders
$304,566 American Indian or Alaska Native householders
$416,556 Some other race householders
$490,677 Two or more races householders
$418,634 Hispanic or Latino householders
Median age by race in Corrales
59.2 Median age for White residents59.7 Males59.3 Females59.2 Median age for Black or African American residents65.0 Males43.6 Females48.0 Median age for American Indian / Alaska Native residents47.6 Males43.0 Females16.6 Median age for Asian residents26.5 Males18.5 Females-679,089,026.2 Median age for Native Hawaiian / Pacific Islander residents-685,897,435.2 Males-659,380,691.5 Females71.1 Median age for Other race residents61.2 Males77.5 Females51.8 Median age for Two or more races residents24.4 Males50.4 Females60.5 Median age for White alone residents60.2 Males60.6 Females48.7 Median age for Hispanic or Latino residents47.6 Males48.3 Females
Owner/renter occupied households by race in Corrales
House owners and renters - White residents 2,634 93.9% Owner occupied170 6.1% Renter occupiedHouse owners and renters - Black or African American residents 57 84.9% Owner occupied10 15.1% Renter occupiedHouse owners and renters - American Indian / Alaska Native residents 105 100.0% Owner occupiedHouse owners and renters - Other race residents 151 100.0% Owner occupiedHouse owners and renters - Two or more races residents 430 77.3% Owner occupied126 22.7% Renter occupiedHouse owners and renters - White alone residents 2,675 93.9% Owner occupied173 6.1% Renter occupiedHouse owners and renters - Hispanic or Latino residents 622 89.8% Owner occupied71 10.2% Renter occupied
Language usage in Corrales
English speakers - Total 90.5% of residents of Corrales speak English at home.
9.9% of residents speak Spanish at home 678 80.9% Speak English very well160 19.1% Speak English less than very well2.8% of residents speak other language at home 205 86.9% Speak English very well31 13.1% Speak English less than very well
English speakers - Born in the United States 95.0% of residents of Corrales speak English at home.
3.5% of residents speak Spanish at home 130 91.5% Speak English very well12 8.5% Speak English less than very well1.8% of residents speak other language at home 72 100.0% Speak English very well
All residents speak only English at home
English speakers - Foreign-born 66.7% of residents of Corrales speak English at home.
35.5% of residents speak Spanish at home 90 34.4% Speak English very well172 65.6% Speak English less than very well12.2% of residents speak other language at home 77 85.6% Speak English very well13 14.4% Speak English less than very well
White (Caucasian) - Speak only English Native:
95.9% (5,204)Foreign-born:
100.0% (184)
White (Caucasian) - Speak another language Native:
5.2% (280)Foreign-born:
23.8% (44)
Black or African American - Speak only English Native:
59.7% (98)Foreign-born:
100.0% (9)
Asian - Speak only English Native:
100.0% (74)Foreign-born:
55.2% (24)
Other race - Speak another language Native:
20.3% (63)Foreign-born:
89.9% (18)
Two or more races - Speak only English Native:
77.1% (959)Foreign-born:
30.5% (160)
Two or more races - Speak another language Native:
22.8% (284)Foreign-born:
51.7% (272)
White alone - Speak only English Native:
95.3% (5,084)Foreign-born:
83.2% (182)
White alone - Speak another language Native:
5.1% (270)Foreign-born:
19.1% (42)
Hispanic or Latino - Speak only English Native:
73.6% (1,309)Foreign-born:
62.5% (297)
Hispanic or Latino - Speak another language Native:
25.2% (449)Foreign-born:
55.2% (262)
Foreign-born residents in Corrales 609 residents are foreign born (4.4% Latin America , 1.1% Asia , 0.8% Europe ).
This city:
7.0%New Mexico:
9.2%
Marital status for residents in Corrales Marital status - White (Caucasian) population 15 years and over
Males 12.6% Never married74.2% Now married0.0% Separated2.0% Widowed11.2% DivorcedFemales 11.5% Never married62.0% Now married0.7% Separated12.0% Widowed13.8% DivorcedWomen who gave birth in the past 12 months Now married:
38.1% (7)Unmarried:
61.9% (11)
Women who did not give birth in the past 12 months Now married:
56.1% (410)Unmarried:
43.9% (320)
Marital status - Black or African American population 15 years and over
Males 3.4% Never married55.6% Now married0.0% Separated0.0% Widowed41.0% DivorcedFemales 0.0% Never married20.5% Now married0.0% Separated0.0% Widowed79.5% DivorcedWomen who did not give birth in the past 12 months Now married:
100.0% (8)Unmarried:
0.0% (0)
Marital status - American Indian / Alaska Native population 15 years and over
Males 39.9% Never married40.5% Now married0.0% Separated0.0% Widowed19.6% DivorcedFemales 0.0% Never married100.0% Now married0.0% Separated0.0% Widowed0.0% DivorcedWomen who did not give birth in the past 12 months Now married:
100.0% (50)Unmarried:
0.0% (0)
Marital status - Asian population 15 years and over
Males 56.6% Never married43.4% Now married0.0% Separated0.0% Widowed0.0% DivorcedFemales 71.9% Never married28.1% Now married0.0% Separated0.0% Widowed0.0% DivorcedWomen who gave birth in the past 12 months Now married:
100.0% (7)Unmarried:
0.0% (0)
Women who did not give birth in the past 12 months Now married:
11.5% (4)Unmarried:
88.5% (28)
Marital status - Other race population 15 years and over
Males 31.2% Never married54.8% Now married0.0% Separated0.0% Widowed14.0% DivorcedFemales 0.0% Never married70.5% Now married0.0% Separated26.9% Widowed2.6% DivorcedMarital status - Two or more races population 15 years and over
Males 33.1% Never married63.9% Now married0.0% Separated0.0% Widowed3.0% DivorcedFemales 22.6% Never married56.9% Now married2.6% Separated2.3% Widowed15.6% DivorcedWomen who did not give birth in the past 12 months Now married:
36.7% (126)Unmarried:
63.3% (217)
Marital status - White alone, not Hispanic / Latino population 15 years and over
Males 11.0% Never married74.2% Now married0.0% Separated1.9% Widowed12.8% DivorcedFemales 11.3% Never married61.6% Now married0.8% Separated11.6% Widowed14.7% DivorcedWomen who gave birth in the past 12 months Now married:
38.1% (8)Unmarried:
61.9% (13)
Women who did not give birth in the past 12 months Now married:
54.4% (401)Unmarried:
45.6% (337)
Marital status - Hispanic or Latino population 15 years and over
Males 28.9% Never married66.8% Now married0.0% Separated1.3% Widowed3.0% DivorcedFemales 16.2% Never married62.3% Now married1.5% Separated8.8% Widowed11.2% DivorcedWomen who did not give birth in the past 12 months Now married:
49.7% (206)Unmarried:
50.3% (208)
Ancestries in Corrales
548 13.4% English
321 7.8% German
207 5.1% American
198 4.8% Irish
185 4.5% Italian
144 3.5% Norwegian
112 2.7% Canadian
71 1.7% European
48 1.2% British
44 1.1% French
42 1.0% Scottish
40 1.0% Greek
34 0.8% Northern European
24 0.6% Lebanese
23 0.6% Scandinavian
23 0.6% Scotch-Irish
20 0.5% Eastern European
18 0.4% Danish
16 0.4% Czech
16 0.4% Dutch
16 0.4% Polish
15 0.4% Slavic
15 0.4% Haitian
11 0.3% Lithuanian
7 0.2% Swiss
6 0.1% French Canadian
Children Nativity (place of birth) in Corrales
Children under 6 years - Living with two parents Both parents native 190 93.1% Native14 6.9% Foreign-bornBoth parents foreign-born 38 100.0% NativeChildren under 6 years - Living with one parent Native parent 25 100.0% NativeChildren 6 to 17 years - Living with two parents Both parents native 567 98.6% Native8 1.4% Foreign-bornBoth parents foreign-born 55 64.6% Native30 35.4% Foreign-bornOne native, one foreign-born parent 18 100.0% NativeChildren 6 to 17 years - Living with one parent Native parent 61 100.0% Native
Grandparents responsible for own grandchildren in Corrales
Grandparents (30 to 59 years) White / Caucasian 32 100.0% Responsible for grandchildrenTwo or more races 10 100.0% Not responsible for grandchildrenWhite alone, not Hispanic / Latino 18 100.0% Responsible for grandchildrenHispanic or Latino 16 52.4% Responsible for grandchildren15 47.6% Not responsible for grandchildrenGrandparents (60 years and over) White / Caucasian 7 17.5% Responsible for grandchildren31 82.5% Not responsible for grandchildrenTwo or more races 34 66.1% Responsible for grandchildren17 33.9% Not responsible for grandchildrenWhite alone, not Hispanic / Latino 8 21.3% Responsible for grandchildren31 78.7% Not responsible for grandchildrenHispanic or Latino 25 44.3% Responsible for grandchildren31 55.7% Not responsible for grandchildren