Races in Camp Springs, Maryland (MD) Detailed Stats
Data:
Races - White alone (%)
Races - White alone (% change since 2000)
Races - Black alone (%)
Races - Black alone (% change since 2000)
Races - American Indian alone (%)
Races - American Indian alone (% change since 2000)
Races - Asian alone (%)
Races - Asian alone (% change since 2000)
Races - Hispanic (%)
Races - Hispanic (% change since 2000)
Races - Native Hawaiian and Other Pacific Islander alone (%)
Races - Native Hawaiian and Other Pacific Islander alone (% change since 2000)
Races - Two or more races(%)
Races - Two or more races(% change since 2000)
Races - Other race alone (%)
Races - Other race alone (% change since 2000)
Racial diversity
Place of birth - Born in state of residence (%)
Place of birth - Born in state of residence (%) - White
Place of birth - Born in state of residence (%) - Black or African American
Place of birth - Born in state of residence (%) - Asian
Place of birth - Born in state of residence (%) - Hispanic or Latino
Place of birth - Born in state of residence (%) - American Indian and Alaska Native
Place of birth - Born in state of residence (%) - Multirace
Place of birth - Born in state of residence (%) - Other Race
Place of birth - Born in other state (%)
Place of birth - Born in other state (%) - White
Place of birth - Born in other state (%) - Black or African American
Place of birth - Born in other state (%) - Asian
Place of birth - Born in other state (%) - Hispanic or Latino
Place of birth - Born in other state (%) - American Indian and Alaska Native
Place of birth - Born in other state (%) - Multirace
Place of birth - Born in other state (%) - Other Race
Place of birth - Native, outside of US (%)
Place of birth - Native, outside of US (%) - White
Place of birth - Native, outside of US (%) - Black or African American
Place of birth - Native, outside of US (%) - Asian
Place of birth - Native, outside of US (%) - Hispanic or Latino
Place of birth - Native, outside of US (%) - American Indian and Alaska Native
Place of birth - Native, outside of US (%) - Multirace
Place of birth - Native, outside of US (%) - Other Race
Place of birth - Foreign born (%)
Place of birth - Foreign born (%) - White
Place of birth - Foreign born (%) - Black or African American
Place of birth - Foreign born (%) - Asian
Place of birth - Foreign born (%) - Hispanic or Latino
Place of birth - Foreign born (%) - American Indian and Alaska Native
Place of birth - Foreign born (%) - Multirace
Place of birth - Foreign born (%) - Other Race
Residents speaking English at home (%)
Residents speaking English at home - Born in the United States (%)
Residents speaking English at home - Native, born elsewhere (%)
Residents speaking English at home - Foreign born (%)
Residents speaking Spanish at home (%)
Residents speaking Spanish at home - Born in the United States (%)
Residents speaking Spanish at home - Native, born elsewhere (%)
Residents speaking Spanish at home - Foreign born (%)
Residents speaking other language at home (%)
Residents speaking other language at home - Born in the United States (%)
Residents speaking other language at home - Native, born elsewhere (%)
Residents speaking other language at home - Foreign born (%)
Marital status - Never married (%)
Marital status - Now married (%)
Marital status - Separated (%)
Marital status - Widowed (%)
Marital status - Divorced (%)
Ancestries Reported - Arab (%)
Ancestries Reported - Czech (%)
Ancestries Reported - Danish (%)
Ancestries Reported - Dutch (%)
Ancestries Reported - English (%)
Ancestries Reported - French (%)
Ancestries Reported - French Canadian (%)
Ancestries Reported - German (%)
Ancestries Reported - Greek (%)
Ancestries Reported - Hungarian (%)
Ancestries Reported - Irish (%)
Ancestries Reported - Italian (%)
Ancestries Reported - Lithuanian (%)
Ancestries Reported - Norwegian (%)
Ancestries Reported - Polish (%)
Ancestries Reported - Portuguese (%)
Ancestries Reported - Russian (%)
Ancestries Reported - Scotch-Irish (%)
Ancestries Reported - Scottish (%)
Ancestries Reported - Slovak (%)
Ancestries Reported - Subsaharan African (%)
Ancestries Reported - Swedish (%)
Ancestries Reported - Swiss (%)
Ancestries Reported - Ukrainian (%)
Ancestries Reported - United States (%)
Ancestries Reported - Welsh (%)
Ancestries Reported - West Indian (%)
Ancestries Reported - Other (%)
Geographical mobility - Same house 1 year ago (%)
Geographical mobility - Same house 1 year ago (%) - White
Geographical mobility - Same house 1 year ago (%) - Black or African American
Geographical mobility - Same house 1 year ago (%) - Asian
Geographical mobility - Same house 1 year ago (%) - Hispanic or Latino
Geographical mobility - Same house 1 year ago (%) - American Indian and Alaska Native
Geographical mobility - Same house 1 year ago (%) - Multirace
Geographical mobility - Same house 1 year ago (%) - Other Race
Geographical mobility - Moved within same county (%)
Geographical mobility - Moved within same county (%) - White
Geographical mobility - Moved within same county (%) - Black or African American
Geographical mobility - Moved within same county (%) - Asian
Geographical mobility - Moved within same county (%) - Hispanic or Latino
Geographical mobility - Moved within same county (%) - American Indian and Alaska Native
Geographical mobility - Moved within same county (%) - Multirace
Geographical mobility - Moved within same county (%) - Other Race
Geographical mobility - Moved from different county within same state (%)
Geographical mobility - Moved from different county within same state (%) - White
Geographical mobility - Moved from different county within same state (%) - Black or African American
Geographical mobility - Moved from different county within same state (%) - Asian
Geographical mobility - Moved from different county within same state (%) - Hispanic or Latino
Geographical mobility - Moved from different county within same state (%) - American Indian and Alaska Native
Geographical mobility - Moved from different county within same state (%) - Multirace
Geographical mobility - Moved from different county within same state (%) - Other Race
Geographical mobility - Moved from different state (%)
Geographical mobility - Moved from different state (%) - White
Geographical mobility - Moved from different state (%) - Black or African American
Geographical mobility - Moved from different state (%) - Asian
Geographical mobility - Moved from different state (%) - Hispanic or Latino
Geographical mobility - Moved from different state (%) - American Indian and Alaska Native
Geographical mobility - Moved from different state (%) - Multirace
Geographical mobility - Moved from different state (%) - Other Race
Geographical mobility - Moved from abroad (%)
Geographical mobility - Moved from abroad (%) - White
Geographical mobility - Moved from abroad (%) - Black or African American
Geographical mobility - Moved from abroad (%) - Asian
Geographical mobility - Moved from abroad (%) - Hispanic or Latino
Geographical mobility - Moved from abroad (%) - American Indian and Alaska Native
Geographical mobility - Moved from abroad (%) - Multirace
Geographical mobility - Moved from abroad (%) - Other Race
Place of birth for the foreign-born population - Ireland (%)
Place of birth for the foreign-born population - Denmark (%)
Place of birth for the foreign-born population - Norway (%)
Place of birth for the foreign-born population - Sweden (%)
Place of birth for the foreign-born population - United Kingdom (%)
Place of birth for the foreign-born population - England (%)
Place of birth for the foreign-born population - Scotland (%)
Place of birth for the foreign-born population - Other Northern Europe (%)
Place of birth for the foreign-born population - Austria (%)
Place of birth for the foreign-born population - Belgium (%)
Place of birth for the foreign-born population - France (%)
Place of birth for the foreign-born population - Germany (%)
Place of birth for the foreign-born population - Netherlands (%)
Place of birth for the foreign-born population - Switzerland (%)
Place of birth for the foreign-born population - Other Western Europe (%)
Place of birth for the foreign-born population - Greece (%)
Place of birth for the foreign-born population - Italy (%)
Place of birth for the foreign-born population - Portugal (%)
Place of birth for the foreign-born population - Spain (%)
Place of birth for the foreign-born population - Other Southern Europe (%)
Place of birth for the foreign-born population - Albania (%)
Place of birth for the foreign-born population - Belarus (%)
Place of birth for the foreign-born population - Bosnia and Herzegovina (%)
Place of birth for the foreign-born population - Bulgaria (%)
Place of birth for the foreign-born population - Croatia (%)
Place of birth for the foreign-born population - Czechoslovakia (%)
Place of birth for the foreign-born population - Hungary (%)
Place of birth for the foreign-born population - Latvia (%)
Place of birth for the foreign-born population - Lithuania (%)
Place of birth for the foreign-born population - North Macedonia (Macedonia) (%)
Place of birth for the foreign-born population - Moldova (%)
Place of birth for the foreign-born population - Poland (%)
Place of birth for the foreign-born population - Romania (%)
Place of birth for the foreign-born population - Russia (%)
Place of birth for the foreign-born population - Serbia (%)
Place of birth for the foreign-born population - Ukraine (%)
Place of birth for the foreign-born population - Other Eastern Europe (%)
Place of birth for the foreign-born population - China (%)
Place of birth for the foreign-born population - Hong Kong (%)
Place of birth for the foreign-born population - Taiwan (%)
Place of birth for the foreign-born population - Japan (%)
Place of birth for the foreign-born population - Korea (%)
Place of birth for the foreign-born population - Other Eastern Asia (%)
Place of birth for the foreign-born population - Afghanistan (%)
Place of birth for the foreign-born population - Bangladesh (%)
Place of birth for the foreign-born population - India (%)
Place of birth for the foreign-born population - Iran (%)
Place of birth for the foreign-born population - Kazakhstan (%)
Place of birth for the foreign-born population - Nepal (%)
Place of birth for the foreign-born population - Pakistan (%)
Place of birth for the foreign-born population - Sri Lanka (%)
Place of birth for the foreign-born population - Uzbekistan (%)
Place of birth for the foreign-born population - Other South Central Asia (%)
Place of birth for the foreign-born population - Burma (%)
Place of birth for the foreign-born population - Cambodia (%)
Place of birth for the foreign-born population - Indonesia (%)
Place of birth for the foreign-born population - Laos (%)
Place of birth for the foreign-born population - Malaysia (%)
Place of birth for the foreign-born population - Philippines (%)
Place of birth for the foreign-born population - Singapore (%)
Place of birth for the foreign-born population - Thailand (%)
Place of birth for the foreign-born population - Vietnam (%)
Place of birth for the foreign-born population - Other South Eastern Asia (%)
Place of birth for the foreign-born population - Armenia (%)
Place of birth for the foreign-born population - Iraq (%)
Place of birth for the foreign-born population - Israel (%)
Place of birth for the foreign-born population - Jordan (%)
Place of birth for the foreign-born population - Kuwait (%)
Place of birth for the foreign-born population - Lebanon (%)
Place of birth for the foreign-born population - Saudi Arabia (%)
Place of birth for the foreign-born population - Syria (%)
Place of birth for the foreign-born population - Turkey (%)
Place of birth for the foreign-born population - Yemen (%)
Place of birth for the foreign-born population - Other Western Asia (%)
Place of birth for the foreign-born population - Eritrea (%)
Place of birth for the foreign-born population - Ethiopia (%)
Place of birth for the foreign-born population - Kenya (%)
Place of birth for the foreign-born population - Somalia (%)
Place of birth for the foreign-born population - Uganda (%)
Place of birth for the foreign-born population - Zimbabwe (%)
Place of birth for the foreign-born population - Other Eastern Africa (%)
Place of birth for the foreign-born population - Cameroon (%)
Place of birth for the foreign-born population - Congo (%)
Place of birth for the foreign-born population - Democratic Republic of Congo (Zaire) (%)
Place of birth for the foreign-born population - Other Middle Africa (%)
Place of birth for the foreign-born population - Egypt (%)
Place of birth for the foreign-born population - Morocco (%)
Place of birth for the foreign-born population - Sudan (%)
Place of birth for the foreign-born population - Other Northern Africa (%)
Place of birth for the foreign-born population - South Africa (%)
Place of birth for the foreign-born population - Other Southern Africa (%)
Place of birth for the foreign-born population - Cabo Verde (%)
Place of birth for the foreign-born population - Ghana (%)
Place of birth for the foreign-born population - Liberia (%)
Place of birth for the foreign-born population - Nigeria (%)
Place of birth for the foreign-born population - Senegal (%)
Place of birth for the foreign-born population - Sierra Leone (%)
Place of birth for the foreign-born population - Other Western Africa (%)
Place of birth for the foreign-born population - Australia (%)
Place of birth for the foreign-born population - New Zealand (%)
Place of birth for the foreign-born population - Fiji (%)
Place of birth for the foreign-born population - Micronesia (%)
Place of birth for the foreign-born population - Bahamas (%)
Place of birth for the foreign-born population - Barbados (%)
Place of birth for the foreign-born population - Cuba (%)
Place of birth for the foreign-born population - Dominica (%)
Place of birth for the foreign-born population - Dominican Republic (%)
Place of birth for the foreign-born population - Grenada (%)
Place of birth for the foreign-born population - Haiti (%)
Place of birth for the foreign-born population - Jamaica (%)
Place of birth for the foreign-born population - St. Vincent and the Grenadines (%)
Place of birth for the foreign-born population - Trinidad and Tobago (%)
Place of birth for the foreign-born population - West Indies (%)
Place of birth for the foreign-born population - Other Caribbean (%)
Place of birth for the foreign-born population - Belize (%)
Place of birth for the foreign-born population - Costa Rica (%)
Place of birth for the foreign-born population - El Salvador (%)
Place of birth for the foreign-born population - Guatemala (%)
Place of birth for the foreign-born population - Honduras (%)
Place of birth for the foreign-born population - Mexico (%)
Place of birth for the foreign-born population - Nicaragua (%)
Place of birth for the foreign-born population - Panama (%)
Place of birth for the foreign-born population - Other Central America (%)
Place of birth for the foreign-born population - Argentina (%)
Place of birth for the foreign-born population - Bolivia (%)
Place of birth for the foreign-born population - Brazil (%)
Place of birth for the foreign-born population - Chile (%)
Place of birth for the foreign-born population - Colombia (%)
Place of birth for the foreign-born population - Ecuador (%)
Place of birth for the foreign-born population - Guyana (%)
Place of birth for the foreign-born population - Peru (%)
Place of birth for the foreign-born population - Uruguay (%)
Place of birth for the foreign-born population - Venezuela (%)
Place of birth for the foreign-born population - Other South America (%)
Place of birth for the foreign-born population - Canada (%)
Place of birth for the foreign-born population - Other Northern America (%)
Place of birth for the foreign-born population - Other (%)
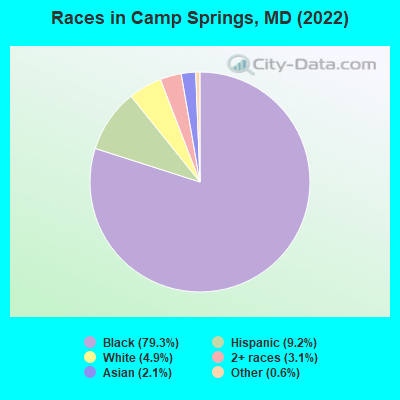
According to 2022 data, the most numerous races in Camp Springs, MD are White alone (1,132 residents), Black alone (18,258 residents), and Hispanic (2,120 residents). 83.5% of Camp Springs residents speak English at home. 11.5% of Camp Springs, MD residents are foreign-born (6.3% born in Latin America, 2.6% born in Africa, 1.5% born in Asia), which is 38.7% less than the foreign-born rate of 16.0% across the entire state of Maryland.
Race distribution in Camp Springs
2000 2022
3,286,547 62.1% White alone 1,464,735 27.7% Black alone 227,916 4.3% Hispanic 209,738 4.0% Asian alone 82,946 1.6% Two or more races 13,312 0.3% American Indian alone 9,379 0.2% Other race alone 1,913 0.04% Native Hawaiian and Other
2,906,492 47.1% White alone 1,800,914 29.2% Black alone 705,842 11.4% Hispanic 401,818 6.5% Asian alone 291,317 4.7% Two or more races 46,930 0.8% Other race alone 8,930 0.1% American Indian alone 2,417 0.04% Native Hawaiian and Other
Income and house value in Camp Springs Median household income in 2022 $113,230 White non-Hispanic householders$121,074 Black householders$92,525 Asian householders$73,832 Some other race householders$91,433 Two or more races householders$88,351 Hispanic or Latino race householdersMedian 2022 house value $371,085 White Non-Hispanic householders$389,247 Black or African American householders$357,832 American Indian or Alaska Native householders $355,378 Asian householders$398,819 Some other race householders$383,848 Two or more races householders$412,317 Hispanic or Latino householders
Median age by race in Camp Springs
50.8 Median age for White residents52.1 50.3 45.1 Median age for Black or African American residents48.0 42.6 -780,410,741.7 Median age for American Indian / Alaska Native residents-888,297,871.5 -689,905,591.2 36.3 Median age for Asian residents25.4 39.2 -571,600,480.8 Median age for Native Hawaiian / Pacific Islander residents-720,061,021.4 -760,942,760.2 27.9 Median age for Other race residents29.9 26.7 39.6 Median age for Two or more races residents23.8 50.2 49.6 Median age for White alone residents45.0 49.0 31.2 Median age for Hispanic or Latino residents31.6 30.3
Owner/renter occupied households by race in Camp Springs
House owners and renters - White residents 416 68.9% Owner occupied188 31.1% Renter occupiedHouse owners and renters - Black or African American residents 4,908 70.1% Owner occupied2,090 29.9% Renter occupiedHouse owners and renters - American Indian / Alaska Native residents 25 100.0% Owner occupiedHouse owners and renters - Asian residents 121 100.0% Owner occupiedHouse owners and renters - Other race residents 348 67.6% Owner occupied167 32.4% Renter occupiedHouse owners and renters - Two or more races residents 132 41.4% Owner occupied186 58.6% Renter occupiedHouse owners and renters - White alone residents 389 67.1% Owner occupied190 32.9% Renter occupiedHouse owners and renters - Hispanic or Latino residents 432 72.9% Owner occupied161 27.1% Renter occupied
Language usage in Camp Springs
English speakers - Total 83.5% of residents of Camp Springs speak English at home.
9.3% of residents speak Spanish at home 769 37.0% Speak English very well1,309 63.0% Speak English less than very well5.1% of residents speak other language at home 775 67.9% Speak English very well367 32.1% Speak English less than very well
English speakers - Born in the United States 95.8% of residents of Camp Springs speak English at home.
2.1% of residents speak Spanish at home 100 38.3% Speak English very well161 61.7% Speak English less than very well1.2% of residents speak other language at home 115 75.2% Speak English very well38 24.8% Speak English less than very well
English speakers - Native, born elsewhere 79.2% of residents of Camp Springs speak English at home.
10.1% of residents speak Spanish at home 15 100.0% Speak English very well4.0% of residents speak other language at home 6 100.0% Speak English very well
English speakers - Foreign-born 18.8% of residents of Camp Springs speak English at home.
45.9% of residents speak Spanish at home 397 32.5% Speak English very well825 67.5% Speak English less than very well34.4% of residents speak other language at home 649 70.7% Speak English very well269 29.3% Speak English less than very well
White (Caucasian) - Speak only English Native:
96.9% (1,087)Foreign-born:
16.9% (18)
White (Caucasian) - Speak another language Native:
3.7% (41)Foreign-born:
80.2% (86)
Black or African American - Speak only English Native:
96.9% (15,809)Foreign-born:
37.7% (393)
Black or African American - Speak another language Native:
3.0% (487)Foreign-born:
62.3% (649)
Asian - Speak only English Native:
49.8% (83)Foreign-born:
13.5% (40)
Asian - Speak another language Native:
44.4% (74)Foreign-born:
86.3% (254)
Other race - Speak another language Native:
70.9% (439)Foreign-born:
100.0% (1,067)
Two or more races - Speak only English Native:
92.4% (734)Foreign-born:
41.5% (35)
Two or more races - Speak another language Native:
6.1% (49)Foreign-born:
53.5% (45)
White alone - Speak another language Native:
4.2% (47)Foreign-born:
98.2% (7)
Hispanic or Latino - Speak only English Native:
21.2% (148)Foreign-born:
2.9% (37)
Hispanic or Latino - Speak another language Native:
78.7% (551)Foreign-born:
97.2% (1,243)
Foreign-born residents in Camp Springs 2,656 residents are foreign born (6.3% Latin America , 2.6% Africa , 1.5% Asia ).
This city:
11.5%Maryland:
15.7%
Marital status for residents in Camp Springs Marital status - White (Caucasian) population 15 years and over
Males 29.5% Never married53.3% Now married3.7% Separated6.3% Widowed7.2% DivorcedFemales 19.2% Never married54.6% Now married7.4% Separated7.2% Widowed11.6% DivorcedWomen who did not give birth in the past 12 months Now married:
61.5% (165)Unmarried:
38.5% (103)
Marital status - Black or African American population 15 years and over
Males 42.8% Never married46.6% Now married3.3% Separated1.9% Widowed5.3% DivorcedFemales 40.3% Never married38.9% Now married2.5% Separated7.4% Widowed11.0% DivorcedWomen who did not give birth in the past 12 months Now married:
28.5% (1,144)Unmarried:
71.5% (2,867)
Marital status - Asian population 15 years and over
Males 54.9% Never married45.1% Now married0.0% Separated0.0% Widowed0.0% DivorcedFemales 37.8% Never married51.9% Now married0.0% Separated0.0% Widowed10.3% DivorcedWomen who did not give birth in the past 12 months Now married:
61.0% (95)Unmarried:
39.0% (61)
Marital status - Other race population 15 years and over
Males 51.5% Never married39.9% Now married0.0% Separated0.0% Widowed8.6% DivorcedFemales 43.5% Never married49.5% Now married2.2% Separated0.0% Widowed4.8% DivorcedWomen who gave birth in the past 12 months Now married:
100.0% (9)Unmarried:
0.0% (0)
Women who did not give birth in the past 12 months Now married:
42.4% (149)Unmarried:
57.6% (202)
Marital status - Two or more races population 15 years and over
Males 66.9% Never married20.8% Now married0.0% Separated0.0% Widowed12.3% DivorcedFemales 47.5% Never married31.0% Now married2.1% Separated11.1% Widowed8.2% DivorcedWomen who did not give birth in the past 12 months Now married:
4.5% (10)Unmarried:
95.5% (206)
Marital status - White alone, not Hispanic / Latino population 15 years and over
Males 31.4% Never married51.7% Now married4.4% Separated7.6% Widowed4.9% DivorcedFemales 17.7% Never married55.1% Now married8.4% Separated5.5% Widowed13.3% DivorcedWomen who did not give birth in the past 12 months Now married:
62.3% (149)Unmarried:
37.7% (90)
Marital status - Hispanic or Latino population 15 years and over
Males 49.9% Never married43.0% Now married0.0% Separated0.0% Widowed7.1% DivorcedFemales 45.1% Never married45.4% Now married1.5% Separated2.6% Widowed5.5% DivorcedWomen who gave birth in the past 12 months Now married:
100.0% (8)Unmarried:
0.0% (0)
Women who did not give birth in the past 12 months Now married:
39.7% (188)Unmarried:
60.3% (286)
Ancestries in Camp Springs
271 1.6% American210 1.2% Kenyan152 0.9% African116 0.7% Irish107 0.6% Jamaican94 0.5% Nigerian87 0.5% West Indian76 0.4% Ethiopian60 0.3% Swedish54 0.3% English52 0.3% Guyanese32 0.2% Lebanese25 0.1% Barbadian25 0.1% Trinidadian and Tobagonian23 0.1% Sierra Leonean19 0.1% European11 0.06% German11 0.06% Norwegian10 0.06% Italian10 0.06% Scandinavian7 0.04% Polish
Children Nativity (place of birth) in Camp Springs
Children under 6 years - Living with two parents Both parents native 210 100.0% NativeBoth parents foreign-born 160 94.7% Native9 5.3% Foreign-bornOne native, one foreign-born parent 128 100.0% NativeChildren under 6 years - Living with one parent Native parent 352 100.0% Native0 0.0% Foreign-bornForeign-born parent 10 30.4% Native23 69.6% Foreign-bornChildren 6 to 17 years - Living with two parents Both parents native 1,419 100.0% Native0 0.0% Foreign-bornBoth parents foreign-born 190 93.9% Native12 6.1% Foreign-bornOne native, one foreign-born parent 227 100.0% NativeChildren 6 to 17 years - Living with one parent Native parent 773 100.0% NativeForeign-born parent 93 61.7% Native58 38.3% Foreign-born
Grandparents responsible for own grandchildren in Camp Springs
Grandparents (30 to 59 years) Black or African American 31 17.7% Responsible for grandchildren144 82.3% Not responsible for grandchildrenAsian 24 100.0% Not responsible for grandchildrenGrandparents (60 years and over) Black or African American 267 60.4% Responsible for grandchildren175 39.6% Not responsible for grandchildren