Rmma neighborhood in Austin, Texas (TX), 78723 detailed profile
Settings
X


Business Search - 14 Million verified businesses
Area: 1.259 square miles
Population: 4,991
Population density:
| Rmma: | 3,964 people per square mile |
| Austin: | 3,878 people per square mile |

- 2,23844.0%White
- 2,22343.7%Hispanic or Latino
- 4248.3%Black
- 1002.0%Asian
- 561.1%Some other race
- 290.6%Two or more races
- 170.3%American Indian

Median household income in 2022:
| Rmma: | $86,263 |
| Austin: | $89,415 |
Distribution of median household income
![Distribution of median household income]()
- 65Less than $10,000
- 166$10,000 to $19,999
- 170$20,000 to $29,999
- 324$30,000 to $39,999
- 150$40,000 to $49,999
- 411$50,000 to $59,999
- 240$60,000 to $74,999
- 464$75,000 to $99,999
- 369$100,000 to $124,999
- 142$125,000 to $149,999
- 134$150,000 to $199,999
- 158$200,000 or more

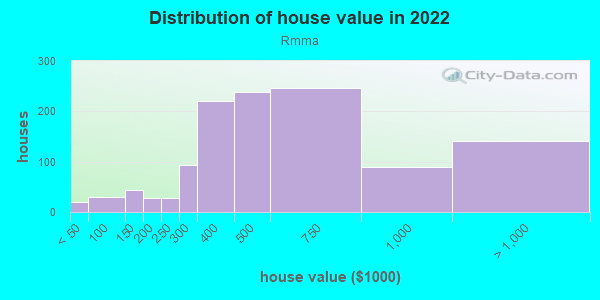
Distribution of owner-occupied house/condo value
![Distribution of owner-occupied house/condo value]()
- 20Less than $50,000
- 29$50,000 to $99,999
- 44$100,000 to $149,999
- 28$150,000 to $199,999
- 27$200,000 to $249,999
- 93$250,000 to $299,999
- 220$300,000 to $399,999
- 238$400,000 to $499,999
- 246$500,000 to $749,999
- 90$750,000 to $999,999
- 142$1,000,000 or more
Distribution of rent paid by renters
![Distribution of rent paid by renters]()
- 13Less than $100
- 81$100 to $199
- 76$200 to $299
- 13$400 to $499
- 92$500 to $599
- 113$600 to $699
- 128$700 to $799
- 75$800 to $899
- 61$900 to $999
- 691$1,000 to $1,249
- 399$1,250 to $1,499
- 173$1,500 to $1,999
- 84$2,000 or more

Median rent in 2022:
| Rmma: | $1,260 |
| Austin: | $1,437 |
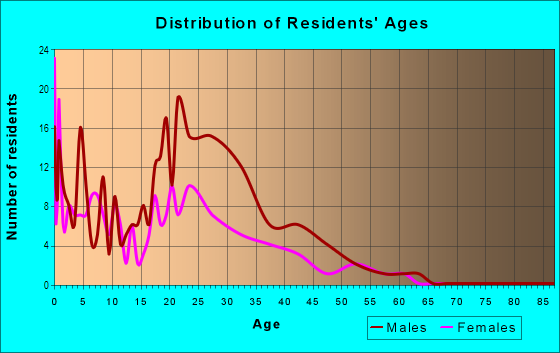
| Males: | 2,913 |
| Females: | 2,078 |
Males:
| This neighborhood: | 32.4 years |
| Whole city: | 34.5 years |
| This neighborhood: | 35.0 years |
| Whole city: | 34.4 years |
Average household size:
| Rmma: | 5.9 people |
| Austin: | 28.0 people |
Percentage of family households:
| Rmma: | 27.8% |
| Austin: | 36.6% |
| Here: | 23.7% |
| Austin: | 35.3% |
Percentage of married-couple families with children (among all households):
| Rmma: | 43.1% |
| Austin: | 36.3% |
Percentage of single-mother households (among all households):
| Rmma: | 8.6% |
| Austin: | 7.9% |
Percentage of never married males 15 years old and over:
Percentage of never married females 15 years old and over:
| Rmma: | 40.4% |
| Austin: | 25.0% |
Percentage of never married females 15 years old and over:
| Rmma: | 15.6% |
| city: | 19.9% |
Percentage of people that speak English not well or not at all:
| Rmma: | 11.5% |
| Austin: | 5.2% |
Percentage of people born in this state:
Percentage of people born in another U.S. state:
Percentage of native residents but born outside the U.S.:
Percentage of foreign born residents:
| Here: | 49.6% |
| Austin: | 48.2% |
Percentage of people born in another U.S. state:
| Rmma: | 22.5% |
| Austin: | 31.8% |
Percentage of native residents but born outside the U.S.:
| Here: | 1.1% |
| city: | 2.3% |
Percentage of foreign born residents:
| Here: | 26.8% |
| Austin: | 17.8% |

Owner-occupied
Renter-occupied


- Rooms in owner-occupied houses and condos in Rmma
- 01 room
- 112 rooms
- 113 rooms
- 2384 rooms
- 1895 rooms
- 1816 rooms
- 1077 rooms
- 758 rooms
- 929+ rooms

- Rooms in renter-occupied apartments in Rmma
- 681 room
- 572 rooms
- 4053 rooms
- 8144 rooms
- 835 rooms
- 916 rooms
- 937 rooms
- 108 rooms
- 279+ rooms
Owner-occupied
Renter-occupied

- Bedrooms in owner-occupied houses and condos in Rmma
- 0no bedroom
- 991 bedroom
- 2162 bedrooms
- 6393 bedrooms
- 894 bedrooms
- 1435+ bedrooms

- Bedrooms in renter-occupied apartments in Rmma
- 68no bedroom
- 3501 bedroom
- 9862 bedrooms
- 723 bedrooms
- 434 bedrooms
- 05+ bedrooms
Average number of cars or other vehicles available in houses/condos:
Average number of cars or other vehicles available in apartments:
| This neighborhood: | 1.6 |
| Austin: | 1.9 |
Average number of cars or other vehicles available in apartments:
| Here: | 1.3 |
| city: | 1.3 |
Percentage of units with a mortgage:
| Rmma: | 64.6% |
| Austin: | 68.5% |
Average estimated value of detached houses in 2022 (41.6% of all units):
| Rmma: | $440,195 |
| Austin: | $737,673 |

- Year house built in Rmma
- 112020 or later
- 1872010 to 2019
- 3272000 to 2009
- 1181990 to 1999
- 2481980 to 1989
- 5221970 to 1979
- 1831960 to 1969
- 7541950 to 1959
- 3061940 to 1949
- 901939 or earlier

City-data.com crime index for city in 2020 (higher means more crime):
| City: | 316.8 |
| U.S. average: | 219.5 |
Travel time to work (commute)
![Travel time to work (commute)]()
- 26Less than 5 minutes
- 955 to 9 minutes
- 10710 to 14 minutes
- 18315 to 19 minutes
- 18820 to 24 minutes
- 5025 to 29 minutes
- 15230 to 34 minutes
- 935 to 39 minutes
- 3640 to 44 minutes
- 3745 to 59 minutes
- 7460 to 89 minutes
- 7690 or more minutes

Means of transportation to work
![Means of transportation to work]()
- 56.2%1,814Drove a car alone
- 6.1%196Carpooled
- 2.6%83Bus
- 1.8%57Taxi
- 0.6%20Motorcycle
- 0.7%22Bicycle
- 32.6%1,053Walked
- 0.4%13Other means
- 19.3%622Worked at home

Time leaving home to go to work
![Time leaving home to go to work]()
- 2612:00 a.m. to 4:59 a.m.
- 325:00 a.m. to 5:29 a.m.
- 375:30 a.m. to 5:59 a.m.
- 1686:00 a.m. to 6:29 a.m.
- 726:30 a.m. to 6:59 a.m.
- 1437:00 a.m. to 7:29 a.m.
- 1147:30 a.m. to 7:59 a.m.
- 1558:00 a.m. to 8:29 a.m.
- 958:30 a.m. to 8:59 a.m.
- 1029:00 a.m. to 9:59 a.m.
- 810:00 a.m. to 10:59 a.m.
- 811:00 a.m. to 11:59 a.m.
- 3912:00 p.m. to 3:59 p.m.
- 754:00 p.m. to 11:59 p.m.

Occupations of males:
- Percentage of males in management occupations (except farmers):
Here: 9.8% city: 15.3%
- Percentage of males in business and financial operations occupations:
Here: 3.1% city: 7.0%
- Percentage of males in computer and mathematical occupations:
Here: 6.1% city: 12.0%
- Percentage of males in legal occupations:
Here: 1.0% city: 1.9%
- Percentage of males in education, training, and library occupations:
Here: 6.2% city: 4.1%
- Percentage of males in arts, design, entertainment, sports, and media occupations:
Here: 4.9% city: 4.1%
- Percentage of males in service occupations:
Here: 9.1% city: 11.2%
- Percentage of males in sales and office occupations:
Here: 14.0% city: 14.9%
- Percentage of males in construction, extraction, and maintenance occupations:
Here: 28.6% city: 7.1%
- Percentage of males in material moving occupations:
Here: 1.5% city: 2.8%
Occupations of females:
- Percentage of females in management occupations (except farmers):
Here: 9.7% city: 13.5%
- Percentage of females in business and financial operations occupations:
Here: 4.5% city: 11.0%
- Percentage of females in life, physical, and social science occupations:
Here: 1.7% city: 1.7%
- Percentage of females in community and social services occupations:
Here: 2.6% city: 2.2%
- Percentage of females in education, training, and library occupations:
Here: 12.1% city: 9.0%
- Percentage of females in arts, design, entertainment, sports, and media occupations:
Here: 12.5% city: 4.5%
- Percentage of females in healthcare practitioners and technical occupations:
Here: 1.6% city: 7.8%
- Percentage of females in service occupations:
Here: 20.2% city: 15.8%
- Percentage of females in sales and office occupations:
Here: 32.6% city: 22.9%
Education in this neighborhood (subdivision or community):
- Percentage of people 3 years and older in K-12 schools:
Rmma: 15.7% Austin: 12.4%
- Percentage of people 3 years and older in undergraduate colleges:
Rmma: 3.6% Austin: 6.1%
- Percentage of people 3 years and older in grad. or professional schools:
Rmma: 9.0% Austin: 2.5%
- Percentage of students K-12 enrolled in private schools:
Rmma: 20.5% Austin: 11.8%
Percentage of population below poverty level:
| Rmma: | 20.6% |
| Austin: | 11.1% |
Median year owner moved in (as recorded in 2022):
Median year renter moved in (as recorded in 2022):
| Rmma: | 2012 |
| Austin: | 2013 |
Median year renter moved in (as recorded in 2022):
| Rmma: | 2018 |
| Austin: | 2021 |
Percentage of married-couple families with both working:
| Rmma: | 83.6% |
| Austin: | 68.5% |

- 45.0%Electricity
- 42.7%Utility gas
- 7.3%Bottled, tank, or LP gas
- 5.0%No fuel used
Roads and streets:
Manor Rd
Length: 1.43 miles
Directions: E-W, N-S, SW-NE
Address range: 3400 to 5099
Directions: E-W, N-S, SW-NE
Address range: 3400 to 5099
E 51st St
Length: 1.11 miles
Direction: SE-NW
Address range: 1100 to 2299
Direction: SE-NW
Address range: 1100 to 2299
Old Manor Rd
Length: 0.24 miles
Direction: SW-NE
Address range: 4850 to 5099
Direction: SW-NE
Address range: 4850 to 5099
Anchor Ln
Length: 0.18 miles
Direction: SE-NW
Address range: 2000 to 2229
Direction: SE-NW
Address range: 2000 to 2229
51st St E
Length: 0.15 miles
Direction: SE-NW
Address range: 2682 to 2899
Direction: SE-NW
Address range: 2682 to 2899
Cameron Rd
Length: 0.09 miles
Directions: E-W, SW-NE
Address range: 5052 to 5099
Directions: E-W, SW-NE
Address range: 5052 to 5099
Lovell Dr
Length: 0.05 miles
Direction: E-W
Address range: 2600 to 2699
Direction: E-W
Address range: 2600 to 2699
Manor Cir
Length: 0.04 miles
Direction: E-W
Address range: 2500 to 2599
Direction: E-W
Address range: 2500 to 2599
Wilshire Blvd (Aldrich St)
Length: 0.04 miles
Direction: E-W
Address range: 1730 to 1799
Direction: E-W
Address range: 1730 to 1799
Other features:
Tannehill Branch Crk
Length: 0.44 miles
Directions: E-W, N-S, SE-NW, SW-NE
Directions: E-W, N-S, SE-NW, SW-NE