Little India neighborhood in Artesia, California (CA), 90701, 90703 detailed profile
Settings
X


Business Search - 14 Million verified businesses
Area: 0.112 square miles
Population: 893
Population density:
| Little India: | 8,008 people per square mile |
| Artesia: | 10,038 people per square mile |

- 34431.4%Asian
- 33630.7%Hispanic or Latino
- 29026.5%Black
- 585.3%White
- 292.7%Two or more races
- 252.3%Native Hawaiian and Other
Pacific Islander - 121.1%Some other race

Median household income in 2022:
| Little India: | $133,068 |
| Artesia: | $92,702 |
Distribution of median household income
![Distribution of median household income]()
- 16Less than $10,000
- 17$10,000 to $19,999
- 21$20,000 to $29,999
- 35$30,000 to $39,999
- 44$40,000 to $49,999
- 45$50,000 to $59,999
- 20$60,000 to $74,999
- 30$75,000 to $99,999
- 36$100,000 to $124,999
- 19$125,000 to $149,999
- 28$150,000 to $199,999
- 26$200,000 or more

Distribution of owner-occupied house/condo value
![Distribution of owner-occupied house/condo value]()
- 13Less than $50,000
- 12$50,000 to $99,999
- 2$150,000 to $199,999
- 12$200,000 to $249,999
- 7$300,000 to $399,999
- 7$400,000 to $499,999
- 23$500,000 to $749,999
- 91$750,000 to $999,999
- 16$1,000,000 or more

Distribution of rent paid by renters
![Distribution of rent paid by renters]()
- 2$400 to $499
- 8$700 to $799
- 5$800 to $899
- 6$900 to $999
- 28$1,000 to $1,249
- 31$1,250 to $1,499
- 47$1,500 to $1,999
- 84$2,000 or more

Median rent in 2022:
| Little India: | $3,517 |
| Artesia: | $1,847 |
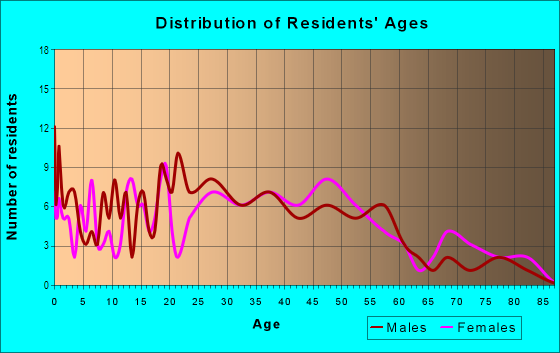
| Males: | 425 |
| Females: | 467 |
Males:
| This neighborhood: | 60.7 years |
| Whole city: | 38.5 years |
| This neighborhood: | 59.0 years |
| Whole city: | 40.2 years |
Average household size:
| Little India: | 5.9 people |
| Artesia: | 3.5 people |
Percentage of family households:
| Little India: | 73.9% |
| Artesia: | 55.3% |
| Here: | 58.8% |
| Artesia: | 59.3% |
Percentage of married-couple families with children (among all households):
| Little India: | 22.3% |
| Artesia: | 23.4% |
Percentage of single-mother households (among all households):
| Little India: | 4.6% |
| Artesia: | 3.6% |
Percentage of never married males 15 years old and over:
Percentage of never married females 15 years old and over:
| Little India: | 10.7% |
| Artesia: | 17.4% |
Percentage of never married females 15 years old and over:
| Little India: | 25.3% |
| city: | 18.3% |
Percentage of people that speak English not well or not at all:
| Little India: | 9.7% |
| Artesia: | 11.0% |
Percentage of people born in this state:
Percentage of people born in another U.S. state:
Percentage of native residents but born outside the U.S.:
Percentage of foreign born residents:
| Here: | 49.0% |
| Artesia: | 44.9% |
Percentage of people born in another U.S. state:
| Little India: | 5.8% |
| Artesia: | 5.2% |
Percentage of native residents but born outside the U.S.:
| Here: | 1.0% |
| city: | 1.4% |
Percentage of foreign born residents:
| Here: | 44.3% |
| Artesia: | 48.5% |

Owner-occupied
Renter-occupied


- Rooms in owner-occupied houses and condos in Little India
- 21 room
- 12 rooms
- 43 rooms
- 134 rooms
- 255 rooms
- 776 rooms
- 197 rooms
- 128 rooms
- 319+ rooms

- Rooms in renter-occupied apartments in Little India
- 91 room
- 52 rooms
- 153 rooms
- 544 rooms
- 525 rooms
- 126 rooms
- 287 rooms
- 288 rooms
- 59+ rooms
Owner-occupied
Renter-occupied

- Bedrooms in owner-occupied houses and condos in Little India
- 2no bedroom
- 91 bedroom
- 282 bedrooms
- 303 bedrooms
- 584 bedrooms
- 335+ bedrooms

- Bedrooms in renter-occupied apartments in Little India
- 9no bedroom
- 91 bedroom
- 582 bedrooms
- 393 bedrooms
- 394 bedrooms
- 15+ bedrooms
Average number of cars or other vehicles available in houses/condos:
Average number of cars or other vehicles available in apartments:
| This neighborhood: | 2.3 |
| Artesia: | 2.6 |
Average number of cars or other vehicles available in apartments:
| Here: | 2.4 |
| city: | 2.2 |
Percentage of units with a mortgage:
| Little India: | 52.1% |
| Artesia: | 67.6% |
Average estimated value of detached houses in 2022 (50.2% of all units):
| Little India: | $856,541 |
| California: | $988,808 |

- Year house built in Little India
- 02020 or later
- 102010 to 2019
- 442000 to 2009
- 401990 to 1999
- 241980 to 1989
- 801970 to 1979
- 371960 to 1969
- 511950 to 1959
- 441940 to 1949
- 841939 or earlier

City-data.com crime index for city in 2020 (higher means more crime):
| City: | 229.3 |
| U.S. average: | 219.5 |
Travel time to work (commute)
![Travel time to work (commute)]()
- 2Less than 5 minutes
- 155 to 9 minutes
- 4710 to 14 minutes
- 4415 to 19 minutes
- 3420 to 24 minutes
- 425 to 29 minutes
- 1830 to 34 minutes
- 635 to 39 minutes
- 940 to 44 minutes
- 4045 to 59 minutes
- 1860 to 89 minutes
- 1190 or more minutes

Means of transportation to work
![Means of transportation to work]()
- 58.7%192Drove a car alone
- 17.7%58Carpooled
- 1.2%4Bus
- 0.9%3Light rail, streetcar or trolley
- 0.3%1Taxi
- 23.9%78Bicycle
- 72.8%238Walked
- 0.3%1Other means
- 7.6%25Worked at home

Time leaving home to go to work
![Time leaving home to go to work]()
- 512:00 a.m. to 4:59 a.m.
- 105:00 a.m. to 5:29 a.m.
- 135:30 a.m. to 5:59 a.m.
- 146:00 a.m. to 6:29 a.m.
- 136:30 a.m. to 6:59 a.m.
- 297:00 a.m. to 7:29 a.m.
- 337:30 a.m. to 7:59 a.m.
- 308:00 a.m. to 8:29 a.m.
- 98:30 a.m. to 8:59 a.m.
- 199:00 a.m. to 9:59 a.m.
- 210:00 a.m. to 10:59 a.m.
- 411:00 a.m. to 11:59 a.m.
- 3812:00 p.m. to 3:59 p.m.
- 214:00 p.m. to 11:59 p.m.

Occupations of males:
- Percentage of males in management occupations (except farmers):
Here: 14.0% city: 12.0%
- Percentage of males in business and financial operations occupations:
Here: 1.2% city: 3.7%
- Percentage of males in computer and mathematical occupations:
Here: 8.7% city: 5.3%
- Percentage of males in architecture and engineering occupations:
Here: 2.0% city: 2.3%
- Percentage of males in education, training, and library occupations:
Here: 6.9% city: 3.6%
- Percentage of males in healthcare practitioners and technical occupations:
Here: 2.4% city: 7.4%
- Percentage of males in service occupations:
Here: 24.1% city: 18.2%
- Percentage of males in sales and office occupations:
Here: 31.7% city: 14.1%
- Percentage of males in construction, extraction, and maintenance occupations:
Here: 1.4% city: 6.6%
- Percentage of males in production occupations:
Here: 5.0% city: 8.4%
- Percentage of males in transportation occupations:
Here: 2.6% city: 5.8%
- Percentage of males in material moving occupations:
Here: 1.4% city: 5.1%
Occupations of females:
- Percentage of females in management occupations (except farmers):
Here: 5.3% city: 11.7%
- Percentage of females in business and financial operations occupations:
Here: 1.2% city: 8.2%
- Percentage of females in architecture and engineering occupations:
Here: 2.2% city: 1.7%
- Percentage of females in life, physical, and social science occupations:
Here: 3.7% city: 0.3%
- Percentage of females in community and social services occupations:
Here: 1.2% city: 0.5%
- Percentage of females in legal occupations:
Here: 1.3% city: 1.5%
- Percentage of females in education, training, and library occupations:
Here: 9.8% city: 7.1%
- Percentage of females in healthcare practitioners and technical occupations:
Here: 3.5% city: 10.3%
- Percentage of females in service occupations:
Here: 32.7% city: 22.5%
- Percentage of females in sales and office occupations:
Here: 27.6% city: 28.4%
- Percentage of females in material moving occupations:
Here: 13.3% city: 4.8%
Education in this neighborhood (subdivision or community):
- Percentage of people 3 years and older in K-12 schools:
Little India: 27.5% Artesia: 15.0%
- Percentage of people 3 years and older in undergraduate colleges:
Little India: 6.1% Artesia: 7.8%
- Percentage of people 3 years and older in grad. or professional schools:
Little India: 8.7% Artesia: 2.2%
- Percentage of students K-12 enrolled in private schools:
Little India: 10.5% Artesia: 3.6%
Percentage of population below poverty level:
| Little India: | 5.6% |
| Artesia: | 7.3% |
Median year owner moved in (as recorded in 2022):
Median year renter moved in (as recorded in 2022):
| Little India: | 3002 |
| Artesia: | 2001 |
Median year renter moved in (as recorded in 2022):
| Little India: | 3011 |
| Artesia: | 2012 |
Percentage of married-couple families with both working:
| Little India: | 65.9% |
| Artesia: | 63.8% |

- 66.3%Utility gas
- 27.7%Electricity
- 3.4%No fuel used
- 2.6%Bottled, tank, or LP gas
Roads and streets:
Pioneer Blvd
Length: 0.50 miles
Directions: N-S, SW-NE
Address range: 18300 to 18899
Directions: N-S, SW-NE
Address range: 18300 to 18899
Arline Ave
Length: 0.43 miles
Direction: N-S
Address range: 18300 to 18899
Direction: N-S
Address range: 18300 to 18899
Corby Ave
Length: 0.31 miles
Direction: N-S
Address range: 18400 to 18899
Direction: N-S
Address range: 18400 to 18899
South St
Length: 0.17 miles
Direction: E-W
Address range: 11751 to 11837
Direction: E-W
Address range: 11751 to 11837
186th St
Length: 0.17 miles
Direction: E-W
Address range: 11736 to 11832
Direction: E-W
Address range: 11736 to 11832
187th St
Length: 0.17 miles
Direction: E-W
Address range: 11737 to 11828
Direction: E-W
Address range: 11737 to 11828
183rd St
Length: 0.09 miles
Direction: E-W
Address range: 11800 to 11832
Direction: E-W
Address range: 11800 to 11832
188th St
Length: 0.08 miles
Direction: E-W
Address range: 11728 to 11799
Direction: E-W
Address range: 11728 to 11799
Railroad features:
Pacific Electric Rlwy
Length: 0.18 miles
Direction: SE-NW
Direction: SE-NW