Lions Park neighborhood in Mount Prospect, Illinois (IL), 60056 detailed profile
Settings
X


Business Search - 14 Million verified businesses
Area: 0.440 square miles
Population: 2,139
Population density:
| Lions Park: | 4,858 people per square mile |
| Mount Prospect: | 5,506 people per square mile |

- 1,89281.7%White
- 1998.6%Two or more races
- 833.6%Asian
- 783.4%Some other race
- 502.2%Hispanic or Latino
- 130.6%Black
- 20.09%American Indian

Median household income in 2022:
| Lions Park: | $136,685 |
| Mount Prospect: | $100,526 |
Distribution of median household income
![Distribution of median household income]()
- 109Less than $10,000
- 60$10,000 to $19,999
- 78$20,000 to $29,999
- 137$30,000 to $39,999
- 94$40,000 to $49,999
- 42$50,000 to $59,999
- 64$60,000 to $74,999
- 105$75,000 to $99,999
- 95$100,000 to $124,999
- 126$125,000 to $149,999
- 150$150,000 to $199,999
- 174$200,000 or more

Distribution of owner-occupied house/condo value
![Distribution of owner-occupied house/condo value]()
- 53Less than $50,000
- 26$50,000 to $99,999
- 86$100,000 to $149,999
- 174$150,000 to $199,999
- 47$200,000 to $249,999
- 58$250,000 to $299,999
- 322$300,000 to $399,999
- 191$400,000 to $499,999
- 94$500,000 to $749,999
- 43$750,000 to $999,999
- 3$1,000,000 or more

Distribution of rent paid by renters
![Distribution of rent paid by renters]()
- 6$600 to $699
- 43$800 to $899
- 9$900 to $999
- 83$1,000 to $1,249
- 8$1,250 to $1,499
- 52$1,500 to $1,999
- 146$2,000 or more

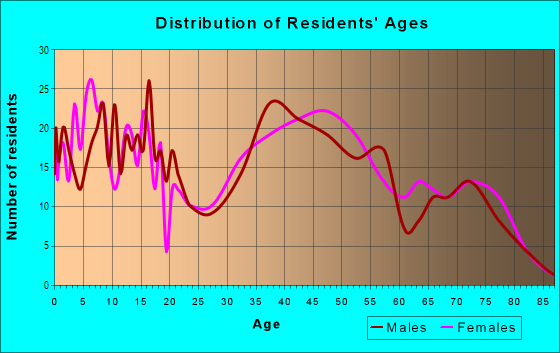
| Males: | 1,087 |
| Females: | 1,051 |
Males:
| This neighborhood: | 44.2 years |
| Whole city: | 40.2 years |
| This neighborhood: | 38.2 years |
| Whole city: | 43.0 years |
Average household size:
| Lions Park: | 2.7 people |
| Mount Prospect: | 2.6 people |
Percentage of family households:
| Lions Park: | 54.5% |
| Mount Prospect: | 47.7% |
| Here: | 71.4% |
| Mount Prospect: | 56.3% |
Percentage of married-couple families with children (among all households):
| Lions Park: | 41.0% |
| Mount Prospect: | 33.0% |
Percentage of single-mother households (among all households):
| Lions Park: | 9.7% |
| Mount Prospect: | 5.6% |
Percentage of never married males 15 years old and over:
Percentage of never married females 15 years old and over:
| Lions Park: | 11.7% |
| Mount Prospect: | 14.5% |
Percentage of never married females 15 years old and over:
| Lions Park: | 8.6% |
| village: | 11.8% |
Percentage of people that speak English not well or not at all:
| Lions Park: | 1.5% |
| Mount Prospect: | 7.1% |
Percentage of people born in this state:
Percentage of people born in another U.S. state:
Percentage of native residents but born outside the U.S.:
Percentage of foreign born residents:
| Here: | 75.6% |
| Mount Prospect: | 59.4% |
Percentage of people born in another U.S. state:
| Lions Park: | 15.3% |
| Mount Prospect: | 9.8% |
Percentage of native residents but born outside the U.S.:
| Here: | 0.7% |
| village: | 0.8% |
Percentage of foreign born residents:
| Here: | 8.4% |
| Mount Prospect: | 30.0% |

Owner-occupied
Renter-occupied


- Rooms in owner-occupied houses and condos in Lions Park
- 1051 room
- 362 rooms
- 123 rooms
- 844 rooms
- 935 rooms
- 2126 rooms
- 1877 rooms
- 1768 rooms
- 1379+ rooms

- Rooms in renter-occupied apartments in Lions Park
- 121 room
- 342 rooms
- 803 rooms
- 264 rooms
- 315 rooms
- 366 rooms
- 537 rooms
- 118 rooms
- 59+ rooms
Owner-occupied
Renter-occupied

- Bedrooms in owner-occupied houses and condos in Lions Park
- 142no bedroom
- 281 bedroom
- 482 bedrooms
- 5343 bedrooms
- 1444 bedrooms
- 425+ bedrooms

- Bedrooms in renter-occupied apartments in Lions Park
- 12no bedroom
- 1031 bedroom
- 472 bedrooms
- 1233 bedrooms
- 134 bedrooms
- 05+ bedrooms
Average number of cars or other vehicles available in houses/condos:
Average number of cars or other vehicles available in apartments:
| This neighborhood: | 2.0 |
| Mount Prospect: | 1.9 |
Average number of cars or other vehicles available in apartments:
| Here: | |
| village: |
Percentage of units with a mortgage:
| Lions Park: | 64.2% |
| Mount Prospect: | 59.5% |
Average estimated value of detached houses in 2022 (77.5% of all units):
| Lions Park: | $387,194 |
| Illinois: | $310,164 |

- Year house built in Lions Park
- 552020 or later
- 172010 to 2019
- 1152000 to 2009
- 471990 to 1999
- 981980 to 1989
- 1201970 to 1979
- 1761960 to 1969
- 5021950 to 1959
- 481940 to 1949
- 1091939 or earlier

City-data.com crime index for village in 2020 (higher means more crime):
| City: | 52.8 |
| U.S. average: | 219.5 |
Travel time to work (commute)
![Travel time to work (commute)]()
- 5Less than 5 minutes
- 875 to 9 minutes
- 12110 to 14 minutes
- 8315 to 19 minutes
- 12320 to 24 minutes
- 8825 to 29 minutes
- 15030 to 34 minutes
- 4235 to 39 minutes
- 4940 to 44 minutes
- 21345 to 59 minutes
- 9760 to 89 minutes
- 2790 or more minutes

Means of transportation to work
![Means of transportation to work]()
- 72.4%818Drove a car alone
- 6.6%75Carpooled
- 3.6%41Subway or elevated rail
- 11.2%127Long-distance train or commuter rail
- 0.4%5Taxi
- 0.8%9Bicycle
- 1.8%20Walked
- 0.5%6Other means
- 15.6%176Worked at home

Time leaving home to go to work
![Time leaving home to go to work]()
- 2512:00 a.m. to 4:59 a.m.
- 195:00 a.m. to 5:29 a.m.
- 525:30 a.m. to 5:59 a.m.
- 746:00 a.m. to 6:29 a.m.
- 1356:30 a.m. to 6:59 a.m.
- 2077:00 a.m. to 7:29 a.m.
- 1387:30 a.m. to 7:59 a.m.
- 1328:00 a.m. to 8:29 a.m.
- 308:30 a.m. to 8:59 a.m.
- 549:00 a.m. to 9:59 a.m.
- 1510:00 a.m. to 10:59 a.m.
- 811:00 a.m. to 11:59 a.m.
- 8812:00 p.m. to 3:59 p.m.
- 524:00 p.m. to 11:59 p.m.

Occupations of males:
- Percentage of males in management occupations (except farmers):
Here: 14.8% village: 15.1%
- Percentage of males in business and financial operations occupations:
Here: 9.3% village: 5.5%
- Percentage of males in computer and mathematical occupations:
Here: 2.2% village: 6.6%
- Percentage of males in life, physical, and social science occupations:
Here: 1.5% village: 0.8%
- Percentage of males in community and social services occupations:
Here: 2.9% village: 0.7%
- Percentage of males in legal occupations:
Here: 2.4% village: 1.5%
- Percentage of males in education, training, and library occupations:
Here: 8.5% village: 3.3%
- Percentage of males in arts, design, entertainment, sports, and media occupations:
Here: 7.8% village: 2.0%
- Percentage of males in healthcare practitioners and technical occupations:
Here: 2.9% village: 3.6%
- Percentage of males in service occupations:
Here: 11.2% village: 12.2%
- Percentage of males in sales and office occupations:
Here: 11.1% village: 12.8%
- Percentage of males in construction, extraction, and maintenance occupations:
Here: 4.7% village: 8.6%
- Percentage of males in production occupations:
Here: 2.1% village: 9.5%
- Percentage of males in transportation occupations:
Here: 2.2% village: 6.3%
- Percentage of males in material moving occupations:
Here: 1.8% village: 3.6%
Occupations of females:
- Percentage of females in management occupations (except farmers):
Here: 10.5% village: 12.7%
- Percentage of females in business and financial operations occupations:
Here: 12.5% village: 7.9%
- Percentage of females in computer and mathematical occupations:
Here: 2.8% village: 3.8%
- Percentage of females in community and social services occupations:
Here: 5.6% village: 1.0%
- Percentage of females in legal occupations:
Here: 2.3% village: 1.1%
- Percentage of females in education, training, and library occupations:
Here: 18.0% village: 9.9%
- Percentage of females in arts, design, entertainment, sports, and media occupations:
Here: 1.3% village: 1.5%
- Percentage of females in healthcare practitioners and technical occupations:
Here: 9.0% village: 10.6%
- Percentage of females in sales and office occupations:
Here: 22.3% village: 28.0%
- Percentage of females in production occupations:
Here: 14.6% village: 4.6%
Education in this neighborhood (subdivision or community):
- Percentage of people 3 years and older in K-12 schools:
Lions Park: 25.6% Mount Prospect: 16.1%
- Percentage of people 3 years and older in undergraduate colleges:
Lions Park: 5.5% Mount Prospect: 3.5%
- Percentage of people 3 years and older in grad. or professional schools:
Lions Park: 3.2% Mount Prospect: 1.5%
- Percentage of students K-12 enrolled in private schools:
Lions Park: 67.0% Mount Prospect: 7.9%
Percentage of population below poverty level:
| Lions Park: | 4.4% |
| Mount Prospect: | 5.0% |
Median year owner moved in (as recorded in 2022):
| Lions Park: | 2005 |
| Mount Prospect: | 2005 |
Percentage of married-couple families with both working:
| Lions Park: | 110.3% |
| Mount Prospect: | 71.6% |

- 76.4%Utility gas
- 9.2%Electricity
- 6.5%Bottled, tank, or LP gas
- 4.3%No fuel used
- 3.6%Wood
Highways in this neighborhood:
S Elmhurst Rd (State Rte 83, Elmhurst Rd)
Length: 0.30 miles
Direction: N-S
Address range: 400 to 607
Direction: N-S
Address range: 400 to 607
State Rte 83 (W Lincoln St)
Length: 0.30 miles
Directions: E-W, SE-NW, SW-NE
Address range: 1 to 299
Directions: E-W, SE-NW, SW-NE
Address range: 1 to 299
Roads and streets:
E Council Trl
Length: 0.92 miles
Direction: E-W
Address range: 1 to 1099
Direction: E-W
Address range: 1 to 1099
E Berkshire Ln
Length: 0.58 miles
Directions: E-W, SE-NW
Address range: 1 to 599
Directions: E-W, SE-NW
Address range: 1 to 599
E Lincoln St
Length: 0.57 miles
Directions: E-W, SE-NW
Address range: 1 to 599
Directions: E-W, SE-NW
Address range: 1 to 599
E Shabonee Trl
Length: 0.53 miles
Directions: E-W, SW-NE
Address range: 1 to 799
Directions: E-W, SW-NE
Address range: 1 to 799
E Prospect Ave
Length: 0.46 miles
Direction: SE-NW
Direction: SE-NW
S Edward St
Length: 0.44 miles
Directions: N-S, SW-NE
Address range: 400 to 699
Directions: N-S, SW-NE
Address range: 400 to 699
S William St
Length: 0.42 miles
Direction: N-S
Address range: 414 to 799
Direction: N-S
Address range: 414 to 799
S George St
Length: 0.41 miles
Directions: N-S, SW-NE
Address range: 500 to 699
Directions: N-S, SW-NE
Address range: 500 to 699
S Louis St
Length: 0.37 miles
Direction: N-S
Address range: 500 to 799
Direction: N-S
Address range: 500 to 799
S Albert St
Length: 0.37 miles
Directions: N-S, SW-NE
Address range: 500 to 699
Directions: N-S, SW-NE
Address range: 500 to 699
S Wille St
Length: 0.36 miles
Direction: N-S
Address range: 400 to 699
Direction: N-S
Address range: 400 to 699
S Maple St
Length: 0.35 miles
Directions: N-S, SW-NE
Address range: 400 to 699
Directions: N-S, SW-NE
Address range: 400 to 699
S Main St
Length: 0.35 miles
Direction: N-S
Address range: 400 to 699
Direction: N-S
Address range: 400 to 699
S Emerson St
Length: 0.34 miles
Direction: N-S
Address range: 400 to 655
Direction: N-S
Address range: 400 to 655
S Owen St
Length: 0.33 miles
Directions: N-S, SW-NE
Address range: 500 to 799
Directions: N-S, SW-NE
Address range: 500 to 799
S Mount Prospect Rd
Length: 0.31 miles
Direction: N-S
Address range: 9 to 99
Direction: N-S
Address range: 9 to 99
S Pine St
Length: 0.31 miles
Directions: N-S, SE-NW
Address range: 400 to 699
Directions: N-S, SE-NW
Address range: 400 to 699
S School St
Length: 0.30 miles
Directions: N-S, SE-NW, SW-NE
Address range: 500 to 707
Directions: N-S, SE-NW, SW-NE
Address range: 500 to 707
W Shabonee Trl
Length: 0.29 miles
Direction: E-W
Address range: 1 to 299
Direction: E-W
Address range: 1 to 299
W Council Trl
Length: 0.29 miles
Direction: E-W
Address range: 1 to 299
Direction: E-W
Address range: 1 to 299
Marina Dr (S Marina Dr)
Length: 0.28 miles
Direction: N-S
Address range: 1 to 599
Direction: N-S
Address range: 1 to 599
Inner Cir (Inner Circle Dr)
Length: 0.23 miles
Direction: N-S
Address range: 1 to 199
Direction: N-S
Address range: 1 to 199
W Berkshire Ln
Length: 0.21 miles
Directions: E-W, SE-NW
Address range: 1 to 199
Directions: E-W, SE-NW
Address range: 1 to 199
S Elm St
Length: 0.12 miles
Directions: N-S, SW-NE
Address range: 600 to 699
Directions: N-S, SW-NE
Address range: 600 to 699
Morgan O Brien
Length: 0.11 miles
Direction: E-W
Direction: E-W
E Moehling Dr
Length: 0.06 miles
Directions: E-W, SW-NE
Address range: 200 to 299
Directions: E-W, SW-NE
Address range: 200 to 299
S Elmhurst Rd
Length: 0.04 miles
Directions: N-S, SW-NE
Directions: N-S, SW-NE
S Inner Circle Dr
Length: 0.03 miles
Direction: N-S
Address range: 500 to 599
Direction: N-S
Address range: 500 to 599
Railroad features:
Chicago and North Western RR
Length: 0.45 miles
Direction: SE-NW
Direction: SE-NW
Other features:
Wellers Crk
Length: 0.51 miles
Directions: E-W, SE-NW
Directions: E-W, SE-NW