Glenmont Village neighborhood in Silver Spring, Maryland (MD), 20902, 20906 detailed profile
Settings
X


Business Search - 14 Million verified businesses
Area: 0.518 square miles
Population: 3,594
Population density:
| Glenmont Village: | 6,932 people per square mile |
| Silver Spring: | 7,993 people per square mile |

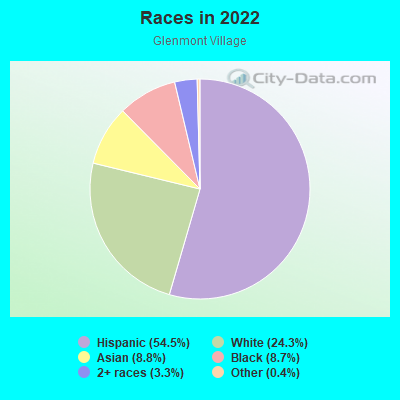
- 1,98654.5%Hispanic or Latino
- 88724.3%White
- 3208.8%Asian
- 3178.7%Black
- 1223.3%Two or more races
- 150.4%Some other race
Median household income in 2022:
| Glenmont Village: | $151,441 |
| Silver Spring: | $81,557 |
Distribution of median household income
![Distribution of median household income]()
- 30Less than $10,000
- 30$10,000 to $19,999
- 88$20,000 to $29,999
- 105$30,000 to $39,999
- 73$40,000 to $49,999
- 73$50,000 to $59,999
- 105$60,000 to $74,999
- 142$75,000 to $99,999
- 133$100,000 to $124,999
- 131$125,000 to $149,999
- 220$150,000 to $199,999
- 150$200,000 or more

Distribution of owner-occupied house/condo value
![Distribution of owner-occupied house/condo value]()
- 60Less than $50,000
- 30$50,000 to $99,999
- 16$150,000 to $199,999
- 69$200,000 to $249,999
- 106$250,000 to $299,999
- 222$300,000 to $399,999
- 314$400,000 to $499,999
- 256$500,000 to $749,999
- 29$750,000 to $999,999
- 19$1,000,000 or more

Distribution of rent paid by renters
![Distribution of rent paid by renters]()
- 1$400 to $499
- 11$600 to $699
- 5$800 to $899
- 28$900 to $999
- 60$1,000 to $1,249
- 28$1,250 to $1,499
- 97$1,500 to $1,999
- 109$2,000 or more

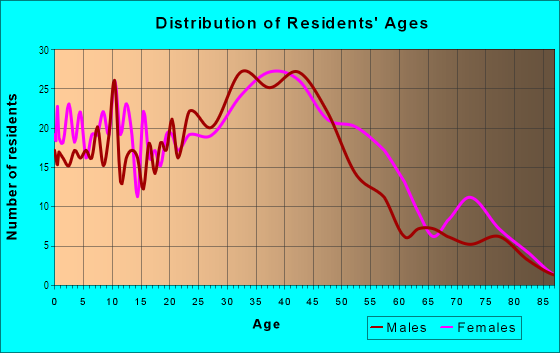
| Males: | 1,923 |
| Females: | 1,671 |
Males:
| This neighborhood: | 46.0 years |
| Whole city: | 36.7 years |
| This neighborhood: | 41.9 years |
| Whole city: | 36.5 years |
Average household size:
| Glenmont Village: | 3.0 people |
| Silver Spring: | 2.2 people |
Percentage of family households:
| Glenmont Village: | 49.9% |
| Silver Spring: | 38.8% |
| Here: | 54.5% |
| Silver Spring: | 32.5% |
Percentage of married-couple families with children (among all households):
| Glenmont Village: | 21.4% |
| Silver Spring: | 34.5% |
Percentage of single-mother households (among all households):
| Glenmont Village: | 6.2% |
| Silver Spring: | 6.6% |
Percentage of never married males 15 years old and over:
Percentage of never married females 15 years old and over:
| Glenmont Village: | 17.2% |
| Silver Spring: | 22.2% |
Percentage of never married females 15 years old and over:
| Glenmont Village: | 12.9% |
| place: | 24.3% |
Percentage of people that speak English not well or not at all:
| Glenmont Village: | 16.1% |
| Silver Spring: | 9.9% |
Percentage of people born in this state:
Percentage of people born in another U.S. state:
Percentage of native residents but born outside the U.S.:
Percentage of foreign born residents:
| Here: | 27.8% |
| Silver Spring: | 19.7% |
Percentage of people born in another U.S. state:
| Glenmont Village: | 25.8% |
| Silver Spring: | 45.9% |
Percentage of native residents but born outside the U.S.:
| Here: | 1.2% |
| place: | 2.4% |
Percentage of foreign born residents:
| Here: | 45.2% |
| Silver Spring: | 32.0% |

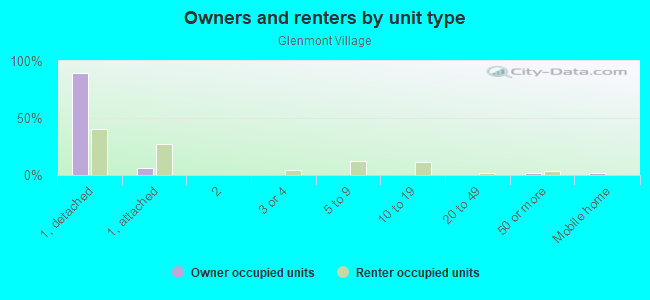
Owner-occupied
Renter-occupied

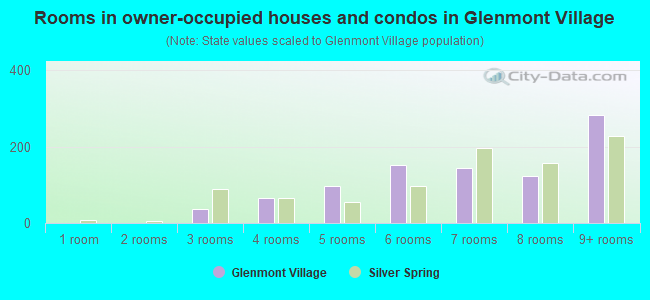
- Rooms in owner-occupied houses and condos in Glenmont Village
- 01 room
- 02 rooms
- 373 rooms
- 654 rooms
- 985 rooms
- 1516 rooms
- 1447 rooms
- 1248 rooms
- 2839+ rooms
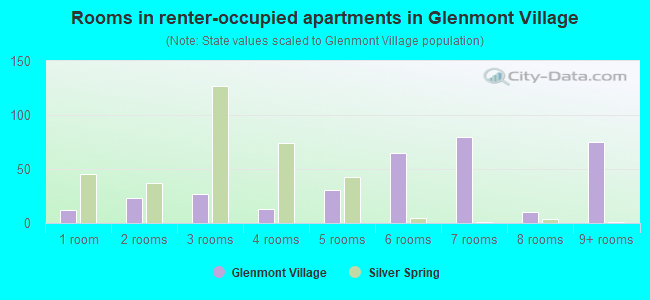
- Rooms in renter-occupied apartments in Glenmont Village
- 121 room
- 232 rooms
- 273 rooms
- 134 rooms
- 315 rooms
- 656 rooms
- 807 rooms
- 108 rooms
- 759+ rooms
Owner-occupied
Renter-occupied
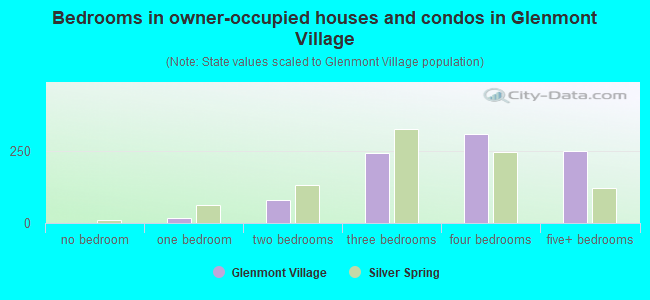
- Bedrooms in owner-occupied houses and condos in Glenmont Village
- 0no bedroom
- 161 bedroom
- 792 bedrooms
- 2433 bedrooms
- 3074 bedrooms
- 2515+ bedrooms

- Bedrooms in renter-occupied apartments in Glenmont Village
- 12no bedroom
- 291 bedroom
- 182 bedrooms
- 1573 bedrooms
- 624 bedrooms
- 585+ bedrooms
Average number of cars or other vehicles available in houses/condos:
Average number of cars or other vehicles available in apartments:
| This neighborhood: | 3.2 |
| Silver Spring: | 1.7 |
Average number of cars or other vehicles available in apartments:
| Here: | 3.0 |
| place: | 0.9 |
Percentage of units with a mortgage:
| Glenmont Village: | 68.7% |
| Silver Spring: | 76.3% |
Average estimated value of detached houses in 2022 (92.5% of all units):
| Glenmont Village: | $449,210 |
| Maryland: | $526,819 |
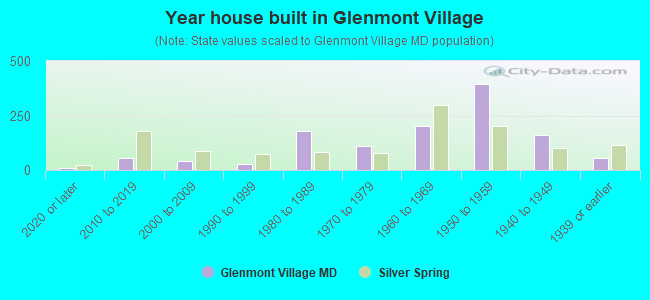
- Year house built in Glenmont Village
- 112020 or later
- 542010 to 2019
- 422000 to 2009
- 281990 to 1999
- 1781980 to 1989
- 1101970 to 1979
- 2031960 to 1969
- 3941950 to 1959
- 1591940 to 1949
- 541939 or earlier
Travel time to work (commute)
![Travel time to work (commute)]()
- 18Less than 5 minutes
- 435 to 9 minutes
- 10610 to 14 minutes
- 20115 to 19 minutes
- 24920 to 24 minutes
- 15425 to 29 minutes
- 30830 to 34 minutes
- 10335 to 39 minutes
- 12140 to 44 minutes
- 36445 to 59 minutes
- 22360 to 89 minutes
- 8190 or more minutes

Means of transportation to work
![Means of transportation to work]()
- 55.0%1,102Drove a car alone
- 19.7%394Carpooled
- 5.1%102Bus
- 6.7%134Subway or elevated rail
- 1.1%22Long-distance train or commuter rail
- 1.8%37Taxi
- 1.9%38Walked
- 1.1%23Other means
- 10.2%205Worked at home

Time leaving home to go to work
![Time leaving home to go to work]()
- 4912:00 a.m. to 4:59 a.m.
- 1365:00 a.m. to 5:29 a.m.
- 1085:30 a.m. to 5:59 a.m.
- 2696:00 a.m. to 6:29 a.m.
- 1026:30 a.m. to 6:59 a.m.
- 3187:00 a.m. to 7:29 a.m.
- 1377:30 a.m. to 7:59 a.m.
- 1858:00 a.m. to 8:29 a.m.
- 1378:30 a.m. to 8:59 a.m.
- 1639:00 a.m. to 9:59 a.m.
- 7810:00 a.m. to 10:59 a.m.
- 3311:00 a.m. to 11:59 a.m.
- 12112:00 p.m. to 3:59 p.m.
- 724:00 p.m. to 11:59 p.m.

Occupations of males:
- Percentage of males in management occupations (except farmers):
Here: 8.3% place: 11.4%
- Percentage of males in business and financial operations occupations:
Here: 4.3% place: 6.8%
- Percentage of males in computer and mathematical occupations:
Here: 6.2% place: 9.4%
- Percentage of males in life, physical, and social science occupations:
Here: 1.0% place: 5.3%
- Percentage of males in education, training, and library occupations:
Here: 2.4% place: 6.2%
- Percentage of males in arts, design, entertainment, sports, and media occupations:
Here: 1.1% place: 3.9%
- Percentage of males in service occupations:
Here: 23.5% place: 10.9%
- Percentage of males in sales and office occupations:
Here: 11.0% place: 9.6%
- Percentage of males in construction, extraction, and maintenance occupations:
Here: 14.7% place: 11.6%
- Percentage of males in production occupations:
Here: 6.0% place: 2.2%
- Percentage of males in transportation occupations:
Here: 9.1% place: 6.4%
- Percentage of males in material moving occupations:
Here: 2.4% place: 2.2%
Occupations of females:
- Percentage of females in management occupations (except farmers):
Here: 10.1% place: 13.0%
- Percentage of females in business and financial operations occupations:
Here: 2.7% place: 8.9%
- Percentage of females in computer and mathematical occupations:
Here: 4.0% place: 5.0%
- Percentage of females in life, physical, and social science occupations:
Here: 3.5% place: 3.4%
- Percentage of females in legal occupations:
Here: 5.3% place: 4.2%
- Percentage of females in education, training, and library occupations:
Here: 6.5% place: 11.2%
- Percentage of females in arts, design, entertainment, sports, and media occupations:
Here: 4.0% place: 4.5%
- Percentage of females in healthcare practitioners and technical occupations:
Here: 6.0% place: 5.3%
- Percentage of females in service occupations:
Here: 35.7% place: 20.4%
- Percentage of females in sales and office occupations:
Here: 15.2% place: 16.7%
- Percentage of females in production occupations:
Here: 4.0% place: 0.9%
- Percentage of females in transportation occupations:
Here: 1.4% place: 0.6%
Percentage of people 16-64 in Armed Forces:
| Glenmont Village: | 0.8% |
| Silver Spring: | 0.4% |
Education in this neighborhood (subdivision or community):
- Percentage of people 3 years and older in K-12 schools:
Glenmont Village: 21.1% Silver Spring: 14.1%
- Percentage of people 3 years and older in undergraduate colleges:
Glenmont Village: 4.5% Silver Spring: 3.4%
- Percentage of people 3 years and older in grad. or professional schools:
Glenmont Village: 2.1% Silver Spring: 2.0%
- Percentage of students K-12 enrolled in private schools:
Glenmont Village: 36.1% Silver Spring: 12.6%
Percentage of population below poverty level:
| Glenmont Village: | 5.9% |
| Silver Spring: | 11.0% |
Median year owner moved in (as recorded in 2022):
| Glenmont Village: | 2006 |
| Silver Spring: | 2011 |
Percentage of married-couple families with both working:
| Glenmont Village: | 77.0% |
| Silver Spring: | 80.2% |
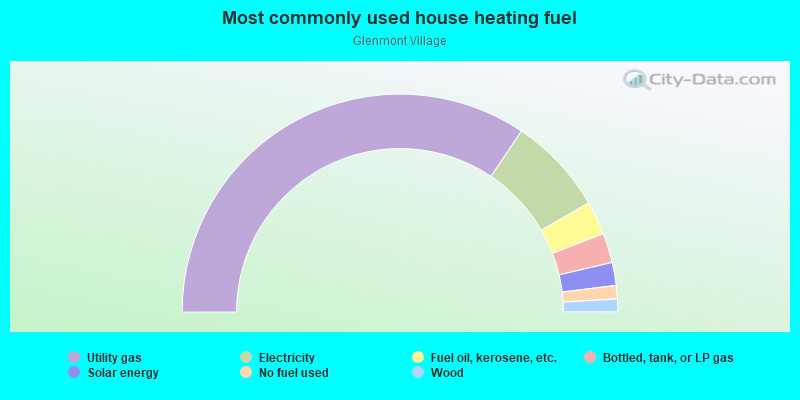
- 68.9%Utility gas
- 14.5%Electricity
- 5.0%Fuel oil, kerosene, etc.
- 4.4%Bottled, tank, or LP gas
- 3.4%Solar energy
- 2.0%No fuel used
- 1.9%Wood
Highways in this neighborhood:
Georgia Ave (State Hwy 97)
Length: 0.83 miles
Directions: N-S, SE-NW
Address range: 12300 to 12851
Directions: N-S, SE-NW
Address range: 12300 to 12851
Layhill Rd (State Hwy 182)
Length: 0.32 miles
Directions: N-S, SW-NE
Address range: 12400 to 12798
Directions: N-S, SW-NE
Address range: 12400 to 12798
Roads and streets:
Randolph Rd
Length: 1.42 miles
Directions: E-W, SW-NE
Address range: 2027 to 3199
Directions: E-W, SW-NE
Address range: 2027 to 3199
Glenallan Ave (Glenallen Ave)
Length: 0.76 miles
Directions: E-W, SE-NW, SW-NE
Address range: 2100 to 2699
Directions: E-W, SE-NW, SW-NE
Address range: 2100 to 2699
Sheraton St
Length: 0.75 miles
Directions: E-W, SE-NW, SW-NE
Address range: 2400 to 2999
Directions: E-W, SE-NW, SW-NE
Address range: 2400 to 2999
Urbana Dr
Length: 0.63 miles
Directions: E-W, SW-NE
Address range: 2500 to 2899
Directions: E-W, SW-NE
Address range: 2500 to 2899
Denley Rd
Length: 0.54 miles
Directions: E-W, N-S, SW-NE
Address range: 12400 to 12699
Directions: E-W, N-S, SW-NE
Address range: 12400 to 12699
Terrapin Rd
Length: 0.45 miles
Directions: E-W, N-S, SE-NW, SW-NE
Address range: 2600 to 2899
Directions: E-W, N-S, SE-NW, SW-NE
Address range: 2600 to 2899
Greenery Ln
Length: 0.37 miles
Directions: E-W, SE-NW
Address range: 2100 to 2316
Directions: E-W, SE-NW
Address range: 2100 to 2316
Flack St
Length: 0.32 miles
Direction: SE-NW
Address range: 12400 to 12699
Direction: SE-NW
Address range: 12400 to 12699
Atlanta Dr
Length: 0.28 miles
Directions: E-W, SW-NE
Address range: 2700 to 2839
Directions: E-W, SW-NE
Address range: 2700 to 2839
Denley Pl
Length: 0.23 miles
Directions: E-W, SW-NE
Address range: 2800 to 2899
Directions: E-W, SW-NE
Address range: 2800 to 2899
Livingston St
Length: 0.23 miles
Directions: N-S, SW-NE
Address range: 12306 to 12599
Directions: N-S, SW-NE
Address range: 12306 to 12599
Glenfield Mews Dr
Length: 0.23 miles
Directions: N-S, SE-NW, SW-NE
Directions: N-S, SE-NW, SW-NE
Judson Rd
Length: 0.21 miles
Directions: N-S, SW-NE
Address range: 12300 to 12399
Directions: N-S, SW-NE
Address range: 12300 to 12399
Holdridge Rd
Length: 0.16 miles
Direction: SE-NW
Address range: 12500 to 12599
Direction: SE-NW
Address range: 12500 to 12599
Epping Ter
Length: 0.15 miles
Direction: SE-NW
Address range: 12700 to 12899
Direction: SE-NW
Address range: 12700 to 12899
Ara Dr
Length: 0.14 miles
Direction: SW-NE
Direction: SW-NE
Glenmont Cir
Length: 0.03 miles
Direction: SE-NW
Direction: SE-NW
Epping Rd
Length: 0.02 miles
Direction: SW-NE
Address range: 12726 to 12799
Direction: SW-NE
Address range: 12726 to 12799