Fenwick Park neighborhood in Falls Church, Virginia (VA), 22042 detailed profile
Settings
X


Business Search - 14 Million verified businesses
Area: 0.251 square miles
Population: 2,507
Population density:
| Fenwick Park: | 9,975 people per square mile |
| Falls Church: | 7,340 people per square mile |

- 1,39455.1%Hispanic or Latino
- 72228.6%White
- 25310.0%Asian
- 833.3%Black
- 522.1%Two or more races
- 240.9%Some other race

Median household income in 2022:
| Fenwick Park: | $109,876 |
| Falls Church: | $164,536 |
Distribution of median household income
![Distribution of median household income]()
- 23Less than $10,000
- 17$10,000 to $19,999
- 23$20,000 to $29,999
- 21$30,000 to $39,999
- 33$40,000 to $49,999
- 62$50,000 to $59,999
- 117$60,000 to $74,999
- 34$75,000 to $99,999
- 181$100,000 to $124,999
- 41$125,000 to $149,999
- 91$150,000 to $199,999
- 109$200,000 or more

Distribution of owner-occupied house/condo value
![Distribution of owner-occupied house/condo value]()
- 17$50,000 to $99,999
- 33$100,000 to $149,999
- 86$150,000 to $199,999
- 15$250,000 to $299,999
- 17$300,000 to $399,999
- 16$400,000 to $499,999
- 230$500,000 to $749,999
- 28$750,000 to $999,999
- 39$1,000,000 or more

Distribution of rent paid by renters
![Distribution of rent paid by renters]()
- 15$300 to $399
- 18$500 to $599
- 9$900 to $999
- 62$1,000 to $1,249
- 29$1,250 to $1,499
- 175$1,500 to $1,999
- 213$2,000 or more

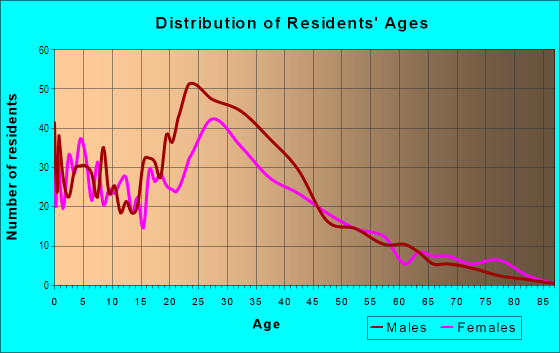
| Males: | 1,373 |
| Females: | 1,134 |
Males:
| This neighborhood: | 37.7 years |
| Whole city: | 36.7 years |
| This neighborhood: | 28.7 years |
| Whole city: | 41.5 years |
Average household size:
| Fenwick Park: | 3.4 people |
| Falls Church: | 2.5 people |
Percentage of family households:
| Fenwick Park: | 64.7% |
| Falls Church: | 46.0% |
| Here: | 57.5% |
| Falls Church: | 51.5% |
Percentage of married-couple families with children (among all households):
| Fenwick Park: | 21.5% |
| Falls Church: | 33.1% |
Percentage of single-mother households (among all households):
| Fenwick Park: | 3.2% |
| Falls Church: | 4.7% |
Percentage of never married males 15 years old and over:
Percentage of never married females 15 years old and over:
| Fenwick Park: | 23.6% |
| Falls Church: | 17.9% |
Percentage of never married females 15 years old and over:
| Fenwick Park: | 18.5% |
| city: | 16.2% |
Percentage of people that speak English not well or not at all:
| Fenwick Park: | 27.5% |
| Falls Church: | 2.2% |
Percentage of people born in this state:
Percentage of people born in another U.S. state:
Percentage of native residents but born outside the U.S.:
Percentage of foreign born residents:
| Here: | 24.5% |
| Falls Church: | 26.5% |
Percentage of people born in another U.S. state:
| Fenwick Park: | 26.0% |
| Falls Church: | 54.2% |
Percentage of native residents but born outside the U.S.:
| Here: | 1.0% |
| city: | 3.7% |
Percentage of foreign born residents:
| Here: | 48.5% |
| Falls Church: | 15.5% |

Owner-occupied
Renter-occupied


- Rooms in owner-occupied houses and condos in Fenwick Park
- 01 room
- 52 rooms
- 503 rooms
- 214 rooms
- 615 rooms
- 816 rooms
- 277 rooms
- 638 rooms
- 529+ rooms

- Rooms in renter-occupied apartments in Fenwick Park
- 211 room
- 252 rooms
- 453 rooms
- 974 rooms
- 1915 rooms
- 316 rooms
- 957 rooms
- 478 rooms
- 279+ rooms
Owner-occupied
Renter-occupied

- Bedrooms in owner-occupied houses and condos in Fenwick Park
- 75no bedroom
- 111 bedroom
- 292 bedrooms
- 1073 bedrooms
- 1534 bedrooms
- 935+ bedrooms

- Bedrooms in renter-occupied apartments in Fenwick Park
- 21no bedroom
- 751 bedroom
- 1582 bedrooms
- 1943 bedrooms
- 504 bedrooms
- 655+ bedrooms
Average number of cars or other vehicles available in houses/condos:
Average number of cars or other vehicles available in apartments:
| This neighborhood: | 2.6 |
| Falls Church: | 1.9 |
Average number of cars or other vehicles available in apartments:
| Here: | 1.8 |
| city: | 1.4 |
Percentage of units with a mortgage:
| Fenwick Park: | 87.0% |
| Falls Church: | 70.0% |
Average estimated value of detached houses in 2022 (56.5% of all units):
| Fenwick Park: | $686,769 |
| Virginia: | $472,865 |

- Year house built in Fenwick Park
- 02020 or later
- 272010 to 2019
- 712000 to 2009
- 381990 to 1999
- 461980 to 1989
- 941970 to 1979
- 881960 to 1969
- 1471950 to 1959
- 2651940 to 1949
- 181939 or earlier

City-data.com crime index for city in 2020 (higher means more crime):
| City: | 120.0 |
| U.S. average: | 219.5 |
Travel time to work (commute)
![Travel time to work (commute)]()
- 92Less than 5 minutes
- 935 to 9 minutes
- 7510 to 14 minutes
- 12315 to 19 minutes
- 24920 to 24 minutes
- 6325 to 29 minutes
- 18730 to 34 minutes
- 1735 to 39 minutes
- 4440 to 44 minutes
- 14145 to 59 minutes
- 32960 to 89 minutes
- 14590 or more minutes

Means of transportation to work
![Means of transportation to work]()
- 61.3%918Drove a car alone
- 8.3%124Carpooled
- 10.1%151Bus
- 5.0%75Subway or elevated rail
- 0.5%8Long-distance train or commuter rail
- 0.4%6Bicycle
- 3.1%47Walked
- 1.1%16Other means
- 13.5%202Worked at home

Time leaving home to go to work
![Time leaving home to go to work]()
- 4912:00 a.m. to 4:59 a.m.
- 1045:00 a.m. to 5:29 a.m.
- 155:30 a.m. to 5:59 a.m.
- 2386:00 a.m. to 6:29 a.m.
- 626:30 a.m. to 6:59 a.m.
- 2957:00 a.m. to 7:29 a.m.
- 1617:30 a.m. to 7:59 a.m.
- 1478:00 a.m. to 8:29 a.m.
- 548:30 a.m. to 8:59 a.m.
- 2529:00 a.m. to 9:59 a.m.
- 2810:00 a.m. to 10:59 a.m.
- 911:00 a.m. to 11:59 a.m.
- 12412:00 p.m. to 3:59 p.m.
- 714:00 p.m. to 11:59 p.m.

Occupations of males:
- Percentage of males in management occupations (except farmers):
Here: 2.5% city: 24.7%
- Percentage of males in business and financial operations occupations:
Here: 12.6% city: 9.3%
- Percentage of males in computer and mathematical occupations:
Here: 4.6% city: 15.0%
- Percentage of males in architecture and engineering occupations:
Here: 1.2% city: 3.6%
- Percentage of males in service occupations:
Here: 26.7% city: 7.4%
- Percentage of males in sales and office occupations:
Here: 14.3% city: 12.4%
- Percentage of males in construction, extraction, and maintenance occupations:
Here: 28.7% city: 4.0%
- Percentage of males in transportation occupations:
Here: 4.6% city: 0.5%
- Percentage of males in material moving occupations:
Here: 2.6% city: 2.9%
Occupations of females:
- Percentage of females in management occupations (except farmers):
Here: 11.6% city: 15.1%
- Percentage of females in business and financial operations occupations:
Here: 8.7% city: 14.3%
- Percentage of females in community and social services occupations:
Here: 1.2% city: 1.9%
- Percentage of females in education, training, and library occupations:
Here: 25.7% city: 10.6%
- Percentage of females in healthcare practitioners and technical occupations:
Here: 3.0% city: 9.4%
- Percentage of females in service occupations:
Here: 20.5% city: 12.6%
- Percentage of females in sales and office occupations:
Here: 12.6% city: 15.9%
- Percentage of females in construction, extraction, and maintenance occupations:
Here: 9.7% city: 0.0%
- Percentage of females in production occupations:
Here: 3.8% city: 0.0%
- Percentage of females in material moving occupations:
Here: 1.1% city: 0.5%
Percentage of people 16-64 in Armed Forces:
| Fenwick Park: | 0.4% |
| Falls Church: | 1.3% |
Education in this neighborhood (subdivision or community):
- Percentage of people 3 years and older in K-12 schools:
Fenwick Park: 20.8% Falls Church: 21.3%
- Percentage of people 3 years and older in undergraduate colleges:
Fenwick Park: 7.5% Falls Church: 4.5%
- Percentage of people 3 years and older in grad. or professional schools:
Fenwick Park: 1.2% Falls Church: 2.0%
- Percentage of students K-12 enrolled in private schools:
Fenwick Park: 17.0% Falls Church: 11.0%
Percentage of population below poverty level:
| Fenwick Park: | 10.0% |
| Falls Church: | 2.3% |
Median year owner moved in (as recorded in 2022):
Median year renter moved in (as recorded in 2022):
| Fenwick Park: | 2008 |
| Falls Church: | 2010 |
Median year renter moved in (as recorded in 2022):
| Fenwick Park: | 2018 |
| Falls Church: | 2018 |
Percentage of married-couple families with both working:
| Fenwick Park: | 102.8% |
| Falls Church: | 77.3% |

- 52.7%Utility gas
- 43.8%Electricity
- 3.5%Bottled, tank, or LP gas
Highways in this neighborhood:
US Hwy 50 (Arlington Blvd)
Length: 0.58 miles
Direction: E-W
Address range: 7232 to 7498
Direction: E-W
Address range: 7232 to 7498
Roads and streets:
Monticello Dr
Length: 0.62 miles
Directions: E-W, N-S, SE-NW, SW-NE
Address range: 2900 to 3198
Directions: E-W, N-S, SE-NW, SW-NE
Address range: 2900 to 3198
Graham Rd
Length: 0.57 miles
Directions: N-S, SW-NE
Address range: 2937 to 3138
Directions: N-S, SW-NE
Address range: 2937 to 3138
Tyler Ave
Length: 0.43 miles
Directions: E-W, SE-NW
Address range: 7100 to 7399
Directions: E-W, SE-NW
Address range: 7100 to 7399
Elmwood Dr
Length: 0.38 miles
Directions: E-W, SW-NE
Address range: 7300 to 7499
Directions: E-W, SW-NE
Address range: 7300 to 7499
Allen St
Length: 0.37 miles
Directions: E-W, N-S, SE-NW
Address range: 3100 to 3223
Directions: E-W, N-S, SE-NW
Address range: 3100 to 3223
Graham Ct
Length: 0.22 miles
Directions: E-W, N-S, SE-NW, SW-NE
Address range: 3000 to 3099
Directions: E-W, N-S, SE-NW, SW-NE
Address range: 3000 to 3099
Strathmeade St
Length: 0.19 miles
Directions: E-W, N-S, SW-NE
Address range: 3000 to 3099
Directions: E-W, N-S, SW-NE
Address range: 3000 to 3099
Rogers Dr
Length: 0.17 miles
Directions: E-W, N-S, SW-NE
Address range: 3000 to 3020
Directions: E-W, N-S, SW-NE
Address range: 3000 to 3020
Linda Ln
Length: 0.13 miles
Direction: E-W
Address range: 7400 to 7499
Direction: E-W
Address range: 7400 to 7499
Labella Walk
Length: 0.12 miles
Direction: SE-NW
Address range: 2900 to 2974
Direction: SE-NW
Address range: 2900 to 2974
Robert Ln
Length: 0.12 miles
Direction: E-W
Address range: 7200 to 7399
Direction: E-W
Address range: 7200 to 7399
Fenwick Rd
Length: 0.12 miles
Directions: N-S, SE-NW
Address range: 3000 to 3099
Directions: N-S, SE-NW
Address range: 3000 to 3099
Lawrence Dr
Length: 0.09 miles
Directions: N-S, SE-NW
Address range: 3000 to 3099
Directions: N-S, SE-NW
Address range: 3000 to 3099
Fairmont St
Length: 0.08 miles
Directions: E-W, N-S
Address range: 3023 to 3099
Directions: E-W, N-S
Address range: 3023 to 3099
Parkwood Ct
Length: 0.06 miles
Direction: E-W
Address range: 7200 to 7399
Direction: E-W
Address range: 7200 to 7399
Barley Walk
Length: 0.05 miles
Direction: SW-NE
Address range: 7400 to 7421
Direction: SW-NE
Address range: 7400 to 7421
Johnson Rd
Length: 0.04 miles
Direction: N-S
Address range: 2930 to 2999
Direction: N-S
Address range: 2930 to 2999