Campostella Heights neighborhood in Norfolk, Virginia (VA), 23523 detailed profile
Settings
X


Business Search - 14 Million verified businesses
Area: 0.295 square miles
Population: 284
Population density:
| Campostella Heights: | 963 people per square mile |
| Norfolk: | 4,337 people per square mile |

- 26992.4%Black
- 93.1%White
- 72.4%Two or more races
- 62.1%Hispanic or Latino

Median household income in 2022:
| Campostella Heights: | $55,682 |
| Norfolk: | $61,090 |
Distribution of median household income
![Distribution of median household income]()
- 10Less than $10,000
- 27$10,000 to $19,999
- 11$20,000 to $29,999
- 24$30,000 to $39,999
- 4$40,000 to $49,999
- 22$50,000 to $59,999
- 5$60,000 to $74,999
- 9$75,000 to $99,999
- 11$100,000 to $124,999
- 7$150,000 to $199,999
- 13$200,000 or more

Distribution of owner-occupied house/condo value
![Distribution of owner-occupied house/condo value]()
- 19Less than $50,000
- 1$50,000 to $99,999
- 5$100,000 to $149,999
- 7$150,000 to $199,999
- 19$200,000 to $249,999
- 24$250,000 to $299,999
- 2$300,000 to $399,999

Distribution of rent paid by renters
![Distribution of rent paid by renters]()
- 11Less than $100
- 20$200 to $299
- 4$300 to $399
- 7$400 to $499
- 5$500 to $599
- 4$600 to $699
- 3$800 to $899
- 14$900 to $999
- 12$1,000 to $1,249
- 5$1,500 to $1,999

Median rent in 2022:
| Campostella Heights: | $1,146 |
| Norfolk: | $1,035 |
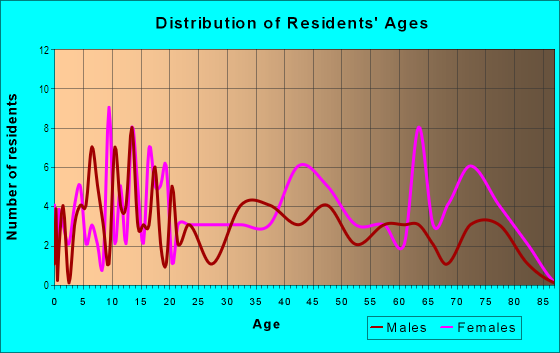
| Males: | 103 |
| Females: | 181 |
Males:
| This neighborhood: | 17.9 years |
| Whole city: | 31.3 years |
| This neighborhood: | 41.5 years |
| Whole city: | 34.4 years |
Average household size:
| Campostella Heights: | 38.0 people |
| Norfolk: | 2.3 people |
Percentage of family households:
| Campostella Heights: | 39.6% |
| Norfolk: | 41.3% |
| Here: | 16.7% |
| Norfolk: | 31.7% |
Percentage of married-couple families with children (among all households):
| Campostella Heights: | 44.9% |
| Norfolk: | 20.2% |
Percentage of single-mother households (among all households):
| Campostella Heights: | 32.5% |
| Norfolk: | 16.3% |
Percentage of never married males 15 years old and over:
Percentage of never married females 15 years old and over:
| Campostella Heights: | 28.7% |
| Norfolk: | 25.4% |
Percentage of never married females 15 years old and over:
| Campostella Heights: | 24.0% |
| city: | 20.5% |
Percentage of people that speak English not well or not at all:
| Campostella Heights: | 0.0% |
| Norfolk: | 1.4% |
Percentage of people born in this state:
Percentage of people born in another U.S. state:
Percentage of native residents but born outside the U.S.:
Percentage of foreign born residents:
| Here: | 79.0% |
| Norfolk: | 51.1% |
Percentage of people born in another U.S. state:
| Campostella Heights: | 18.5% |
| Norfolk: | 40.8% |
Percentage of native residents but born outside the U.S.:
| Here: | 0.7% |
| city: | 1.6% |
Percentage of foreign born residents:
| Here: | 1.8% |
| Norfolk: | 6.5% |

Owner-occupied
Renter-occupied


- Rooms in owner-occupied houses and condos in Campostella Heights
- 01 room
- 02 rooms
- 03 rooms
- 14 rooms
- 155 rooms
- 16 rooms
- 297 rooms
- 128 rooms
- 59+ rooms

- Rooms in renter-occupied apartments in Campostella Heights
- 01 room
- 12 rooms
- 113 rooms
- 74 rooms
- 415 rooms
- 46 rooms
- 57 rooms
- 08 rooms
- 09+ rooms
Owner-occupied
Renter-occupied

- Bedrooms in owner-occupied houses and condos in Campostella Heights
- 0no bedroom
- 01 bedroom
- 12 bedrooms
- 323 bedrooms
- 314 bedrooms
- 05+ bedrooms

- Bedrooms in renter-occupied apartments in Campostella Heights
- 0no bedroom
- 111 bedroom
- 72 bedrooms
- 33 bedrooms
- 64 bedrooms
- 05+ bedrooms
Average number of cars or other vehicles available in houses/condos:
Average number of cars or other vehicles available in apartments:
| This neighborhood: | 1.4 |
| Norfolk: | 2.0 |
Average number of cars or other vehicles available in apartments:
| Here: | 1.5 |
| city: | 1.3 |
Percentage of units with a mortgage:
| Campostella Heights: | 80.0% |
| Norfolk: | 70.0% |
Average estimated value of detached houses in 2022 (79.3% of all units):
| Campostella Heights: | $173,762 |
| Norfolk: | $337,508 |

- Year house built in Campostella Heights
- 12020 or later
- 232010 to 2019
- 12000 to 2009
- 11990 to 1999
- 11980 to 1989
- 111970 to 1979
- 141960 to 1969
- 361950 to 1959
- 111940 to 1949
- 441939 or earlier

City-data.com crime index for city in 2020 (higher means more crime):
| City: | 327.9 |
| U.S. average: | 219.5 |
Travel time to work (commute)
![Travel time to work (commute)]()
- 115 to 9 minutes
- 1810 to 14 minutes
- 1815 to 19 minutes
- 1720 to 24 minutes
- 625 to 29 minutes
- 2230 to 34 minutes
- 340 to 44 minutes
- 345 to 59 minutes

Means of transportation to work
![Means of transportation to work]()
- 59.0%65Drove a car alone
- 2.7%3Carpooled
- 14.5%16Bus
- 9.1%10Walked
- 4.5%5Other means
- 7.3%8Worked at home

Time leaving home to go to work
![Time leaving home to go to work]()
- 412:00 a.m. to 4:59 a.m.
- 25:00 a.m. to 5:29 a.m.
- 35:30 a.m. to 5:59 a.m.
- 76:00 a.m. to 6:29 a.m.
- 66:30 a.m. to 6:59 a.m.
- 57:00 a.m. to 7:29 a.m.
- 87:30 a.m. to 7:59 a.m.
- 138:00 a.m. to 8:29 a.m.
- 158:30 a.m. to 8:59 a.m.
- 119:00 a.m. to 9:59 a.m.
- 1712:00 p.m. to 3:59 p.m.
- 64:00 p.m. to 11:59 p.m.

Occupations of males:
- Percentage of males in computer and mathematical occupations:
Here: 14.8% city: 4.2%
- Percentage of males in education, training, and library occupations:
Here: 8.5% city: 3.9%
- Percentage of males in arts, design, entertainment, sports, and media occupations:
Here: 2.6% city: 2.2%
- Percentage of males in service occupations:
Here: 35.9% city: 16.9%
- Percentage of males in sales and office occupations:
Here: 9.2% city: 15.6%
- Percentage of males in construction, extraction, and maintenance occupations:
Here: 3.8% city: 9.8%
- Percentage of males in production occupations:
Here: 24.6% city: 6.5%
- Percentage of males in transportation occupations:
Here: 7.0% city: 5.3%
- Percentage of males in material moving occupations:
Here: 13.3% city: 5.3%
Occupations of females:
- Percentage of females in computer and mathematical occupations:
Here: 17.4% city: 1.7%
- Percentage of females in community and social services occupations:
Here: 18.5% city: 3.1%
- Percentage of females in education, training, and library occupations:
Here: 4.8% city: 9.1%
- Percentage of females in healthcare practitioners and technical occupations:
Here: 7.9% city: 9.6%
- Percentage of females in service occupations:
Here: 28.3% city: 22.3%
- Percentage of females in sales and office occupations:
Here: 21.0% city: 28.7%
- Percentage of females in production occupations:
Here: 25.9% city: 2.7%
- Percentage of females in transportation occupations:
Here: 6.3% city: 1.6%
- Percentage of females in material moving occupations:
Here: 7.9% city: 2.4%
Percentage of people 16-64 in Armed Forces:
| Campostella Heights: | 3.0% |
| Norfolk: | 15.8% |
Education in this neighborhood (subdivision or community):
- Percentage of people 3 years and older in K-12 schools:
Campostella Heights: 38.3% Norfolk: 14.3%
- Percentage of people 3 years and older in undergraduate colleges:
Campostella Heights: 7.8% Norfolk: 8.0%
- Percentage of people 3 years and older in grad. or professional schools:
Campostella Heights: 2.3% Norfolk: 2.1%
- Percentage of students K-12 enrolled in private schools:
Campostella Heights: 6.1% Norfolk: 16.2%
Percentage of population below poverty level:
| Campostella Heights: | 39.4% |
| Norfolk: | 17.7% |
Median year owner moved in (as recorded in 2022):
Median year renter moved in (as recorded in 2022):
| Campostella Heights: | 2014 |
| Norfolk: | 2013 |
Median year renter moved in (as recorded in 2022):
| Campostella Heights: | 2012 |
| Norfolk: | 2020 |
Percentage of married-couple families with both working:
| Campostella Heights: | 100.0% |
| Norfolk: | 65.5% |

- 52.6%Electricity
- 16.5%Utility gas
- 16.5%No fuel used
- 7.0%Other fuel
- 5.2%Bottled, tank, or LP gas
- 2.3%Fuel oil, kerosene, etc.
Highways in this neighborhood:
State Rte 168 (Campostella Rd)
Length: 0.32 miles
Directions: N-S, SE-NW
Address range: 600 to 1098
Directions: N-S, SE-NW
Address range: 600 to 1098
Roads and streets:
Springfield Ave
Length: 0.76 miles
Directions: E-W, SW-NE
Address range: 1700 to 2299
Directions: E-W, SW-NE
Address range: 1700 to 2299
E Indian River Rd
Length: 0.54 miles
Directions: E-W, SW-NE
Address range: 1700 to 2298
Directions: E-W, SW-NE
Address range: 1700 to 2298
Ford Dr
Length: 0.45 miles
Directions: E-W, N-S, SW-NE
Address range: 684 to 1098
Directions: E-W, N-S, SW-NE
Address range: 684 to 1098
Montclair Ave
Length: 0.40 miles
Directions: E-W, SW-NE
Address range: 1700 to 2299
Directions: E-W, SW-NE
Address range: 1700 to 2299
Oakwood St
Length: 0.36 miles
Direction: SE-NW
Address range: 500 to 1099
Direction: SE-NW
Address range: 500 to 1099
Waltham St
Length: 0.35 miles
Directions: E-W, N-S, SE-NW
Address range: 500 to 1099
Directions: E-W, N-S, SE-NW
Address range: 500 to 1099
Light St
Length: 0.35 miles
Directions: E-W, N-S, SW-NE
Address range: 501 to 511
Directions: E-W, N-S, SW-NE
Address range: 501 to 511
Sycamore St
Length: 0.30 miles
Directions: E-W, N-S, SW-NE
Address range: 502 to 899
Directions: E-W, N-S, SW-NE
Address range: 502 to 899
Princeton Ave
Length: 0.27 miles
Direction: E-W
Address range: 1700 to 1999
Direction: E-W
Address range: 1700 to 1999
Canton Ave
Length: 0.25 miles
Directions: E-W, SE-NW
Address range: 1700 to 1902
Directions: E-W, SE-NW
Address range: 1700 to 1902
Decker St
Length: 0.25 miles
Directions: N-S, SE-NW, SW-NE
Address range: 400 to 1099
Directions: N-S, SE-NW, SW-NE
Address range: 400 to 1099
Eustis Ave
Length: 0.22 miles
Directions: E-W, SE-NW
Address range: 2100 to 2299
Directions: E-W, SE-NW
Address range: 2100 to 2299
Arlington Ave
Length: 0.14 miles
Directions: E-W, SE-NW
Address range: 1800 to 1999
Directions: E-W, SE-NW
Address range: 1800 to 1999
Campos Pl
Length: 0.10 miles
Directions: E-W, N-S, SE-NW, SW-NE
Address range: 1000 to 1099
Directions: E-W, N-S, SE-NW, SW-NE
Address range: 1000 to 1099
Wheeling Ave
Length: 0.06 miles
Directions: E-W, SE-NW
Address range: 2100 to 2199
Directions: E-W, SE-NW
Address range: 2100 to 2199
Mount Vernon Ave
Length: 0.06 miles
Direction: E-W
Address range: 1700 to 1799
Direction: E-W
Address range: 1700 to 1799
Sycamore Ln
Length: 0.05 miles
Direction: E-W
Address range: 1900 to 1999
Direction: E-W
Address range: 1900 to 1999