The median household income in Sheboygan Falls, WI in 2022 was $60,646, which was 17.1% less than the median annual income of $70,996 across the entire state of Wisconsin. Compared to the median income of $47,205 in 2000 this represents an increase of 22.2%. The per capita income in 2022 was $36,582, which means an increase of 38.6% compared to 2000 when it was $22,456.
Whole page based on the data from 2000 / 2022 when the population of Sheboygan Falls, Wisconsin was 6,772 / 8,170
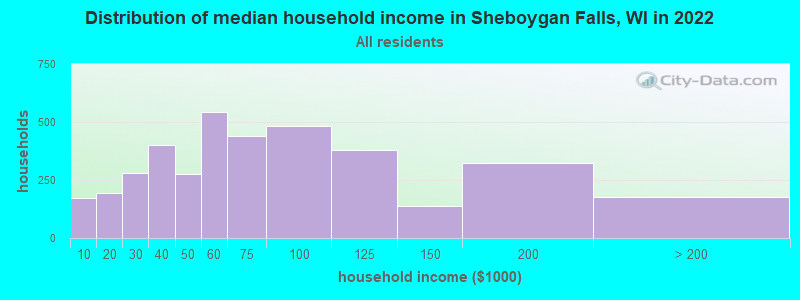
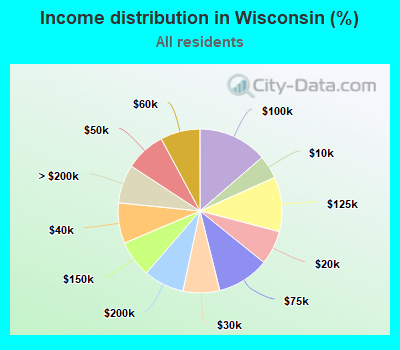
Income statistics for all residents
Median household income in Sheboygan Falls, WI in 2022:
Sheboygan Falls:
$60,647
State:
$70,996
Change in median household income between 2000 and 2022:
Sheboygan Falls, Wisconsin:
+28.5%
State:
+62.1%
Number of households with income < $10k:
Sheboygan Falls:
4.5% (171)
State:
4.6% (115,058)
Number of households with income $10k - 20k:
Sheboygan Falls:
5.2% (196)
Wisconsin:
6.7% (167,685)
Number of households with income $20k - 30k:
Sheboygan Falls:
7.3% (279)
State:
7.2% (180,435)
Number of households with income $30k - 40k:
Sheboygan Falls:
10.5% (401)
State:
8.0% (199,167)
Number of households with income $40k - 50k:
Sheboygan Falls:
7.2% (274)
State:
7.9% (197,648)
Number of households with income $50k - 60k:
Sheboygan Falls:
14.3% (543)
State:
7.8% (195,297)
Number of households with income $60k - 75k:
Sheboygan Falls:
11.6% (441)
Wisconsin:
10.3% (256,633)
Number of households with income $75k - 100k:
Sheboygan Falls:
12.7% (483)
State:
13.7% (340,492)
Number of households with income $100k - 125k:
Sheboygan Falls:
10.0% (380)
Wisconsin:
10.8% (268,847)
Number of households with income $125k - 150k:
Sheboygan Falls:
3.7% (139)
State:
7.3% (180,911)
Number of households with income $150k - 200k:
Sheboygan Falls:
8.5% (322)
State:
8.0% (199,297)
Number of households with income > $200k:
Sheboygan Falls:
4.6% (176)
Wisconsin:
7.6% (189,651)
Aggregate household income in Sheboygan Falls in 2022: $302,291,232
Median family income in Sheboygan Falls in 2022:
Sheboygan Falls:
$74,289
State:
$91,700
Number of families with income < $10k:
Sheboygan Falls:
0.3% (7)
Wisconsin:
2.6% (38,882)
Number of families with income $10k - 20k:
Sheboygan Falls:
1.7% (38)
Wisconsin:
3.1% (46,987)
Number of families with income $20k - 30k:
Sheboygan Falls:
3.0% (69)
State:
4.1% (62,031)
Number of families with income $30k - 40k:
Sheboygan Falls:
7.9% (182)
State:
5.5% (83,582)
Number of families with income $40k - 50k:
Sheboygan Falls:
7.4% (171)
State:
6.4% (96,004)
Number of families with income $50k - 60k:
Sheboygan Falls:
13.4% (308)
Wisconsin:
7.0% (105,216)
Number of families with income $60k - 75k:
Sheboygan Falls:
15.0% (343)
State:
10.6% (160,930)
Number of families with income $75k - 100k:
Sheboygan Falls:
16.5% (379)
State:
15.6% (235,445)
Number of families with income $100k - 125k:
Sheboygan Falls:
11.5% (263)
State:
13.6% (205,203)
Number of families with income $125k - 150k:
Sheboygan Falls:
4.7% (108)
State:
9.6% (145,052)
Number of families with income $150k - 200k:
Sheboygan Falls:
13.1% (300)
State:
11.3% (170,756)
Number of families with income > $200k:
Sheboygan Falls:
5.5% (125)
State:
10.7% (161,017)
Median non-family income in Sheboygan Falls in 2022:
Sheboygan Falls:
$38,536
State:
$42,812
Change in median non-family income between 2000 and 2022:
Sheboygan Falls, Wisconsin:
+42.1%
Wisconsin:
+65.7%
Median per capita income in Sheboygan Falls in 2022:
Sheboygan Falls:
$36,582
State:
$40,188
Change in median per capita income between 2000 and 2022:
Sheboygan Falls, Wisconsin:
+62.9%
State:
+88.9%
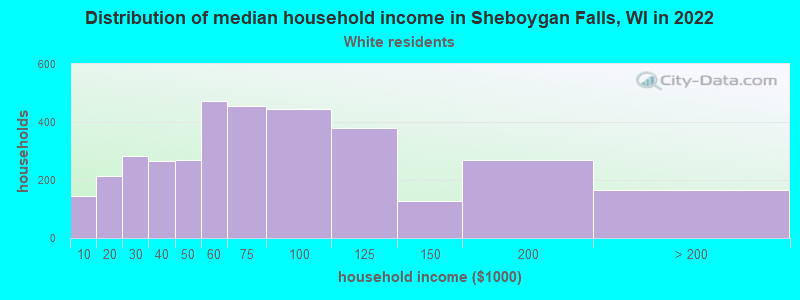
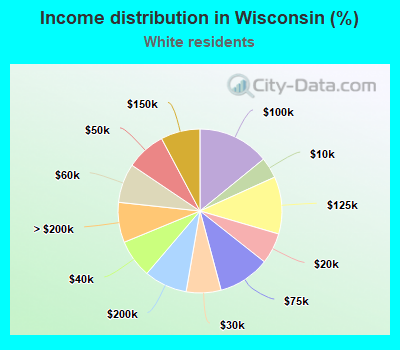
Income statistics for White residents
Median household income in Sheboygan Falls, WI in 2022:
Sheboygan Falls:
$60,708
State:
$74,405
Change in median household income between 2000 and 2022:
Sheboygan Falls, Wisconsin:
+28.7%
Wisconsin:
+64.5%
Number of households with income < $10k:
Sheboygan Falls:
4.2% (145)
Wisconsin:
4.1% (87,410)
Number of households with income $10k - 20k:
Sheboygan Falls:
6.2% (215)
State:
6.1% (129,511)
Number of households with income $20k - 30k:
Sheboygan Falls:
8.1% (282)
Wisconsin:
6.9% (145,235)
Number of households with income $30k - 40k:
Sheboygan Falls:
7.6% (264)
Wisconsin:
7.6% (160,205)
Number of households with income $40k - 50k:
Sheboygan Falls:
7.7% (268)
State:
7.8% (165,627)
Number of households with income $50k - 60k:
Sheboygan Falls:
13.5% (471)
Wisconsin:
7.7% (163,506)
Number of households with income $60k - 75k:
Sheboygan Falls:
13.0% (455)
Wisconsin:
10.2% (216,479)
Number of households with income $75k - 100k:
Sheboygan Falls:
12.8% (445)
State:
14.1% (298,984)
Number of households with income $100k - 125k:
Sheboygan Falls:
10.9% (380)
State:
11.3% (239,588)
Number of households with income $125k - 150k:
Sheboygan Falls:
3.7% (128)
State:
7.8% (164,502)
Number of households with income $150k - 200k:
Sheboygan Falls:
7.7% (270)
State:
8.5% (180,048)
Number of households with income > $200k:
Sheboygan Falls:
4.8% (167)
State:
7.9% (167,999)
Aggregate household income in Sheboygan Falls in 2022: $279,025,489
Median family income in Sheboygan Falls in 2022:
Sheboygan Falls:
$75,746
Wisconsin:
$96,327
Number of families with income $10k - 20k:
Sheboygan Falls:
1.8% (37)
State:
2.4% (30,426)
Number of families with income $20k - 30k:
Sheboygan Falls:
1.7% (36)
Wisconsin:
3.5% (45,298)
Number of families with income $30k - 40k:
Sheboygan Falls:
6.0% (125)
Wisconsin:
4.9% (62,935)
Number of families with income $40k - 50k:
Sheboygan Falls:
7.0% (145)
Wisconsin:
6.0% (76,575)
Number of families with income $50k - 60k:
Sheboygan Falls:
12.7% (262)
State:
6.9% (88,079)
Number of families with income $60k - 75k:
Sheboygan Falls:
17.1% (354)
State:
10.6% (136,022)
Number of families with income $75k - 100k:
Sheboygan Falls:
18.0% (373)
Wisconsin:
16.0% (204,807)
Number of families with income $100k - 125k:
Sheboygan Falls:
12.9% (267)
State:
14.3% (183,287)
Number of families with income $125k - 150k:
Sheboygan Falls:
4.7% (97)
State:
10.2% (131,464)
Number of families with income $150k - 200k:
Sheboygan Falls:
12.2% (252)
State:
12.1% (155,060)
Number of families with income > $200k:
Sheboygan Falls:
5.8% (121)
Wisconsin:
11.2% (143,836)
Median non-family income in Sheboygan Falls in 2022:
Sheboygan Falls:
$39,483
Wisconsin:
$44,213
Change in median non-family income between 2000 and 2022:
Sheboygan Falls, Wisconsin:
+45.6%
Wisconsin:
+68.5%
Median per capita income in Sheboygan Falls in 2022:
Sheboygan Falls:
$37,525
State:
$43,415
Change in median per capita income between 2000 and 2022:
Sheboygan Falls, Wisconsin:
+66.2%
State:
+94.0%
Income statistics for Black or African American residents
Median per capita income in Sheboygan Falls in 2022:
Sheboygan Falls:
$26,430
State:
$22,861
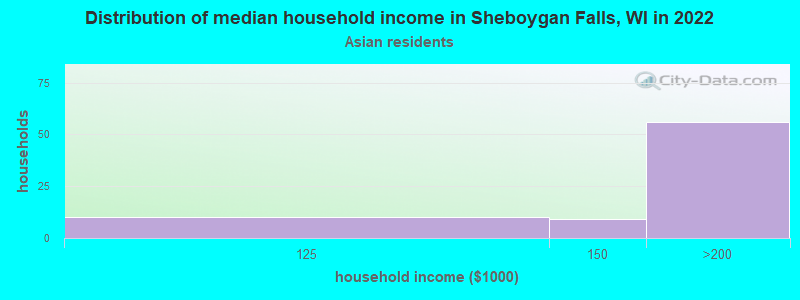
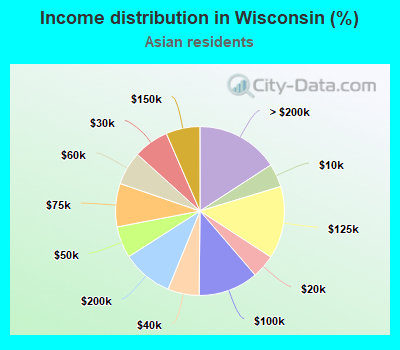
Income statistics for Asian residents
Median household income in Sheboygan Falls, WI in 2022:
Sheboygan Falls:
$178,238
Wisconsin:
$90,784
Change in median household income between 2000 and 2022:
Sheboygan Falls, Wisconsin:
+96.0%
State:
+127.8%
Number of households with income < $10k:
Sheboygan Falls:
0.0% (0)
State:
4.5% (2,385)
Number of households with income $10k - 20k:
Sheboygan Falls:
0.0% (0)
State:
4.5% (2,396)
Number of households with income $20k - 30k:
Sheboygan Falls:
0.0% (0)
Wisconsin:
6.8% (3,621)
Number of households with income $30k - 40k:
Sheboygan Falls:
0.0% (0)
State:
6.0% (3,200)
Number of households with income $40k - 50k:
Sheboygan Falls:
0.0% (0)
State:
6.0% (3,220)
Number of households with income $50k - 60k:
Sheboygan Falls:
0.0% (0)
State:
6.4% (3,427)
Number of households with income $60k - 75k:
Sheboygan Falls:
0.0% (0)
State:
8.3% (4,416)
Number of households with income $75k - 100k:
Sheboygan Falls:
0.0% (0)
State:
11.5% (6,114)
Number of households with income $100k - 125k:
Sheboygan Falls:
13.3% (10)
Wisconsin:
13.9% (7,397)
Number of households with income $125k - 150k:
Sheboygan Falls:
12.0% (9)
State:
6.5% (3,469)
Number of households with income $150k - 200k:
Sheboygan Falls:
74.7% (56)
State:
9.8% (5,204)
Number of households with income > $200k:
Sheboygan Falls:
0.0% (0)
Wisconsin:
15.9% (8,450)
Aggregate household income in Sheboygan Falls in 2022: $8,572,838
Median per capita income in Sheboygan Falls in 2022:
Sheboygan Falls:
$33,401
State:
$40,918
Change in median per capita income between 2000 and 2022:: -63.7%
Sheboygan Falls, Wisconsin:
-63.7%
State:
+173.5%
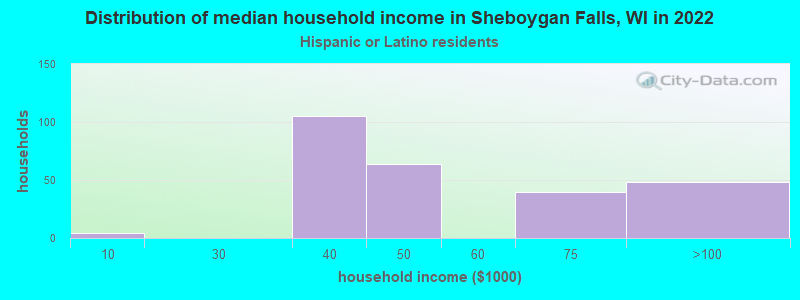
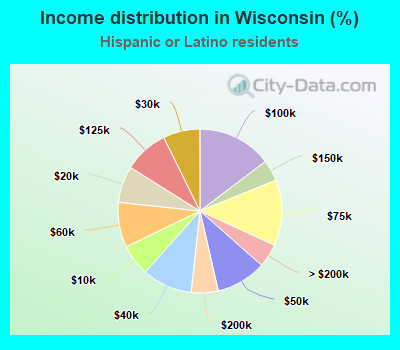
Income statistics for Hispanic or Latino residents
Median household income in Sheboygan Falls, WI in 2022:
Sheboygan Falls:
$40,742
State:
$60,422
Change in median household income between 2000 and 2022:: -54.7%
Sheboygan Falls, Wisconsin:
-54.7%
State:
+72.7%
Number of households with income < $10k:
Sheboygan Falls:
1.5% (4)
Wisconsin:
6.2% (7,841)
Number of households with income $10k - 20k:
Sheboygan Falls:
0.0% (0)
State:
7.2% (9,100)
Number of households with income $20k - 30k:
Sheboygan Falls:
0.0% (0)
State:
7.3% (9,213)
Number of households with income $30k - 40k:
Sheboygan Falls:
40.2% (105)
Wisconsin:
9.9% (12,505)
Number of households with income $40k - 50k:
Sheboygan Falls:
24.5% (64)
State:
9.9% (12,552)
Number of households with income $50k - 60k:
Sheboygan Falls:
0.0% (0)
State:
8.9% (11,263)
Number of households with income $60k - 75k:
Sheboygan Falls:
15.3% (40)
State:
13.0% (16,458)
Number of households with income $75k - 100k:
Sheboygan Falls:
18.4% (48)
State:
14.7% (18,587)
Number of households with income $100k - 125k:
Sheboygan Falls:
0.0% (0)
State:
8.8% (11,136)
Number of households with income $125k - 150k:
Sheboygan Falls:
0.0% (0)
Wisconsin:
4.2% (5,292)
Number of households with income $150k - 200k:
Sheboygan Falls:
0.0% (0)
State:
5.3% (6,737)
Number of households with income > $200k:
Sheboygan Falls:
0.0% (0)
State:
4.6% (5,851)
Aggregate household income in Sheboygan Falls in 2022: $15,415,277
Median family income in Sheboygan Falls in 2022:
Sheboygan Falls:
$41,997
State:
$62,574
Number of families with income < $10k:
Sheboygan Falls:
2.5% (4)
State:
7.4% (6,511)
Number of families with income $30k - 40k:
Sheboygan Falls:
35.9% (64)
State:
10.7% (9,335)
Number of families with income $40k - 50k:
Sheboygan Falls:
55.1% (99)
State:
9.6% (8,400)
Number of families with income $75k - 100k:
Sheboygan Falls:
6.4% (12)
State:
15.1% (13,191)
Median per capita income in Sheboygan Falls in 2022:
Sheboygan Falls:
$23,329
State:
$23,991
Change in median per capita income between 2000 and 2022:
Sheboygan Falls, Wisconsin:
+84.7%
State:
+108.6%
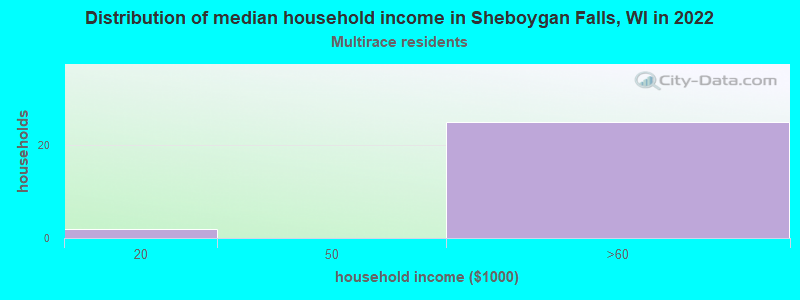
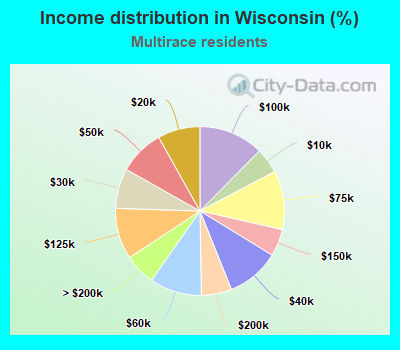
Income statistics for Multirace residents
Number of households with income < $10k:
Sheboygan Falls:
0.0% (0)
State:
4.8% (6,288)
Number of households with income $10k - 20k:
Sheboygan Falls:
7.4% (2)
State:
8.1% (10,562)
Number of households with income $20k - 30k:
Sheboygan Falls:
0.0% (0)
State:
7.7% (9,975)
Number of households with income $30k - 40k:
Sheboygan Falls:
0.0% (0)
Wisconsin:
10.2% (13,246)
Number of households with income $40k - 50k:
Sheboygan Falls:
0.0% (0)
State:
8.7% (11,305)
Number of households with income $50k - 60k:
Sheboygan Falls:
92.6% (25)
Wisconsin:
10.0% (12,968)
Number of households with income $60k - 75k:
Sheboygan Falls:
0.0% (0)
State:
11.3% (14,655)
Number of households with income $75k - 100k:
Sheboygan Falls:
0.0% (0)
State:
12.4% (16,181)
Number of households with income $100k - 125k:
Sheboygan Falls:
0.0% (0)
State:
9.8% (12,743)
Number of households with income $125k - 150k:
Sheboygan Falls:
0.0% (0)
State:
5.2% (6,773)
Number of households with income $150k - 200k:
Sheboygan Falls:
0.0% (0)
Wisconsin:
5.8% (7,552)
Number of households with income > $200k:
Sheboygan Falls:
0.0% (0)
State:
6.0% (7,788)
Aggregate household income in Sheboygan Falls in 2022: $1,201,167
Median per capita income in Sheboygan Falls in 2022:
Sheboygan Falls:
$21,591
State:
$24,783
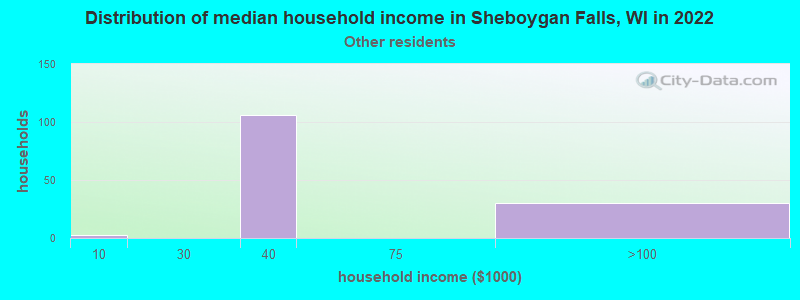
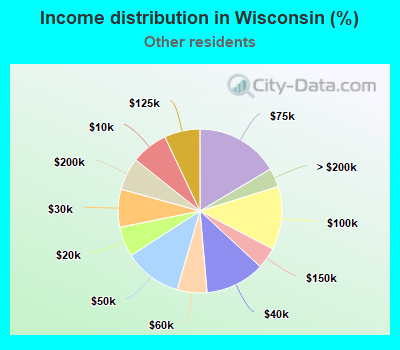
Income statistics for other residents
Median household income in Sheboygan Falls, WI in 2022:
Sheboygan Falls:
$43,174
State:
$60,130
Number of households with income < $10k:
Sheboygan Falls:
2.2% (3)
Wisconsin:
7.2% (2,622)
Number of households with income $10k - 20k:
Sheboygan Falls:
0.0% (0)
Wisconsin:
5.9% (2,142)
Number of households with income $20k - 30k:
Sheboygan Falls:
0.0% (0)
Wisconsin:
7.5% (2,715)
Number of households with income $30k - 40k:
Sheboygan Falls:
76.3% (106)
State:
11.7% (4,249)
Number of households with income $40k - 50k:
Sheboygan Falls:
0.0% (0)
Wisconsin:
11.4% (4,111)
Number of households with income $50k - 60k:
Sheboygan Falls:
0.0% (0)
State:
5.9% (2,134)
Number of households with income $60k - 75k:
Sheboygan Falls:
0.0% (0)
State:
16.5% (5,962)
Number of households with income $75k - 100k:
Sheboygan Falls:
21.6% (30)
Wisconsin:
12.5% (4,527)
Number of households with income $100k - 125k:
Sheboygan Falls:
0.0% (0)
State:
7.0% (2,551)
Number of households with income $125k - 150k:
Sheboygan Falls:
0.0% (0)
Wisconsin:
4.2% (1,517)
Number of households with income $150k - 200k:
Sheboygan Falls:
0.0% (0)
Wisconsin:
6.4% (2,318)
Number of households with income > $200k:
Sheboygan Falls:
0.0% (0)
State:
3.7% (1,344)
Aggregate household income in Sheboygan Falls in 2022: $6,354,061
Median family income in Sheboygan Falls in 2022:
Sheboygan Falls:
$87,611
State:
$61,543
Number of families with income < $10k:
Sheboygan Falls:
4.2% (3)
State:
8.5% (2,172)
Number of families with income $30k - 40k:
Sheboygan Falls:
58.1% (46)
State:
8.8% (2,241)
Number of families with income $40k - 50k:
Sheboygan Falls:
37.7% (30)
State:
10.0% (2,549)
Median per capita income in Sheboygan Falls in 2022:
Sheboygan Falls:
$29,278
Wisconsin:
$27,766
Change in median per capita income between 2000 and 2022:
Sheboygan Falls, Wisconsin:
+76.5%
Wisconsin:
+159.4%
Discuss Sheboygan Falls, Wisconsin (WI) on our hugely popular Wisconsin forum.