The median household income in Huntington Park, CA in 2022 was $53,492, which was 71.1% less than the median annual income of $91,551 across the entire state of California. Compared to the median income of $28,941 in 2000 this represents an increase of 45.9%. The per capita income in 2022 was $19,825, which means an increase of 52.9% compared to 2000 when it was $9,340.
Whole page based on the data from 2000 / 2022 when the population of Huntington Park, California was 61,348 / 53,364
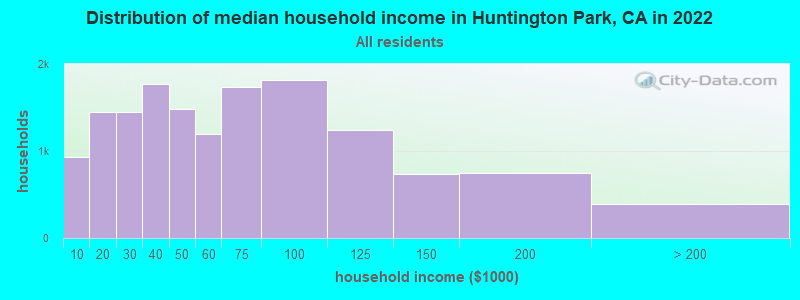
Income statistics for all residents
Median household income in Huntington Park, CA in 2022:
Huntington Park:
$53,493
California:
$91,551
Change in median household income between 2000 and 2022:
Huntington Park, California:
+84.8%
State:
+92.8%
Number of households with income < $10k:
Huntington Park:
6.3% (934)
California:
4.8% (654,370)
Number of households with income $10k - 20k:
Huntington Park:
9.7% (1,452)
California:
5.8% (789,493)
Number of households with income $20k - 30k:
Huntington Park:
9.7% (1,448)
California:
5.7% (778,318)
Number of households with income $30k - 40k:
Huntington Park:
11.8% (1,767)
State:
5.8% (783,170)
Number of households with income $40k - 50k:
Huntington Park:
9.9% (1,478)
State:
5.8% (781,352)
Number of households with income $50k - 60k:
Huntington Park:
8.0% (1,195)
California:
5.6% (760,175)
Number of households with income $60k - 75k:
Huntington Park:
11.6% (1,734)
State:
8.2% (1,104,699)
Number of households with income $75k - 100k:
Huntington Park:
12.2% (1,816)
State:
12.0% (1,627,633)
Number of households with income $100k - 125k:
Huntington Park:
8.3% (1,244)
California:
10.0% (1,358,619)
Number of households with income $125k - 150k:
Huntington Park:
4.9% (734)
State:
7.6% (1,027,455)
Number of households with income $150k - 200k:
Huntington Park:
5.0% (743)
State:
10.6% (1,439,811)
Number of households with income > $200k:
Huntington Park:
2.6% (391)
California:
18.0% (2,445,491)
Aggregate household income in Huntington Park in 2022: $1,013,646,974
Median family income in Huntington Park in 2022:
Huntington Park:
$55,798
State:
$104,823
Number of families with income < $10k:
Huntington Park:
6.1% (721)
California:
3.1% (280,184)
Number of families with income $10k - 20k:
Huntington Park:
5.6% (670)
State:
3.5% (322,064)
Number of families with income $20k - 30k:
Huntington Park:
11.7% (1,385)
State:
4.7% (433,722)
Number of families with income $30k - 40k:
Huntington Park:
13.7% (1,622)
California:
5.2% (478,213)
Number of families with income $40k - 50k:
Huntington Park:
9.3% (1,103)
State:
5.6% (511,647)
Number of families with income $50k - 60k:
Huntington Park:
7.1% (848)
State:
5.5% (498,926)
Number of families with income $60k - 75k:
Huntington Park:
11.5% (1,362)
California:
8.0% (731,094)
Number of families with income $75k - 100k:
Huntington Park:
13.2% (1,570)
State:
12.2% (1,115,621)
Number of families with income $100k - 125k:
Huntington Park:
8.5% (1,015)
State:
10.5% (959,600)
Number of families with income $125k - 150k:
Huntington Park:
5.6% (670)
California:
8.4% (768,725)
Number of families with income $150k - 200k:
Huntington Park:
4.9% (584)
State:
11.9% (1,087,239)
Number of families with income > $200k:
Huntington Park:
2.8% (329)
State:
21.5% (1,963,769)
Median non-family income in Huntington Park in 2022:
Huntington Park:
$25,584
State:
$59,348
Change in median non-family income between 2000 and 2022:
Huntington Park, California:
+76.3%
State:
+85.3%
Median per capita income in Huntington Park in 2022:
Huntington Park:
$19,825
State:
$46,661
Change in median per capita income between 2000 and 2022:
Huntington Park, California:
+112.3%
California:
+105.5%
Income statistics for White residents
Median household income in Huntington Park, CA in 2022:
Huntington Park:
$51,541
State:
$100,917
Change in median household income between 2000 and 2022:
Huntington Park, California:
+89.2%
State:
+96.8%
Number of households with income < $10k:
Huntington Park:
4.9% (193)
California:
4.4% (284,109)
Number of households with income $10k - 20k:
Huntington Park:
9.1% (357)
State:
5.3% (340,330)
Number of households with income $20k - 30k:
Huntington Park:
12.0% (471)
State:
5.3% (343,145)
Number of households with income $30k - 40k:
Huntington Park:
13.4% (523)
State:
5.1% (330,146)
Number of households with income $40k - 50k:
Huntington Park:
10.4% (406)
California:
5.2% (335,310)
Number of households with income $50k - 60k:
Huntington Park:
8.0% (313)
State:
5.1% (326,299)
Number of households with income $60k - 75k:
Huntington Park:
8.8% (343)
California:
7.6% (487,640)
Number of households with income $75k - 100k:
Huntington Park:
12.9% (504)
State:
11.5% (736,578)
Number of households with income $100k - 125k:
Huntington Park:
6.3% (245)
California:
10.1% (648,782)
Number of households with income $125k - 150k:
Huntington Park:
4.3% (168)
State:
7.8% (499,671)
Number of households with income $150k - 200k:
Huntington Park:
5.4% (212)
State:
11.4% (729,603)
Number of households with income > $200k:
Huntington Park:
4.5% (177)
California:
21.2% (1,364,246)
Aggregate household income in Huntington Park in 2022: $295,403,702
Median family income in Huntington Park in 2022:
Huntington Park:
$55,737
California:
$125,379
Number of families with income < $10k:
Huntington Park:
5.3% (145)
State:
2.2% (87,079)
Number of families with income $10k - 20k:
Huntington Park:
3.6% (98)
State:
2.5% (97,716)
Number of families with income $20k - 30k:
Huntington Park:
14.3% (391)
California:
3.5% (137,295)
Number of families with income $30k - 40k:
Huntington Park:
14.8% (406)
State:
3.9% (152,947)
Number of families with income $40k - 50k:
Huntington Park:
9.8% (268)
State:
4.3% (169,197)
Number of families with income $50k - 60k:
Huntington Park:
6.7% (184)
California:
4.5% (176,192)
Number of families with income $60k - 75k:
Huntington Park:
8.8% (241)
State:
7.0% (274,752)
Number of families with income $75k - 100k:
Huntington Park:
11.9% (325)
State:
11.3% (445,632)
Number of families with income $100k - 125k:
Huntington Park:
6.6% (180)
State:
10.7% (423,630)
Number of families with income $125k - 150k:
Huntington Park:
5.8% (158)
California:
9.1% (357,408)
Number of families with income $150k - 200k:
Huntington Park:
7.2% (198)
California:
13.5% (532,693)
Number of families with income > $200k:
Huntington Park:
5.3% (145)
California:
27.6% (1,086,948)
Median non-family income in Huntington Park in 2022:
Huntington Park:
$31,891
California:
$62,819
Change in median non-family income between 2000 and 2022:
Huntington Park, California:
+124.5%
State:
+84.4%
Median per capita income in Huntington Park in 2022:
Huntington Park:
$23,032
California:
$61,706
Change in median per capita income between 2000 and 2022:
Huntington Park, California:
+132.7%
State:
+122.7%
Income statistics for Black or African American residents
Number of households with income < $10k:
Huntington Park:
15.9% (23)
California:
9.0% (73,219)
Number of households with income $10k - 20k:
Huntington Park:
39.3% (57)
State:
10.6% (86,666)
Number of households with income $20k - 30k:
Huntington Park:
4.8% (7)
State:
7.1% (57,719)
Number of households with income $30k - 40k:
Huntington Park:
5.5% (8)
California:
7.2% (58,714)
Number of households with income $40k - 50k:
Huntington Park:
11.7% (17)
State:
7.1% (58,075)
Number of households with income $50k - 60k:
Huntington Park:
0.0% (0)
State:
6.8% (55,229)
Number of households with income $60k - 75k:
Huntington Park:
17.9% (26)
State:
8.8% (71,895)
Number of households with income $75k - 100k:
Huntington Park:
0.0% (0)
State:
11.9% (96,893)
Number of households with income $100k - 125k:
Huntington Park:
0.0% (0)
State:
8.7% (70,729)
Number of households with income $125k - 150k:
Huntington Park:
4.8% (7)
State:
6.3% (51,211)
Number of households with income $150k - 200k:
Huntington Park:
0.0% (0)
State:
7.2% (58,687)
Number of households with income > $200k:
Huntington Park:
0.0% (0)
State:
9.3% (75,487)
Aggregate household income in Huntington Park in 2022: $4,521,238
Median family income in Huntington Park in 2022:
Huntington Park:
$63,952
State:
$77,263
Number of families with income $20k - 30k:
Huntington Park:
11.1% (6)
State:
5.6% (25,755)
Number of families with income $30k - 40k:
Huntington Park:
14.3% (8)
California:
6.8% (30,948)
Number of families with income $40k - 50k:
Huntington Park:
18.2% (10)
State:
8.3% (38,171)
Number of families with income $60k - 75k:
Huntington Park:
45.5% (25)
State:
8.7% (40,021)
Number of families with income $125k - 150k:
Huntington Park:
10.9% (6)
State:
7.5% (34,434)
Median non-family income in Huntington Park in 2022:
Huntington Park:
$15,192
State:
$41,942
Change in median non-family income between 2000 and 2022:: -35.4%
Huntington Park, California:
-35.4%
California:
+72.0%
Median per capita income in Huntington Park in 2022:
Huntington Park:
$19,784
California:
$36,708
Change in median per capita income between 2000 and 2022:
Huntington Park, California:
+13.7%
State:
+110.4%
Income statistics for Asian residents
Number of households with income < $10k:
Huntington Park:
0.0% (0)
California:
5.1% (106,273)
Number of households with income $10k - 20k:
Huntington Park:
0.0% (0)
California:
4.9% (101,815)
Number of households with income $20k - 30k:
Huntington Park:
7.5% (9)
California:
4.6% (94,414)
Number of households with income $30k - 40k:
Huntington Park:
34.2% (41)
State:
4.1% (84,491)
Number of households with income $40k - 50k:
Huntington Park:
0.0% (0)
California:
4.0% (81,758)
Number of households with income $50k - 60k:
Huntington Park:
11.7% (14)
State:
3.9% (80,971)
Number of households with income $60k - 75k:
Huntington Park:
0.0% (0)
State:
6.0% (124,194)
Number of households with income $75k - 100k:
Huntington Park:
15.0% (18)
State:
9.7% (200,337)
Number of households with income $100k - 125k:
Huntington Park:
10.8% (13)
State:
9.4% (193,488)
Number of households with income $125k - 150k:
Huntington Park:
15.0% (18)
California:
7.7% (158,253)
Number of households with income $150k - 200k:
Huntington Park:
5.8% (7)
State:
12.2% (252,139)
Number of households with income > $200k:
Huntington Park:
0.0% (0)
California:
28.4% (586,641)
Aggregate household income in Huntington Park in 2022: $9,659,355
Median family income in Huntington Park in 2022:
Huntington Park:
$73,975
State:
$136,040
Number of families with income $20k - 30k:
Huntington Park:
8.6% (9)
California:
4.1% (61,519)
Number of families with income $30k - 40k:
Huntington Park:
27.7% (29)
State:
3.7% (55,234)
Number of families with income $50k - 60k:
Huntington Park:
13.9% (15)
State:
3.9% (58,911)
Number of families with income $75k - 100k:
Huntington Park:
17.3% (18)
State:
9.5% (143,103)
Number of families with income $100k - 125k:
Huntington Park:
8.3% (9)
State:
9.4% (142,085)
Number of families with income $125k - 150k:
Huntington Park:
17.8% (19)
State:
8.0% (120,635)
Number of families with income $150k - 200k:
Huntington Park:
6.5% (7)
State:
13.2% (198,099)
Median per capita income in Huntington Park in 2022:
Huntington Park:
$28,554
California:
$58,824
Change in median per capita income between 2000 and 2022:
Huntington Park, California:
+57.1%
California:
+166.8%
Income statistics for Hispanic or Latino residents
Median household income in Huntington Park, CA in 2022:
Huntington Park:
$54,670
State:
$75,698
Change in median household income between 2000 and 2022:
Huntington Park, California:
+88.0%
State:
+107.2%
Number of households with income < $10k:
Huntington Park:
6.3% (926)
California:
4.3% (183,294)
Number of households with income $10k - 20k:
Huntington Park:
9.7% (1,426)
State:
6.0% (253,903)
Number of households with income $20k - 30k:
Huntington Park:
9.6% (1,410)
State:
6.8% (286,386)
Number of households with income $30k - 40k:
Huntington Park:
11.7% (1,709)
California:
7.4% (313,728)
Number of households with income $40k - 50k:
Huntington Park:
9.5% (1,395)
California:
7.4% (313,199)
Number of households with income $50k - 60k:
Huntington Park:
8.0% (1,175)
California:
7.2% (305,366)
Number of households with income $60k - 75k:
Huntington Park:
11.4% (1,671)
California:
10.3% (434,937)
Number of households with income $75k - 100k:
Huntington Park:
12.6% (1,840)
State:
14.4% (607,302)
Number of households with income $100k - 125k:
Huntington Park:
8.5% (1,250)
State:
10.6% (447,424)
Number of households with income $125k - 150k:
Huntington Park:
5.1% (747)
California:
7.5% (316,022)
Number of households with income $150k - 200k:
Huntington Park:
5.1% (749)
State:
9.2% (386,269)
Number of households with income > $200k:
Huntington Park:
2.5% (361)
State:
8.8% (372,651)
Aggregate household income in Huntington Park in 2022: $989,898,020
Median family income in Huntington Park in 2022:
Huntington Park:
$56,288
California:
$77,589
Number of families with income < $10k:
Huntington Park:
6.2% (736)
State:
3.9% (129,468)
Number of families with income $10k - 20k:
Huntington Park:
5.7% (673)
California:
4.6% (151,997)
Number of families with income $20k - 30k:
Huntington Park:
11.5% (1,364)
State:
6.6% (216,764)
Number of families with income $30k - 40k:
Huntington Park:
13.4% (1,582)
California:
7.6% (249,849)
Number of families with income $40k - 50k:
Huntington Park:
9.4% (1,109)
State:
7.7% (254,822)
Number of families with income $50k - 60k:
Huntington Park:
7.2% (855)
State:
7.4% (244,815)
Number of families with income $60k - 75k:
Huntington Park:
11.2% (1,327)
California:
10.5% (345,838)
Number of families with income $75k - 100k:
Huntington Park:
13.3% (1,569)
California:
14.9% (491,589)
Number of families with income $100k - 125k:
Huntington Park:
8.8% (1,036)
State:
10.7% (355,400)
Number of families with income $125k - 150k:
Huntington Park:
5.7% (670)
California:
7.8% (259,317)
Number of families with income $150k - 200k:
Huntington Park:
5.0% (592)
California:
9.3% (306,566)
Number of families with income > $200k:
Huntington Park:
2.6% (305)
State:
9.1% (299,984)
Median non-family income in Huntington Park in 2022:
Huntington Park:
$26,060
California:
$49,746
Change in median non-family income between 2000 and 2022:
Huntington Park, California:
+82.8%
State:
+100.7%
Median per capita income in Huntington Park in 2022:
Huntington Park:
$19,460
State:
$27,240
Change in median per capita income between 2000 and 2022:
Huntington Park, California:
+116.7%
California:
+133.3%
Income statistics for American Indian and Alaska Native residents
Median household income in Huntington Park, CA in 2022:
Huntington Park:
$46,262
California:
$76,752
Change in median household income between 2000 and 2022:
Huntington Park, California:
+66.3%
California:
+110.0%
Number of households with income < $10k:
Huntington Park:
7.3% (32)
State:
5.4% (8,471)
Number of households with income $10k - 20k:
Huntington Park:
13.3% (58)
State:
6.0% (9,381)
Number of households with income $20k - 30k:
Huntington Park:
0.0% (0)
California:
5.5% (8,668)
Number of households with income $30k - 40k:
Huntington Park:
20.6% (90)
California:
8.3% (13,030)
Number of households with income $40k - 50k:
Huntington Park:
14.6% (64)
California:
6.9% (10,908)
Number of households with income $50k - 60k:
Huntington Park:
2.1% (9)
State:
7.1% (11,198)
Number of households with income $60k - 75k:
Huntington Park:
11.9% (52)
State:
9.6% (15,190)
Number of households with income $75k - 100k:
Huntington Park:
24.9% (109)
State:
14.1% (22,274)
Number of households with income $100k - 125k:
Huntington Park:
0.9% (4)
California:
11.2% (17,643)
Number of households with income $125k - 150k:
Huntington Park:
0.9% (4)
California:
8.3% (13,117)
Number of households with income $150k - 200k:
Huntington Park:
3.4% (15)
State:
8.8% (13,853)
Number of households with income > $200k:
Huntington Park:
0.0% (0)
State:
8.8% (13,925)
Aggregate household income in Huntington Park in 2022: $22,558,824
Median family income in Huntington Park in 2022:
Huntington Park:
$60,570
California:
$81,108
Number of families with income < $10k:
Huntington Park:
6.8% (22)
State:
5.0% (5,711)
Number of families with income $20k - 30k:
Huntington Park:
0.8% (3)
State:
4.3% (4,876)
Number of families with income $30k - 40k:
Huntington Park:
21.0% (66)
State:
8.8% (9,994)
Number of families with income $40k - 50k:
Huntington Park:
20.3% (64)
California:
7.8% (8,776)
Number of families with income $50k - 60k:
Huntington Park:
2.8% (9)
California:
6.9% (7,834)
Number of families with income $60k - 75k:
Huntington Park:
8.8% (28)
California:
9.1% (10,247)
Number of families with income $75k - 100k:
Huntington Park:
32.8% (103)
California:
14.8% (16,731)
Number of families with income $100k - 125k:
Huntington Park:
1.1% (3)
California:
12.0% (13,609)
Number of families with income $125k - 150k:
Huntington Park:
1.1% (4)
California:
8.0% (9,104)
Number of families with income $150k - 200k:
Huntington Park:
4.6% (14)
State:
9.5% (10,721)
Median per capita income in Huntington Park in 2022:
Huntington Park:
$19,305
State:
$30,289
Change in median per capita income between 2000 and 2022:
Huntington Park, California:
+77.3%
State:
+98.9%
Income statistics for Multirace residents
Median household income in Huntington Park, CA in 2022:
Huntington Park:
$42,040
California:
$83,153
Change in median household income between 2000 and 2022:
Huntington Park, California:
+42.8%
California:
+106.0%
Number of households with income < $10k:
Huntington Park:
7.9% (357)
California:
4.2% (85,299)
Number of households with income $10k - 20k:
Huntington Park:
13.8% (624)
California:
6.1% (122,966)
Number of households with income $20k - 30k:
Huntington Park:
14.7% (663)
State:
6.4% (129,328)
Number of households with income $30k - 40k:
Huntington Park:
11.5% (519)
State:
6.4% (130,070)
Number of households with income $40k - 50k:
Huntington Park:
8.9% (402)
State:
6.5% (131,254)
Number of households with income $50k - 60k:
Huntington Park:
2.8% (127)
State:
6.5% (132,382)
Number of households with income $60k - 75k:
Huntington Park:
15.3% (689)
State:
9.4% (191,472)
Number of households with income $75k - 100k:
Huntington Park:
9.2% (414)
State:
13.3% (269,691)
Number of households with income $100k - 125k:
Huntington Park:
6.3% (285)
State:
10.2% (207,286)
Number of households with income $125k - 150k:
Huntington Park:
2.8% (125)
State:
7.8% (158,259)
Number of households with income $150k - 200k:
Huntington Park:
3.9% (175)
State:
10.3% (209,227)
Number of households with income > $200k:
Huntington Park:
3.0% (134)
State:
13.0% (263,210)
Aggregate household income in Huntington Park in 2022: $269,877,983
Median family income in Huntington Park in 2022:
Huntington Park:
$44,990
State:
$87,642
Number of families with income < $10k:
Huntington Park:
7.1% (269)
State:
3.2% (48,017)
Number of families with income $10k - 20k:
Huntington Park:
10.1% (380)
State:
4.1% (60,419)
Number of families with income $20k - 30k:
Huntington Park:
15.2% (572)
State:
6.1% (89,742)
Number of families with income $30k - 40k:
Huntington Park:
14.5% (543)
State:
6.2% (91,415)
Number of families with income $40k - 50k:
Huntington Park:
7.6% (286)
State:
6.8% (100,085)
Number of families with income $50k - 60k:
Huntington Park:
2.1% (79)
State:
6.7% (98,298)
Number of families with income $60k - 75k:
Huntington Park:
16.1% (607)
State:
9.5% (140,131)
Number of families with income $75k - 100k:
Huntington Park:
12.7% (477)
State:
13.8% (203,439)
Number of families with income $100k - 125k:
Huntington Park:
4.1% (153)
State:
10.4% (153,515)
Number of families with income $125k - 150k:
Huntington Park:
4.0% (150)
California:
8.4% (124,115)
Number of families with income $150k - 200k:
Huntington Park:
3.2% (121)
State:
10.9% (161,643)
Number of families with income > $200k:
Huntington Park:
3.3% (123)
State:
14.0% (207,317)
Median non-family income in Huntington Park in 2022:
Huntington Park:
$21,354
California:
$56,558
Change in median non-family income between 2000 and 2022:
Huntington Park, California:
+77.7%
California:
+100.2%
Median per capita income in Huntington Park in 2022:
Huntington Park:
$17,472
State:
$32,124
Change in median per capita income between 2000 and 2022:
Huntington Park, California:
+94.2%
California:
+120.4%
Income statistics for other residents
Median household income in Huntington Park, CA in 2022:
Huntington Park:
$58,894
State:
$71,383
Number of households with income < $10k:
Huntington Park:
6.2% (456)
State:
4.6% (93,035)
Number of households with income $10k - 20k:
Huntington Park:
8.3% (610)
California:
6.3% (126,222)
Number of households with income $20k - 30k:
Huntington Park:
6.7% (488)
State:
7.1% (142,656)
Number of households with income $30k - 40k:
Huntington Park:
9.3% (678)
State:
8.2% (165,018)
Number of households with income $40k - 50k:
Huntington Park:
9.3% (681)
State:
8.0% (161,732)
Number of households with income $50k - 60k:
Huntington Park:
10.9% (796)
State:
7.6% (152,152)
Number of households with income $60k - 75k:
Huntington Park:
11.2% (819)
California:
10.4% (209,951)
Number of households with income $75k - 100k:
Huntington Park:
12.6% (921)
State:
14.7% (296,102)
Number of households with income $100k - 125k:
Huntington Park:
11.8% (861)
California:
10.7% (214,281)
Number of households with income $125k - 150k:
Huntington Park:
6.7% (490)
State:
7.1% (143,092)
Number of households with income $150k - 200k:
Huntington Park:
5.7% (417)
California:
8.6% (172,215)
Number of households with income > $200k:
Huntington Park:
1.4% (102)
State:
6.7% (134,102)
Aggregate household income in Huntington Park in 2022: $513,659,316
Median family income in Huntington Park in 2022:
Huntington Park:
$61,107
California:
$72,756
Number of families with income < $10k:
Huntington Park:
6.1% (362)
State:
4.3% (69,090)
Number of families with income $10k - 20k:
Huntington Park:
5.9% (349)
California:
5.1% (82,116)
Number of families with income $20k - 30k:
Huntington Park:
8.2% (486)
State:
7.0% (112,854)
Number of families with income $30k - 40k:
Huntington Park:
10.7% (631)
State:
8.4% (135,938)
Number of families with income $40k - 50k:
Huntington Park:
8.5% (500)
State:
8.4% (135,353)
Number of families with income $50k - 60k:
Huntington Park:
9.5% (560)
State:
7.7% (124,826)
Number of families with income $60k - 75k:
Huntington Park:
10.7% (629)
State:
10.7% (173,628)
Number of families with income $75k - 100k:
Huntington Park:
13.7% (810)
State:
15.2% (245,724)
Number of families with income $100k - 125k:
Huntington Park:
13.7% (809)
State:
10.9% (176,716)
Number of families with income $125k - 150k:
Huntington Park:
6.8% (400)
California:
7.4% (119,985)
Number of families with income $150k - 200k:
Huntington Park:
4.7% (275)
California:
8.5% (137,332)
Number of families with income > $200k:
Huntington Park:
1.4% (84)
California:
6.6% (106,346)
Median non-family income in Huntington Park in 2022:
Huntington Park:
$33,023
State:
$43,881
Change in median non-family income between 2000 and 2022:
Huntington Park, California:
+117.7%
State:
+84.6%
Median per capita income in Huntington Park in 2022:
Huntington Park:
$20,354
State:
$25,164
Change in median per capita income between 2000 and 2022:
Huntington Park, California:
+136.6%
State:
+137.9%
Discuss Huntington Park, California (CA) on our hugely popular California forum.